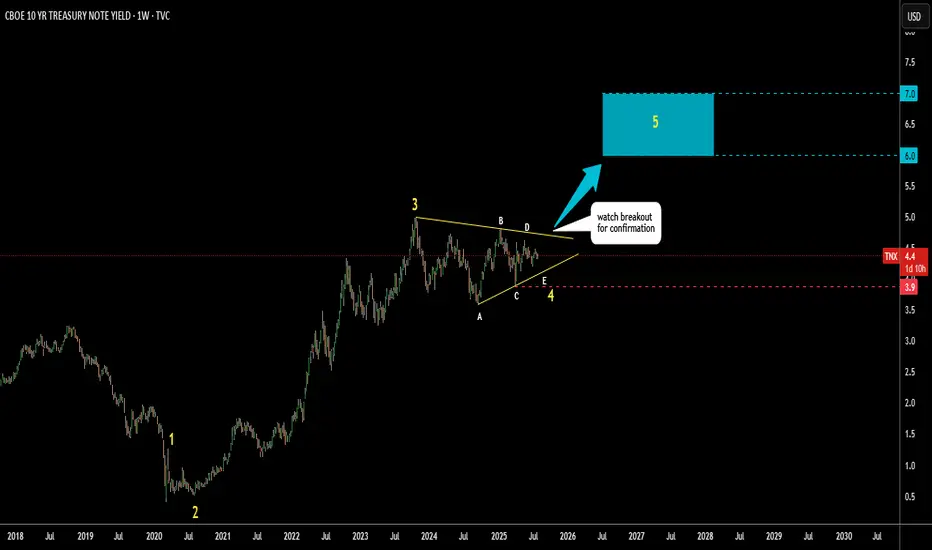
US 10Y yield: Triangular Consolidation, next 6-7%I’ve spotted a well-known triangular pattern forming on the US 10-year Treasury yield.
This appears to be the development of a large Wave 4.
Wave E of Wave 4 may still be unfolding.
Watch to see if it holds above the Wave C low at 3.9%.
A breakout above resistance near 4.7% would confirm the pattern.
The target zone is set between the 38.2% and 61.8% retracement levels of Waves 1 to 3,
highlighted with a blue box between 6% and 7%.
Could tariffs cause a major spike in yields—or will something else trigger it?
Share your thoughts in the comments below.
UST
Avalanche Foundation Acquired 1.97 Mln AVAX tokens from LFGThe Avalanche Foundation recently took a bold step to reclaim its ecosystem's autonomy by acquiring 1.97 million AVAX tokens from the liquidated Luna Foundation Guard (LFG) for $53 million. This buyback, paired with CRYPTOCAP:AVAX ’s strong technical outlook, positions Avalanche well for further growth in the evolving crypto market. Let’s dive into what this buyback means for Avalanche, its partnership history with LFG, and the technical indicators suggesting where CRYPTOCAP:AVAX might be headed next.
The AVAX Buyback
The Luna Foundation Guard (LFG) originally acquired $100 million worth of AVAX tokens from the Avalanche Foundation as part of a reserve strategy to support TerraUSD (UST), the algorithmic stablecoin of the Terra blockchain ecosystem. In return, the Avalanche Foundation received $200 million worth of UST and LUNA tokens, signaling a cross-ecosystem partnership intended to strengthen both platforms.
However, following the collapse of UST, the Avalanche Foundation faced a dilemma. The 1.97 million AVAX tokens LFG still held became a potential risk, as their future sell-off could create a major price disruption. In response, Avalanche reclaimed these tokens to mitigate uncertainty and reaffirm its commitment to the community. Aytunç Yildizli, CEO and Executive Director of the Avalanche Foundation, expressed optimism regarding this acquisition, viewing it as a reinforcement of Avalanche’s ongoing commitment to growth and development.
How the Tokens Will Be Used
Avalanche’s reclaimed AVAX tokens will be funneled into initiatives supporting its ecosystem. According to Avalanche representatives, these tokens are earmarked for community grants, ecosystem development, and technological advancements. By using the tokens in this way, Avalanche aims to foster community engagement, expand its ecosystem, and ultimately attract more projects and developers to the platform.
The Partnership with Terra
The original partnership between Avalanche and LFG was a milestone in cross-chain collaboration. By contributing $100 million worth of AVAX to UST’s reserve, Avalanche became the first major crypto asset outside of Bitcoin to support UST, expanding its role in the Terra ecosystem. The collaboration had initially sparked hopes for integrating Terra-based DeFi protocols within the Avalanche ecosystem. Although the plans were cut short by the Terra collapse, this collaboration showed the potential of cross-chain partnerships in crypto.
Technical Analysis
Despite its impressive fundamentals, CRYPTOCAP:AVAX has experienced a minor dip of 1% at the time of writing. However, the daily chart reveals a promising “Golden Cross” pattern, a technical indicator where the 50-day moving average crosses above the 200-day moving average. Historically, this pattern is considered a strong bullish signal, often indicating that the asset is primed for an upward reversal.
Yet, caution remains necessary. If selling pressure persists, CRYPTOCAP:AVAX could dip to its next support level around $24. This would provide an opportunity for accumulation, especially for those who believe in the token's long-term potential.
AVAX’s Role in the Layer-1 Ecosystem
As a leading layer-1 blockchain, Avalanche differentiates itself through its unique subnet architecture, enabling highly customizable and scalable applications. This modular approach has drawn various developers to build DeFi, gaming, and enterprise applications within the Avalanche ecosystem. With the AVAX buyback, the Avalanche Foundation signals a strategic focus on expanding and supporting these use cases, enhancing the platform’s utility and resilience.
Conclusion: Is AVAX Ready for a Rebound?
Avalanche’s proactive buyback of AVAX tokens from LFG demonstrates the Foundation’s commitment to fostering stability and long-term growth. Coupled with a Golden Cross pattern on the daily chart, these fundamentals suggest a promising outlook for $AVAX. The token remains a valuable asset for investors seeking a solid foundation within the layer-1 blockchain sector.
While short-term volatility may persist, Avalanche’s combination of technical indicators and ecosystem developments makes it well-positioned for a potential bullish trend. For investors eyeing layer-1 assets, CRYPTOCAP:AVAX offers a compelling mix of fundamentals, technical strength, and future growth potential.

🔜 20+ Year Treasury Bond Market. Perhaps This Is The End US stocks surprised much of Wall Street this year with a strong run that defied decades-high interest rates and recession calls. The rally was fueled by slower inflation and hype over artificial intelligence.
But more recently, the Federal Reserve's unwavering higher-for-longer rate stance and a deepening bond-market rout have had a sobering effect on equities sentiment, with the S&P 500 index halving its year-to-date gains.
Indeed stock valuations are looking increasingly stretched, raising the risk of a correction.
One such indicator in particular is flashing RED - the relative valuation of stocks versus the debt market.
SPX / ICE BofA Corporate Total Return Index
In August this year, the S&P 500 CBOE:SPX climbed to levels last seen during the peak of dot-com boom, relative to an index that tracks the US corporate bond market.
The gauge is still holding near those highs, despite the recent pullback in equities.
The metric last surged this high in the spring of 2000 — and that was followed by a multi-year meltdown in stocks that saw the S&P 500 crash 50% between March 2000 and October 2002.
SPX 50% Decline During 2000-2002
Another indicator that shows the richness of stocks relative to debt is the so-called equity risk premium — or the extra return on shares over government debt, which is considered a safer form of investment. The metric has plunged this year lows unseen in decades, indicating elevated stock valuations.
"Equity risk premium is near its worst ever level going back to 1927. In the 6 instances this has occurred, the markets saw a major correction & recession/depression - 1929, 1969, 99/00, 07, 18/19, present," research firm MacroEdge said in a recent post on X (ex-Twitter).
The so-called equity risk premium (earnings yield minus bond yield) recently fell to a new cycle low and remains well below historical averages. In other words, the stock market has become more expensive relative to the bond market despite the recent pullback.
Meanwhile the main graph (quarterly Div-adjusted chart for NASDAQ:TLT 20+ Year Treasury Bond ETF) illustrates perhaps right there could the end for U.S. Govt Bond Market decline, with Double top as a further projected/ targeted upside price action.
Will all of that bring U.S. stock market to 50% decline like in early 2000s!?
Time will show!

The future of Interest RatesRough map pf rate expectation without pretension of accuracy for dates nor timing...

LUNC : Riding the UST (HYPE) Wave! 🌊📈In the current crypto landscape, all eyes are on Terra Classic (LUNC), riding the waves of positive attention. Amidst the buzz, it's essential to navigate carefully, especially with its close ties to the crypto dollar, UST, striving to reclaim its 1-to-1 peg with the US dollar. Let's explore the dynamics of LUNC against the backdrop of these developments.
Chart Analysis: Riding the UST Momentum
LUNC is experiencing a remarkable surge, closely tied to the positive sentiments surrounding UST. This surge is not merely a reflection of technical indicators but is intricately woven into the narrative of the crypto dollar's revival.
Key Observations:
UST's Resurgence Impact:
The surge in LUNC is notably synchronized with the efforts of UST to reestablish its 1-to-1 peg with the US dollar.
Positive developments around UST create a favorable environment for LUNC.
News-Driven Momentum:
LUNC's recent price movements are significantly influenced by positive news and developments within the Terra ecosystem.
News-driven momentum can create rapid and volatile market reactions.
Critical Levels: Caution in News-Driven Markets
Dependency on News Flows:
LUNC's sensitivity to news events makes it crucial for traders to stay vigilant.
Prices may experience sharp swings based on the unfolding narrative.
Potential Scenarios: Navigating LUNC's Event-Driven Landscape
Strategic Positioning:
Traders should strategically position themselves, considering the potential impact of ongoing developments.
Entry and exit points may be influenced by major news releases related to Terra and UST.
Volatility Management:
Due to the news-centric nature of LUNC's recent surge, managing volatility is paramount.
Risk mitigation strategies become essential in navigating a market driven by external factors.
Trading Strategy: Adapting to Dynamic News Flows
For traders considering LUNC:
News Calendar Awareness: Stay updated with the Terra ecosystem's news calendar to anticipate potential market-moving events.
Technical Analysis Integration: Combine technical analysis with an understanding of news sentiment for a comprehensive trading strategy.
Risk-Averse Approaches: Adopt risk-averse strategies, given the potential for rapid market shifts.
Conclusion: Navigating the LUNC and UST Symbiosis
LUNC's surge is emblematic of its symbiotic relationship with UST and the broader Terra ecosystem. While this presents trading opportunities, the close ties to news events demand a cautious approach. As the crypto community watches LUNC's ascent, traders are reminded to balance optimism with strategic risk management.
🚀 LUNC Analysis | 🌐 UST Peg Dynamics | 📰 News-Driven Market
❗See related ideas below❗
Share your insights on LUNC and UST, contributing to the collective intelligence of the crypto community. As LUNC continues its journey in the limelight, community-driven analyses enrich the understanding of its market dynamics. 💚🚀💚

US debt ceiling debacle and US 10-year yieldsUS 10-year bond yields have been trending lower since Oct 2022 after touching high around 4.250%. The rise in the 10-year yield from the past two weeks saw yields stop just short of the blue 61.8% Fibo level of 3.885%. Yields are currently testing the 200-day MA rate of 3.649% and a break below will allow bonds to rally further towards the 50-day MA rate of 5.525% which coincides with the black 61.8% Fibo rate of 3.474%.
I expect bond yields to get intimidating soon as the bond rally runs out of steam. Here follows the main fundamental reasons why I believe 10-year bond yields will soon climb above 4.00%.
1. Global financial conditions are easing, and excess liquidity is rising. Short-term rates seem to be peaking not just in the US but globally. Once global rates have peaked, it will allow the market to price in a future cyclical upturn for the US economy. Longer-term yields will capture this sentiment by moving higher as investors will prefer riskier assets to reap the rewards on buoyant liquidity conditions.
2. Inflation is becoming entrenched. Bonds are not a good inflation hedge which will further motivate the sell-off in longer-term treasuries. Heightened inflation expectations are the canary in the coal mine warning that bond holders may soon demand extra yield to lend money.
3. Bond issuance will rise when the debt-ceiling debacle is resolved. Additionally, the debt ceiling has brought scrutiny to the US’s fiscal situation which will dampen investor appetite for US debt (safe haven or not). Furthermore, foreign reserve holders have begun to diversify their holdings, while elevated short-term rates have raised FX hedging costs and kept buyers like Japan away.

Luna LongI believe UST will eventually stabilize which would bounce Luna back to around 10$
This could be a great opportunity or a loss depending on how things turn out.

A Golden Opportunity
This is consolidation before the big move. Explanation on chart.
Target-1 = $ 0.029 (+50%)


US10Y - Strong support around 3.60%US10Y - Strong support around 3.60% (green line - uptrend from 2020).
Multi-decade red downtrend line, already broken.

Inescapably clear (why do I say this?)
What Is a Breakout?
What is a false breakout?
Why are you making this trade?

USDJPY falling, because of Treasury buying?Private foreigners have purchased just over half a trillion - yes, Trillion - LT USTs in the past six months (sorry, no #brettonwoods3)
Why such huge demand for safe, liquid US$ instruments? Not a whole lot of trust for the Fed's toolkit and use. © Jeff Snider
What is the reaction to buying UST's? The yields come lower. Interest rates come lower.
What does the Fed do? Follows the markets.
We're seeing a drop off in the US 10 Year Yield and this is also part of a wider yield curve inversion in the eurodollar market. Inversions signal troubles ahead, so anyone with money goes to the safest assets. Namely sovereign bonds and ultimately US sovereign debt.
The USDJPY has been tracking the move of US10Y and also either accelerated or decelerated depending on whats going on in the oil markets.
Japan is heavily dependent on importing energy, so a higher Oil price means the Japanese economy gets crushed and the yen drops. Oil prices are coming lower at present.

What is this telling us?
As shown on this chart, there are many traders, competing against one another.
as you know, this game can't last forever, so,
As calculated by Wyckoff's point and figure:
Target = $ 0.1779

The Last Ratio (Fib 61.8%)
As you know, the Fibonacci retracement levels are 23.6%, 38.2%, 61.8%, 78.6% and 85.4%.
As shown on this chart, in a lot of ways, wave b depends on wave a, Fib 85.4% -$ 0.0205 , the actual price at wave b was $ 0.021, quite close indeed.
&
(Fib 85.4% to Fib 23.6 to Fib 78.6 to Fib 38.2 , trying to disguise what they are doing)!
as a result:
The Game is about to Change (The Last Ratio - Fib 61.8%).

Three Distinct SectionsAs shown on this chart (consists of three distinct sections),
1-Impulsive decline = supply > demand,
2-Impulsive rally = demand > supply,
3- Sideways appearance = supply and demand are nearly equal.
What to expect next?
At this point, low volatility and low volume indicate a drying up of selling pressure.
Target
Point and Figure Configuration:

Under the Moon Above
Speaks for itself.
(Important long-term breakout) + (pullback) = You can make immense wealth with little investment.

Is investing gambling?
If the answer is “ No” then:
Medium Term Investment Plan
5 Up -3 Down - 5 Up (5-3-5 structure)
(30-45 days- low-risk)
Target-1 = $ 0.14
Target-2 = $ 0.37
invalidation level = $ 0.028,

30% RALLY AHEAD ON USTC WITH A BULLISH BREAKOUT 🚀Check out the trade plan for USTCBUSD today based on the technical analysis. Hope this analysis is useful, make sure to hit the thumbs and also follow my tradingview profile for future updates. Thank you!
Expecting a bull breakout on the following falling wedge pattern identified. Where we have completed the 5 waves in the bear trend recently. This can be supported by the support highlighted for a bullish reversal here for a decent 30% gain ahead.

Bull flag pattern
Two distinct parts:
1-high volume; a near vertical flag pole.
2- low volume: a parallel consolidation comprised of 4 points.
What might this be (as bright as a light bulb) ?
Target-1 = $ 0.07

LUNA🌑 round-trippingPlease 1st of all click the boost 🚀 button if you want me to post more ideas and follow me to support my work! It's absolutely for free. Don't be just a taker, be a giver! 👍🏻
What do I mean by the "roundtrip"? Please check the idea down below:
So after the call I did, LUNA mooned big time and gained 3.5x in matter of hours. Subsequently she got hammered hard and I think we are not done yet. Price is consolidating inside this long triangle for almost a week and if broken down then my guess is that LUNA can spill as low as 1.46, so it would retrace the whole pump and then some! The decision point (triangle apex) is coming so expect breakout either way soon. Critical levels (bearish/bullish) shown in blue. BTW the bearish level @ 2.48 coincides with the TARGET1 from original idea. Please zoom in to see the triangle and other stuff in detail.
Check my other stuff in related ideas.
Please boost🚀, comment🗣️, follow me✒️, enjoy📺!
⚠️Disclaimer: I'm not financial advisor. This is not a financial advice. Do your own due dilingence.


Terra Classic LUNC Bearish Sentiment Friday the S&P reached its 52 week low, $3636. There is a strong correlation between the S&P and the crypto world. Many stock investors diversified their portfolio into cryptos, especially in BTC Bitcoin and ETH Ethereum .
With a bearish stock market in the worst month for stocks and cryptos, i expect most of the cryptocurrencies to trade lower this week.
LUNC/USDT short
Entry Range: $0.0002300 - 0.0002500
Take Profit 1: $0.0001700
Take Profit 2: $0.0001330
Take Profit 3: $0.0001120
Stop Loss: $0.0002820
previews short signal

LUNA2 Looks Like it Wants to Test The Range Highs Very SoonIt looks like LUNA2 is still trading at the lows of the Range and has formed a small Bullish Gartly at these lows with some Bullish Divergence on the RSI I think we will see LUNA2 rising towards the highs of this range in the midterm while LUNC continues to decline into the One-10-Thousandths .
