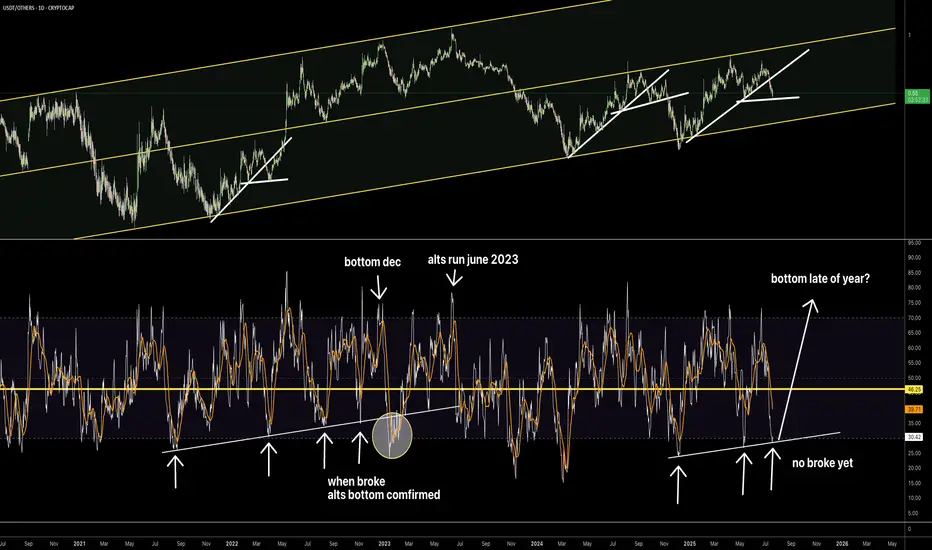
Where is the altcoin bottom?Hi everyone — keep a close eye on the 1D RSI of the USDT/OTHERS chart. As long as it holds, we’ll keep bouncing and seeing corrections. Only after it breaks can we start talking about a trend reversal.
USDT trade ideas
Altcoins are in a similar channel as in 2022–2023.I believe that as long as the interest rate stays at 4.5%, we won’t see real growth in altcoins — only short-term pumps. Rate cuts are expected to begin in the summer, but it will take some time to have an effect. I would compare the current market to both 2019 and 2022.


ETH Bottomed last week!This chart illustrates the ratio of the market capitalization of the top three stablecoins and that of Ethereum (ETH).
The correlation is quite evident, as anticipated.
We are likely approaching a phase where these stablecoins will be deployed, with Ethereum being a key beneficiary, signalling that we are entering a period of increased risk appetite and overall market buoyancy.
#ALTS
#USDT
#USDC
#DAI
#ETH

My best-case scenario for ALTSFew people look at custom charts, and that’s a pity, because there’s a lot of truth to be found there. We’ve got fear in the market, and hardly anyone wants to buy right now.

USDT vs. ETH: A Silent Signal for the Crypto Market?We often scrutinize the price charts of volatile cryptocurrencies, but a look at stablecoin market capitalization can reveal surprising insights.
Recently, Tether's USDT market cap chart caught my eye, particularly when juxtaposed with leading cryptocurrencies.
While comparisons with Bitcoin have shown interesting correlations between USDT supply and broader market cycles, it's the comparison with Ethereum (ETH) that raises a compelling question.
The chart shows that Bitcoin along with several other cryptocurrencies have exceeded their 2021 price highs yet Ethereum remains below its previous peak. The market capitalization of USDT increased by 75% from 2021 to present day.
This divergence is noteworthy. The growth of USDT's market cap signifies an increase in its circulating supply, presumably driven by inflows of USD (or equivalent) into Tether's reserves.
Why would people exchange their fiat for USDT if they did not plan to use the funds within the cryptocurrency space?
The rising demand for USDT coins indicates that market participants expect increased crypto market activity.
However, the fact that USDT's growth significantly outpaces Ethereum's price recovery suggests a potential disconnect.
Either there's an unusual surge in demand for USDT for purposes outside of immediate crypto investment (less likely), or significant capital is being positioned on the sidelines, potentially waiting for strategic entry points.
Considering recent reports of increasing activity in large Bitcoin accumulation addresses, the latter scenario seems more plausible.
The large increase in USDT market capitalization together with Ethereum's flat price performance compared to its former peak might indicate substantial accumulation activities that could lead to future market movements.

Say No To Treasury-backed or institutional stablecoins Treasury-backed or institutional stablecoins are detrimental to crypto!
These will ultimately lead to stablecoins that are programmable money.
In other words, the issuers of these stablecoins will be able to manipulate them at will, freeze, burn, or inflate them as they please, rather than allowing the market to dictate.
This will foster more centralization, which goes against the entire ethos of crypto!
Like and repost this to spread the message that we do not like this, and follow me to join the fight.
Governments and institutions are harmful to crypto! @CryptoJayTrades

Liquidity entering the marketIn February, we may have experienced the greatest trap in Crypto Cycles, where the expected outcome was supposed to favor ETH and Alts, but instead, market makers pushed the price against all odds, using the narrative of tariffs against the retail investors.
A very nice M formation buildup failed to complete its form, increasing the liquidity exponentially, a trend that I expect to continue in a more aggressive way soon.
In my view, the next 2 weeks will see some compression on the charts of most large caps, time in which some alts will pump massively, after which we would either touch MA9 and bounce, or test MA14 and potentially see BTC price retesting the 70k range again, before a major pump pushes everything above any expected ATH.

Dow Theory Part 1 | Univers Of Signals AcademyWelcome to the Educational Content Section of Our Channel Technical Analysis Training
We aim to produce educational content in playlist format that will teach you technical analysis from A to Z. We will cover topics such as risk and capital management, Dow Theory, support and resistance, trends, market cycles, and more. These lessons are based on our experiences and the book The Handbook of Technical Analysis
🎨 What is Technical Analysis?
Technical Analysis (TA) is a method used to predict price movements in financial markets by analyzing past data, especially price and trading volume. This approach is based on the idea that historical price patterns tend to repeat and can help traders identify profitable opportunities.
🔹 Why is Technical Analysis Important?
Technical analysis helps traders and investors predict future price movements based on past price action. Its importance comes from several key benefits:
Faster Decision-Making: No need to analyze financial reports or complex news—just focus on price patterns and trading volume.
Better Risk Management: Tools like support & resistance, indicators, and chart patterns help traders find the best entry and exit points.
Applicable to All Markets: Technical analysis can be used in Forex, stocks, cryptocurrencies, commodities, and even real estate.
Understanding Market Psychology: Charts reveal investor emotions like fear and greed, allowing traders to react accordingly.
📌 Real-Life Example
Imagine you own a mobile phone shop and want to predict whether phone prices will go up or down in the next few months.
🔹 Fundamental Analysis Approach
You follow the news and see that the USD exchange rate is rising, and phone manufacturers plan to increase prices. Based on this, you predict that phone prices will go up soon.
🔹 Technical Analysis Approach
You analyze past price trends and notice that every year, phone prices tend to increase before the New Year. This pattern has repeated for several years, so you assume it will happen again. As a result, you buy stock before the price hike and make a profit.
This example shows that technical analysis allows you to make decisions based on past market behavior without relying on external news.
📊 Introduction to Dow Theory
Today, for the first part of our lessons, we will begin with Dow Theory, which was developed by American journalist Charles Dow. Many traders still use this method for analysis and trading.
Dow Theory is one of the fundamental concepts in technical analysis, developed by Charles Dow, the founder of The Wall Street Journal and co-founder of the Dow Jones Industrial Average (DJIA). This theory provides a structured approach to understanding market trends and price movements and is still widely used today by traders and analysts.
Dow Theory consists of six core principles, which we will explain in detail:
📑 Principles of Dow Theory
1 - The Averages Discount Everything (Not applicable to crypto)
2 - The Market Has Three Trends
3 - Trends Have Three Phases
4 - Trend Continues Until a Reversal is Confirmed
5 - The Averages Must Confirm Each Other
6 - Volume Confirms the Trend
💵 Principle 1: Price is All You Need
According to this principle, all available information is already reflected in asset prices. This includes economic data, political events, earnings reports, trader expectations, and even market sentiment.
If a company releases strong earnings, its stock price might not rise significantly because investors had already anticipated this and bought in advance.
❗ Why This Is Important
Technical analysts focus on price movements rather than external news since all information is already factored into the market.
Instead of reacting to news, traders analyze historical price trends to predict future price movements.
📊 Principle 2: The Market Has Three Types of Trends
Dow Theory states that markets move in three types of trends, each occurring over different timeframes:
1 - Primary Trend: This is the main movement of the market, dictating the long-term direction, and can last for years.
2 - Secondary Trends: These are corrective movements that run opposite to the primary trend. For instance, if the primary trend is bullish, the corrective trend will be bearish. These trends can last from weeks to months.
3- Minor Trends: These are the daily price fluctuations in the asset. Although minor trends can last for weeks, their direction will always align with the primary trend, even if they contradict the secondary trend.
💡 Final Thoughts for Today
This is the end of this part, and I must say we have a long journey ahead. We will continually strive to produce better content every day, steering clear of sensationalized content that promises unrealistic profits, and instead, focusing on the proper learning path of technical analysis.
⚠️ Please remember that these lessons represent our personal view of the market and should not be considered financial advice for investment.

Prepare for the possible capitulation of altcoinsAnother chart that tells me of a possible impending altcoin capitulation in the next 2 months, let's see how it plays out.

The Coin Market is Different from the Stock Market
Hello, traders.
If you "Follow", you can always get new information quickly.
Please also click "Boost".
Have a nice day today.
-------------------------------------
The coin market discloses a lot of information compared to the stock market.
Among them, it discloses the flow of funds.
Most of the funds in the coin market are flowing in through USDT, and it can be said that it currently manages the largest amount of funds.
Therefore, unlike the stock market, individual investors can also roughly know the flow of funds.
Therefore, you can see that it is more transparent than other investment markets.
-
USDT continues to update its ATH.
You can see that funds are continuously flowing into the coin market through USDT.
USDC has been falling since July 22 and has not yet recovered.
The important support and resistance level of USDC is 26.525B.
Therefore, if it is maintained above 26.525B, I think there is a high possibility that funds will flow in.
If you look at the fund size of USDT and USDC, you can see that USDT is more than twice as high.
Therefore, it can be said that USDT is the fund that has a big influence on the coin market.
USDC is likely to be composed of US funds.
Therefore, if more funds flow in through USDC, I think the coin market is likely to develop into a clearer investment market.
But it is not all good.
This is because the more the coin market develops into a clearer investment market, the more likely it is to be affected by the existing investment market, that is, the watch market.
This is because large investment companies are working to link the coin market with the coin market in order to make the coin market an investment product that they can operate.
In order for the coin market to be swayed by the coin-related investment product launched in the stock market, more funds must flow into the coin market through USDC.
Otherwise, it is highly likely that it will eventually be swayed by the flow of USDT funds.
Therefore, USDC is likely to have a short-term influence on the coin market at present.
-
As mentioned above, the most important thing in the investment market is the flow of funds.
The flow of funds in the coin market can be seen as maintaining an upward trend.
Therefore, there are more and more people who say that there are signs of a major bear market these days, but their position seems to be judging the situation from a global perspective and political perspective.
As mentioned above, the funds that still dominate the coin market are USDT funds, which are an unspecified number of funds.
Therefore, I think that the coin market should not be predicted based on global perspectives and political situations.
The start of the major bear market in the coin market is when USDT starts to show a gap downtrend.
Until then, I dare say that the coin market is likely to maintain its current uptrend.
------------------------------------
(BTCUSDT 1D chart)
The StochRSI indicator is approaching its highest point (100), and the uptrend is reaching its peak.
Accordingly, the pressure to decline will increase over time.
-
(1W chart)
The StochRSI indicator is also in the overbought zone on the 1W chart.
-
(1M chart)
On the 1M chart, the StochRSI indicator is showing signs of entering the overbought zone, but it is not expected to enter the oversold zone due to the current rise.
The movement of the 1M chart should be checked again when a new candle is created.
-
You can see that the StochRSI indicator on the 1M chart is the most unusual among the three charts above.
In the finger area on the 1M chart, the StochRSI indicator was in the overbought zone, but it is currently showing signs of entering the oversold zone.
Therefore, you can see that the current movement is different from the past movement.
Therefore, I think it is not right to predict the current flow by substituting past dates.
------------------------------------------
I wrote down my thoughts on the recent comments from famous people who say that the coin market will enter a major bear market along with the stock market.
-
Have a good time. Thank you.
--------------------------------------------------
- Big picture
It is expected that the real uptrend will start after rising above 29K.
The section expected to be touched in the next bull market is 81K-95K.
#BTCUSD 12M
1st: 44234.54
2nd: 61383.23
3rd: 89126.41
101875.70-106275.10 (overshooting)
4th: 134018.28
151166.97-157451.83 (overshooting)
5th: 178910.15
These are points where resistance is likely to be encountered in the future. We need to see if we can break through these points.
We need to see the movement when we touch this section because I think we can create a new trend in the overshooting section.
#BTCUSD 1M
If the major uptrend continues until 2025, it is expected to start by creating a pull back pattern after rising to around 57014.33.
1st: 43833.05
2nd: 32992.55
-----------------

Capitulation of altcoins OTHERSAs you can see on the chart we are repeating the pattern exactly as it was in 2021, it is not a fact that it'll work, but we need to keep a close eye on ema21 1d, if this chart continues to grow and hold on ema21 as a support, there is a high probability to see the capitulation of altcoins and the whole market before the end of the year.

USDT Market cap & Bitcoin Price Update"$15k to $74k"...In this bitcoin rally, market dumped total 5 times 📉
But every time the CRYPTOCAP:USDT market cap is just going UP📈 Whales are pumping market by buying every dip🚀
After touching $74K, btc price dumped -32% but USDT Market cap pumped almost +16%
It indicates that usdt is printed daily to buy the dips!
pbs.twimg.com
_
2017 : USDT MCAP 1.4B - BTC ATH 20K
2021 : USDT MCAP 82B - BTC ATH 69K
2024 : USDT MCAP is now 118B - BTC Price is $60K
USDT pumped +44% but btc still below previous ATH
The Bull Run is not over!
pbs.twimg.com
Please hit the LIKE button to support my work and share your thoughts in the comment section.
Thanks
cnb006


12 Month bearish confirmation begins the post-scarcity economyThe end of all currency is coming!
Post-scarcity economy is coming. No currency nor value in the future. Money is creating havoc in this world
of competition and its coming to an end. Cost of living is free in the coming future so investing is a big
waste of time and resources. As you can see the motivation in the markets is dying. Debt can no longer
support the world economy any longer. The world is changing to save ourselves from extinction.
No currency No investments No competition creates equality and richer lives with deeper meaning.
There is no future if cost of living continues to rise and climate change affects global health and stability.
A brave new world is about to happen and millions of wealthy people will not like losing there status.
Enrich your lives and focus on reflection of ones self. Life is meaningless as a slave to cost of living.
The End of value creation to promote wealth of knowledge.
Artificially creating inflation creates inflation. Without cost of living the world will begin to heal
from climate change. Poverty and inequality will become extinct or the human race will become
extinct. Resources are precious and so is life.

USDT/ADA Trade - Looking Temporarily BearishWill likely see a short decline in price for a quick daily short trade. in the coming months the winds may change. Ill update the trade for those whom are trading longer term.
Targets won't be specified. But could be every step of the way in increments of .5%

Why Stablecoin Growth a leading Indicator for Bitcoin's PriceStablecoin fundamentals could help shine a light on what's next for #bitcoin.
Periods, where USDT market-cap growth falls to zero on my index, have consistently been turning points for Bitcoin, typically leading to rallies higher.
In my opinion, we are at a point similar to Feb 2024.
👉If liquidity starts to grow in stablecoins, we could see the next leg higher start.


📊💹 Tether (USDT) Market Insights 🌐📈📈 Market Cap Growth:
Tether's market cap increased by 4.7% in 2024, equivalent to $4.3 billion.
Indicates significant inflows of capital into Tether.
📉 Notable Observations:
Consistent spikes during New York sessions, specifically at 07:00 NY Local Time.
💹 Recent Inflow:
In the last two days alone, Tether experienced an inflow of just above $1 billion.
📈 Market Outlook:
The crypto market in 2024 appears poised for growth to new levels.
📣 Conclusion:
Tether's market cap growth and consistent inflows during specific sessions suggest increased market activity and potential positive sentiment.
Stay tuned for further market developments! 📰💹 #Tether #USDT #CryptoMarket 🌐📊

USDT : Breaking away from the downtrend by increasing the gapHello traders!
If you "Follow" us, you can always get new information quickly.
Please also click “Boost”.
Have a good day.
-------------------------------------
(USDT chart)
(1D chart)
It appears that the gap decline that started on January 19th has stopped and a larger gap rise has occurred.
Due to this gap increase, the reported price (ATH) was renewed again.
-------------------------------------
(USDC chart)
It is still on the rise.
The key is whether USDC can continue its gap upward trend above 26.525B.
I believe that the gap between USDT and USDC shows the inflow and outflow of funds into the coin market.
Therefore, the gap rise can be interpreted as funds flowing into the coin market.
Since the movements of USDT or USDC through transactions are expressed as candles, I think the occurrence of gaps should be distinguished.
---------------------------------------
(BTC.D chart)
You need to check in which direction it deviates from the 51.17-51.98 section.
----------------------------------------
(USDT.D chart)
(1D chart)
USDT dominance is entering a period of volatility from January 22-27.
Accordingly, after the volatility period has passed, you need to check which direction it deviates based on the 5.89-6.39 range.
When a gap rises in USDT, a gap rise in USDT dominance also occurs.
Accordingly, USDT or USDT dominance is likely to show an upward trend.
However, USDT dominance can be seen decreasing through trading.
A decline in USDT dominance means that buying power has increased through many transactions in the USDT market.
Therefore, if USDT dominance falls, the coin market is likely to show an upward trend.
Even though USDT is renewing its new high (ATH), USDT dominance overall is showing a downward trend.
In order for this downward trend to turn into an upward trend, it is expected that it will have to rise above 7.14.
The most important question is whether the coin market becomes more active and more transactions occur, leading to a continued downward trend in USDT dominance.
Have a good time.
thank you
--------------------------------------------------
- The big picture
The full-fledged upward trend is expected to begin when the price rises above 29K.
This is the section expected to be touched in the next bull market, 81K-95K.
#BTCUSD 12M
1st: 44234.54
2nd: 61383.23
3rd: 89126.41
101875.70-106275.10 (when overshooting)
4th: 13401.28
151166.97-157451.83 (when overshooting)
5th: 178910.15
These are points that are likely to encounter resistance in the future.
We need to see if we can break through these points upward.
Since it is thought that a new trend can be created in the overshooting area, you should check the movement when this area is touched.
If the general upward trend continues until 2025, it is expected to rise to around 57014.33 and then create a pull back pattern.
1st: 43833.05
2nd: 32992.55
-------------------------------------------------- -------------------------------------------
** All explanations are for reference only and do not guarantee profit or loss in investment.
** Trading volume is displayed as a candle body based on 10EMA.
How to display (in order from darkest to darkest)
More than 3 times the trading volume of 10EMA > 2.5 times > 2.0 times > 1.25 times > Trading volume below 10EMA
** Even if you know other people’s know-how, it takes a considerable amount of time to make it your own.
** This chart was created using my know-how.
---------------------------------

USDT # 001 ( Don’t surprise of market Surge $$$ ) Hello dear traders.
Good days .
On weekly Gann Square USDT is at 0.5 Gann Box reversal Time Zone And expected to one more time test rejected Gann Square Fan Line .
Which this surge monthly Gann Box Fib price level will broken and if any pullback be in progress it will get support from mentioned level which is coincide with weekly Gann Square reversal price zone .
Monthly Gann Square over view will update.
Chart updated and route plotted with help of Gann Square and Gann Box.
Good luck and safe trades.
Thanks for your support and comments

USDT Chart: Maintaining a continuous upward trendHello traders!
If you "Follow" us, you can always get new information quickly.
Please also click “Boost”.
Have a good day.
-------------------------------------
(USDT chart)
USDT is a representative fund transfer channel in the coin market.
USDT maintaining its upward trend means that funds are continuously flowing into the coin market.
At this time, it should appear to be rising while creating a gap.
--------------------------------------------
(USDC chart)
The key is whether the downward trend that began in July 2022 can be stopped and turned into an upward trend.
To do so, it is important whether it can rise above 26.525B.
We believe that USDC has less influence on the coin market because there are fewer exchanges or trading pairs supported than the USDT market.
----------------------------------------------
(BTC.D chart)
In order for the coin market to begin a major bull market, I believe that BTC dominance must rise above 61 and then begin to decline.
BTC dominance fails to fall below 51.17 and shows an upward trend.
A rise in BTC dominance means that funds are being concentrated towards BTC.
Therefore, altcoins are likely to exhibit greater volatility than BTC.
I don't think it's a good idea to predict the rise and fall of BTC or altcoins based on the rise and fall of BTC dominance or USDT dominance.
This is because I think it is a chart that shows how the money flow in the coin market is moving.
------------------------------------------------
(USDT.D chart)
If USDT dominance remains below 5.89, I think the coin market is likely to show an upward trend.
Accordingly, it is expected that an altcoin bull market will begin when USDT dominance remains below 5.89 and BTC dominance falls below 50.
An altcoin bull market refers to a bull market in which anyone can make a profit no matter what coin (token) they purchase.
Currently, BTC dominance is showing an upward trend, but USDT dominance is still below 5.89.
Therefore, it can be interpreted that the coin market is still maintaining an upward trend.
If USDT dominance rises above 6.39, the coin market is likely to turn into a downward trend, so caution is required when trading.
-------------------------------------------------- -
BTC's price volatility is bound to have a significant impact on the coin market.
However, it is the funds that make the volatility visible.
Therefore, I believe that if you do not know how money flows, you cannot truly know the BTC price trend.
In that sense, I think individual investors should observe the USDT, USDC, BTC.D, and USDT.D charts, which can provide some insight into the fund flow in the coin market.
You can tell whether funds are flowing into or out of the coin market depending on whether they are rising or falling by creating a gap on the USDT or USDC chart.
The BTC.D chart allows you to see whether the funds flowing into the coin market are concentrated towards BTC or altcoins.
A decline in USDT dominance means that coins are being purchased with USDT, so the coin market is likely to show an upward trend.
However, USDT dominance can only reveal the overall trend of the coin market and should not be used to predict the rise or fall of BTC's price.
Have a good time.
thank you
--------------------------------------------------
- The big picture
The full-fledged upward trend is expected to begin when the price rises above 29K.
This is the section expected to be touched in the next bull market, 81K-95K.
#BTCUSD 12M
1st: 44234.54
2nd: 61383.23
3rd: 89126.41
101875.70-106275.10 (when overshooting)
4th: 13401.28
151166.97-157451.83 (when overshooting)
5th: 178910.15
These are points that are likely to encounter resistance in the future.
We need to see if we can break through these points upward.
Since it is thought that a new trend can be created in the overshooting area, you should check the movement when this area is touched.
If the general upward trend continues until 2025, it is expected to rise to around 57014.33 and then create a pull back pattern.
1st: 43833.05
2nd: 32992.55
-------------------------------------------------- -------------------------------------------
** All explanations are for reference only and do not guarantee profit or loss in investment.
** Trading volume is displayed as a candle body based on 10EMA.
How to display (in order from darkest to darkest)
More than 3 times the trading volume of 10EMA > 2.5 times > 2.0 times > 1.25 times > Trading volume below 10EMA
** Even if you know other people’s know-how, it takes a considerable amount of time to make it your own.
** This chart was created using my know-how.
---------------------------------

USDT Model This my explanation of USDT printing
Supporting price action
We have seen an expansion of Billions printed out if thin air Money has come right back into the system
will be watching this Market cap as we head into the new year
Think the only black swan we can get to achieve lower prices is if USDT fud narrative hits before
ETF approval witch I believe comes before halving in JAN-March leaning towards March
