Equities is going to break the box after FOMCMy new view after FOMC, the shoulder head shoulder was invalid, now I focus to next resistant at 13000.
Ustech100

NASDAQ ''USTEC'' possible sell chance Those who asked about the analysis of NASDAQ'' USTEC''
We believe that US indices specially USTEC are about to drop. we see that the price is repeating itself, we have done our analysis using other different techniques and it confirmed that scenario.
Please use proper risk management.

us tech 100 short entry after failed pullback not financial advice
tell in comment what do you think
and if take this trade

Nasdaq Analysis Hello Everybody.
Today nasdaq came and retested 12150, a level which got broken last week. I know expect price to carry on pushing back to areas of 12544 and break from here taking us to 12820. Its a very clear drawing where you can see exactly what has happened so far. How price reacted at the area of support which was once a area of resistance. If I see 12150 get broken and prices decides to push down then this analysis will be invalid and I will have to reanalyse but for now its a bullish market.

This is a long term buy, the chart needs to retraceThis chart will make Buy Side liquidity, take stops out before plummeting down. This is a necessary 6.15% retracement to the downside, Risky trade as Nas doesn't usually retrace and trend is generally bullish. Would add more margin after the trendlines all break to the downside. #Nasdaq #Nas #Bears

S&P, Masdaq, Dow jones similar biasI’m expecting the price to take highs first before going down and price could be extended to the marked areas in premium PD ARRAYS, will definitely look for proper price action on lower timeframe to get a proper entry, but the chart is
showing my overall view of HTF i.e. Daily

Nasdaq Analysis Today we may get some pullbacks before any continuation of the bulls. Price may come back to 12235-12158. However if price does carry on pushing up the we will need a break of the channel next and then we can see price go even higher to 12950 areas!!
I have drawn the key areas for bulls and bears. Be patience and keep a eye on how price plays.

Netflix: Buy Netflix and Chill?Netflix - Short Term - We look to Buy at 207.40 (stop at 185.40)
Continued upward momentum from 164.28 resulted in the pair posting net daily gains yesterday. Price action looks to be forming a bottom. Previous resistance level of 207.41 broken. We have a Gap open at 333.22 from 19/04/2022 to 20/04/2022. Further upside is expected although we prefer to set longs at our bespoke support levels at 207.40, resulting in improved risk/reward.
Our profit targets will be 330.00 and 400.00
Resistance: 248.70 / 329.82 / 333.22
Support: 207.41 / 169.70 / 164.28
Disclaimer – Saxo Bank Group. Please be reminded – you alone are responsible for your trading – both gains and losses. There is a very high degree of risk involved in trading. The technical analysis, like any and all indicators, strategies, columns, articles and other features accessible on/though this site (including those from Signal Centre) are for informational purposes only and should not be construed as investment advice by you. Such technical analysis are believed to be obtained from sources believed to be reliable, but not warrant their respective completeness or accuracy, or warrant any results from the use of the information. Your use of the technical analysis, as would also your use of any and all mentioned indicators, strategies, columns, articles and all other features, is entirely at your own risk and it is your sole responsibility to evaluate the accuracy, completeness and usefulness (including suitability) of the information. You should assess the risk of any trade with your financial adviser and make your own independent decision(s) regarding any tradable products which may be the subject matter of the technical analysis or any of the said indicators, strategies, columns, articles and all other features.
Please also be reminded that if despite the above, any of the said technical analysis (or any of the said indicators, strategies, columns, articles and other features accessible on/through this site) is found to be advisory or a recommendation; and not merely informational in nature, the same is in any event provided with the intention of being for general circulation and availability only. As such it is not intended to and does not form part of any offer or recommendation directed at you specifically, or have any regard to the investment objectives, financial situation or needs of yourself or any other specific person. Before committing to a trade or investment therefore, please seek advice from a financial or other professional adviser regarding the suitability of the product for you and (where available) read the relevant product offer/description documents, including the risk disclosures. If you do not wish to seek such financial advice, please still exercise your mind and consider carefully whether the product is suitable for you because you alone remain responsible for your trading – both gains and losses.

NASDAQ 100 short ideaGood day traders, today's exhibit is NAS100 / USTEC100 short on a 1H timeframe with a reward a little over 3x the risk. Happy trading.

NASDAQ is looking good for a buy NASDAQ moving in ascending channel and making new higher highs so its a good buy call

Nasdaq Analysisnasdaq has made a pullback to 11998 area. If this area is respected price will push back down to 11900 area before breaking to push further down to 11700 area.
However if price breaks 11998 area upwards then we may see bulls come right back in pushing price up to 12100 area.

US100 short US100 is presenting a consolidation and a Squeezing of price indicating a potential Impulsive move.
US100 is in a Current bear market and it's presenting a bearish pennant that will give confluence to the pair,I find it better to take continuation patterns on a Trending market as they yield a higher ROI than reversal Structures
It failed to break overall price value at the Peak of the Range showing a strong selling momentum on US100.

Nasdaq Analysis As previously analysed the market is moving inside a triangle. We have now reached the top of this triangle which is also the monthly resistance area. Price should push back down. However if we do break out of this triangle to the upside, I expect price to retest and continue going up and my target will be area of 12500 first stop. I will analysis lower timeframe later on so do keep a eye out.

US TECH 100Us tech on double top at daily time frame, on lower time frame need to breakout for further up side move other wise sell trade can be taken after rejection candle as mentioned on chart.


Nasdaq higher TF Analysis Hello Everyone,
Nasdaq hit the monthly area of resistance last week and then pushed the price back down. We can see a triangle has been formed and from previous analysis you have seen how this triangle plays. Usually indicates a bearish move down. We may see price pushing back up to the monthly resistance once more before we get this break down. However there is always a chance price can still break up however for this analysis I will focus purely on the bearish sentiment right now.

USTECH.F Break Trendline , next charge break resistance ?4H Timeframe , break trendline and charge next resistance

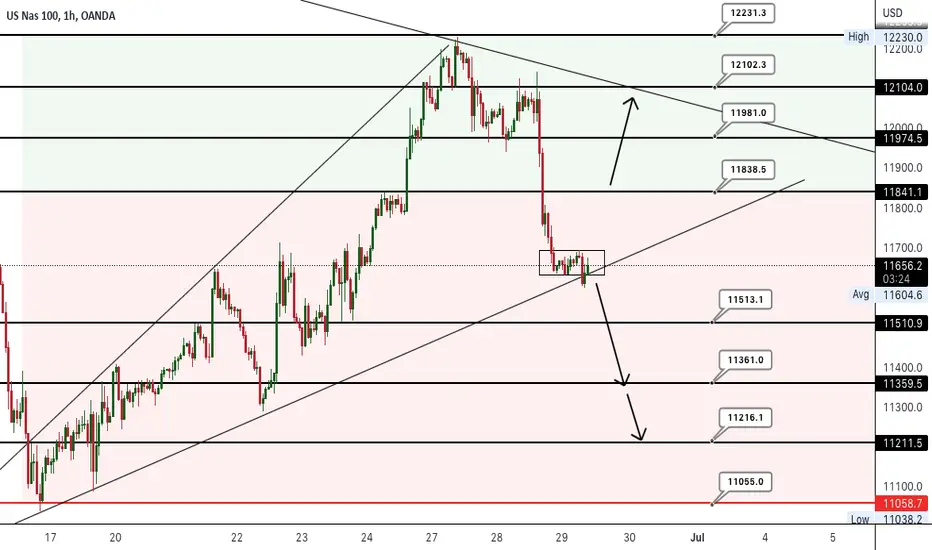
Nasdaq Analysis Hello Everyone,
We are now approaching month end and its going to be a interesting end. Yesterday bearish move changed the market quite a bit. The hope we had for the buyers have now all changed around and we see the bears right back in.
Today if price breaks down we can see it come to the next support 11513-11361, if this breaks then 11216- 11038 (Previous lows). For the buyers to come back in I will wait to see if we break 11838 for any hope. This area of 11838 must be broken for buyers to come back in
I have highlighted the bulls and the bears area. Try not to look for buys in the bear area and vice versa as you may get trapped.
Possible double top on Nasdaq 100 FuturesIn my analysis I'm seeing a possible double-top on Nasdaq 100.
SL above the supply zone and above the resistance.
TP1: 11285
TP2: 11037


US TECH 100Us tech entering his strong selling at 11700 ,rejection from this zone can take short trade at lower time frame of 15m with stoploss above market zone.

US TECH 100Us tech 100 is struggling at demand zone ,at lower time frame can hit mentioned tp after some consoladition . Major stoploss and immediate SL both mentioned on chart with TP.

NAS100 (LONG)Hello traders, in July 2021 and again in February this year we called for a retest in price on this level and finally price is right at our level, with all the further crash talks on the stock market, to me it was expect for things to be like this and I think from here on if I'm indeed right we will see Nas100 recovering.
Right now there's panic as advisors are advising investors to sell only to buy again when prices are lower because of a further crash but what if this is that low? Haruki Murakami said it well when he said "Everyone, deep in their hearts, is waiting for the end of the world to come."
