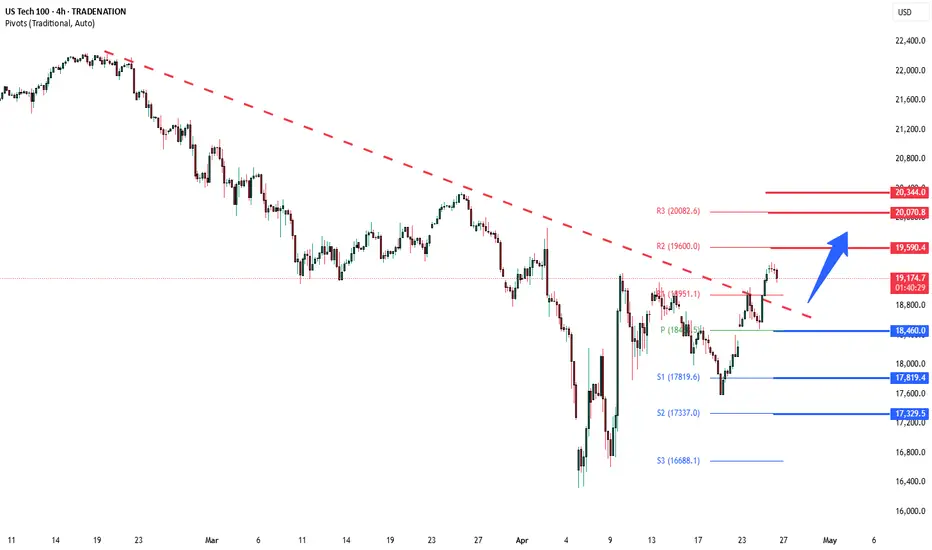
NSDQ100 INTRADAY trend change supported at 18950 Key Support and Resistance Levels
Resistance Level 1: 19590
Resistance Level 2: 20070
Resistance Level 3: 20344
Support Level 1: 18460
Support Level 2: 17820
Support Level 3: 17330
This communication is for informational purposes only and should not be viewed as any form of recommendation as to a particular course of action or as investment advice. It is not intended as an offer or solicitation for the purchase or sale of any financial instrument or as an official confirmation of any transaction. Opinions, estimates and assumptions expressed herein are made as of the date of this communication and are subject to change without notice. This communication has been prepared based upon information, including market prices, data and other information, believed to be reliable; however, Trade Nation does not warrant its completeness or accuracy. All market prices and market data contained in or attached to this communication are indicative and subject to change without notice.
Ustech100

Microsoft in Focus Ahead of Key Earnings, AI Outlook Under WatchMacro:
- Microsoft (MSFT) climbed on cautious optimism ahead of major earnings and economic data.
- Four of the “Magnificent Seven,” AMZN, AAPL, META, and MSFT, are set to report, with investors focusing on Microsoft (MSFT) today.
- Wall Street expects EPS of 3.22 USD and revenue of 68.44 B USD, both up YoY. Microsoft’s strength in AI, cloud, and enterprise software, along with its continued investment in AI talent and solid dividend history, makes this a closely watched report.
- Key drivers will be its results, AI/cloud growth outlook, and forward guidance, while any surprises could shift the stock sharply.
Technical:
- MSFT recovered and tested the resistance at around 396, confluence with EMA78. The price is sideways, and we await a clearer breakout to determine the following direction.
- If MSFT breaks above 396, the price may approach the following resistance at 405, confluence with the 100% Fibonancci Extension.
- On the contrary, remaining below 396 may prompt a retest to the support at around 378, confluence with the broken descending channel.
Analysis by: Dat Tong, Senior Financial Markets Strategist at Exness

Nasdaq analysis: 30-APRIL-2025Good morning. Welcome to today's Nasdaq market analysis and educational insights for price action traders.

TSLA Potential Post Tariff Resolution Bullish RallyDespite uncertainty still looming over the current global tariff based environment, TSLA price still seems to exhibit signs of a potential Bullish breakout as the price action may form a prominent Higher Low on the longer timeframes with multiple confluences through key Fibonacci and Support levels which presents us with a potential Non-Leverage hold opportunity.
Entry: CMP 292
Stop Loss: 90 or 0 (depends on trading style as Non-Leverage Buy & Hold is recommended)
Potential Range for Targets: 470 - 550

Bullish bounce off pullback support?USTEC has reacted off the pivot which has been identified as a pullback support and could rise to the 1st resistance which is an overlap resistance.
Pivot: 19,189.77
1st Support: 18,580.75
1st Resistance: 20,258.77
Risk Warning:
Trading Forex and CFDs carries a high level of risk to your capital and you should only trade with money you can afford to lose. Trading Forex and CFDs may not be suitable for all investors, so please ensure that you fully understand the risks involved and seek independent advice if necessary.
Disclaimer:
The above opinions given constitute general market commentary, and do not constitute the opinion or advice of IC Markets or any form of personal or investment advice.
Any opinions, news, research, analyses, prices, other information, or links to third-party sites contained on this website are provided on an "as-is" basis, are intended only to be informative, is not an advice nor a recommendation, nor research, or a record of our trading prices, or an offer of, or solicitation for a transaction in any financial instrument and thus should not be treated as such. The information provided does not involve any specific investment objectives, financial situation and needs of any specific person who may receive it. Please be aware, that past performance is not a reliable indicator of future performance and/or results. Past Performance or Forward-looking scenarios based upon the reasonable beliefs of the third-party provider are not a guarantee of future performance. Actual results may differ materially from those anticipated in forward-looking or past performance statements. IC Markets makes no representation or warranty and assumes no liability as to the accuracy or completeness of the information provided, nor any loss arising from any investment based on a recommendation, forecast or any information supplied by any third-party.

Nasdaq market analysis: 28-APRIL-2025Good morning. Welcome to today's Nasdaq market analysis and educational insights for price action traders.

NSDQ100 INTRADAY trend change supported at 18950 Key Support and Resistance Levels
Resistance Level 1: 19590
Resistance Level 2: 20070
Resistance Level 3: 20344
Support Level 1: 18460
Support Level 2: 17820
Support Level 3: 17330
This communication is for informational purposes only and should not be viewed as any form of recommendation as to a particular course of action or as investment advice. It is not intended as an offer or solicitation for the purchase or sale of any financial instrument or as an official confirmation of any transaction. Opinions, estimates and assumptions expressed herein are made as of the date of this communication and are subject to change without notice. This communication has been prepared based upon information, including market prices, data and other information, believed to be reliable; however, Trade Nation does not warrant its completeness or accuracy. All market prices and market data contained in or attached to this communication are indicative and subject to change without notice.
Potential bullish rise?USTEC has reacted off the pivot and could rise to the overlap resistance.
Pivot: 18,950.55
1st Support: 18,467.08
1st Resistance: 20,258.77
1st Resistance: 34.50
Risk Warning:
Trading Forex and CFDs carries a high level of risk to your capital and you should only trade with money you can afford to lose. Trading Forex and CFDs may not be suitable for all investors, so please ensure that you fully understand the risks involved and seek independent advice if necessary.
Disclaimer:
The above opinions given constitute general market commentary, and do not constitute the opinion or advice of IC Markets or any form of personal or investment advice.
Any opinions, news, research, analyses, prices, other information, or links to third-party sites contained on this website are provided on an "as-is" basis, are intended only to be informative, is not an advice nor a recommendation, nor research, or a record of our trading prices, or an offer of, or solicitation for a transaction in any financial instrument and thus should not be treated as such. The information provided does not involve any specific investment objectives, financial situation and needs of any specific person who may receive it. Please be aware, that past performance is not a reliable indicator of future performance and/or results. Past Performance or Forward-looking scenarios based upon the reasonable beliefs of the third-party provider are not a guarantee of future performance. Actual results may differ materially from those anticipated in forward-looking or past performance statements. IC Markets makes no representation or warranty and assumes no liability as to the accuracy or completeness of the information provided, nor any loss arising from any investment based on a recommendation, forecast or any information supplied by any third-party.

NSDQ100 INTRADAY resistance retest U.S. futures rose and the dollar strengthened after Donald Trump eased concerns that had been weighing on markets. He stated he has no plans to fire Fed Chair Jerome Powell, despite ongoing frustrations over interest rates. While this helped calm nerves, Bloomberg's John Authers cautions against viewing it as a major shift in sentiment.
Trump also struck a more conciliatory tone on China, saying he intends to be “very nice” in trade talks and suggested tariffs could be lowered if a deal is reached—indicating a possible softening of his approach toward Beijing.
Key Support and Resistance Levels
Resistance Level 1: 19195
Resistance Level 2: 19600
Resistance Level 3: 20080
Support Level 1: 17820
Support Level 2: 17330
Support Level 3: 16700
This communication is for informational purposes only and should not be viewed as any form of recommendation as to a particular course of action or as investment advice. It is not intended as an offer or solicitation for the purchase or sale of any financial instrument or as an official confirmation of any transaction. Opinions, estimates and assumptions expressed herein are made as of the date of this communication and are subject to change without notice. This communication has been prepared based upon information, including market prices, data and other information, believed to be reliable; however, Trade Nation does not warrant its completeness or accuracy. All market prices and market data contained in or attached to this communication are indicative and subject to change without notice.

Bearish drop off 50% Fibonacci resistance?USTEC is rising towards the pivot and could reverse to the pullback support.
Pivot: 18,606.32
1st Support: 17,788.70
1st Resistance: 18,942.56
Risk Warning:
Trading Forex and CFDs carries a high level of risk to your capital and you should only trade with money you can afford to lose. Trading Forex and CFDs may not be suitable for all investors, so please ensure that you fully understand the risks involved and seek independent advice if necessary.
Disclaimer:
The above opinions given constitute general market commentary, and do not constitute the opinion or advice of IC Markets or any form of personal or investment advice.
Any opinions, news, research, analyses, prices, other information, or links to third-party sites contained on this website are provided on an "as-is" basis, are intended only to be informative, is not an advice nor a recommendation, nor research, or a record of our trading prices, or an offer of, or solicitation for a transaction in any financial instrument and thus should not be treated as such. The information provided does not involve any specific investment objectives, financial situation and needs of any specific person who may receive it. Please be aware, that past performance is not a reliable indicator of future performance and/or results. Past Performance or Forward-looking scenarios based upon the reasonable beliefs of the third-party provider are not a guarantee of future performance. Actual results may differ materially from those anticipated in forward-looking or past performance statements. IC Markets makes no representation or warranty and assumes no liability as to the accuracy or completeness of the information provided, nor any loss arising from any investment based on a recommendation, forecast or any information supplied by any third-party.

Nasdaq analysis: 17-APRIL-2025Good morning, traders! Today's Nasdaq analysis will help you achieve your trading goals. Let's work together towards success.

NSDQ100 INTRADAY resistance retest Tech stocks tumbled after the U.S. announced new restrictions on Nvidia chip exports to China and ASML posted weaker-than-expected results, sparking renewed trade war fears. The selloff wiped out $155 billion in market value between the two companies.
Meanwhile, China is holding off on trade talks, wanting the U.S. to take certain steps first—like toning down harsh rhetoric from officials—according to a source familiar with Beijing’s stance.
U.S. stock futures trimmed losses after that China news but still point to a lower open due to the tech slump. The dollar slid to a six-month low, while investors moved into safe havens, gold hit a record high and the Swiss franc gained.
Key Support and Resistance Levels
Resistance Level 1: 19200
Resistance Level 2: 19550
Resistance Level 3: 19870
Support Level 1: 17250
Support Level 2: 16773
Support Level 3: 16300
This communication is for informational purposes only and should not be viewed as any form of recommendation as to a particular course of action or as investment advice. It is not intended as an offer or solicitation for the purchase or sale of any financial instrument or as an official confirmation of any transaction. Opinions, estimates and assumptions expressed herein are made as of the date of this communication and are subject to change without notice. This communication has been prepared based upon information, including market prices, data and other information, believed to be reliable; however, Trade Nation does not warrant its completeness or accuracy. All market prices and market data contained in or attached to this communication are indicative and subject to change without notice.

Nasdaq insights: 16-APRIL-2025Good morning, traders! As a seasoned price action trader, I'll share my Nasdaq insights to help you improve your trading skills.

Nasdaq analysis: 15-APRIL-2025Good morning, trading community! Today's Nasdaq analysis is for you. Share your thoughts, ask questions, and let me help you grow.

Nasdaq 100 Opens with Bullish GapTrump Exempts Electronics from Tariffs; Nasdaq 100 Opens with Bullish Gap
Despite the weekend, the news flow remained intense amid the escalating trade war. According to media reports:
→ Certain tech products, including those made by Apple, have been exempted from Trump’s tariffs.
→ Trump announced he would make a significant statement regarding semiconductor tariffs on Monday, 14 April.
Stock Indices React to Trump’s Tariff Moves
These announcements were taken positively by the markets. As shown on the chart of the Nasdaq 100 index (US Tech 100 mini on FXOpen), the new week opened with a bullish gap exceeding 1.5% – a stronger performance than the S&P 500 (US SPX 500 mini on FXOpen), which also saw a bullish gap.
This may suggest that market participants are cautiously optimistic that the sweeping tariff measures might be eased through exemptions, delays, or negotiation concessions. Nevertheless, the CNN Business Fear & Greed Index remains in "extreme fear" territory, despite inching higher compared to last week.
As of this morning, the Nasdaq 100 (US Tech 100 mini on FXOpen) has recovered approximately 15% from its 2025 low.
Technical Analysis: Nasdaq 100 (US Tech 100 mini on FXOpen)
Seven days ago, we plotted an ascending blue channel and suggested that its lower boundary could act as support – which has indeed played out.
With the latest data in hand, there is reason to believe that bulls may now be aiming to push the price up toward the channel’s median line. However, as indicated by the arrows on the chart, this median appears to have shifted from acting as support to acting as resistance.
Bulls may also face headwinds from the wide bearish candle to the left, which was formed in reaction to Trump's tariff announcements. According to Smart Money Concept methodology, this area – marked by a bearish Fair Value Gap (highlighted with a rectangle) – may now serve as resistance.
This article represents the opinion of the Companies operating under the FXOpen brand only. It is not to be construed as an offer, solicitation, or recommendation with respect to products and services provided by the Companies operating under the FXOpen brand, nor is it to be considered financial advice.

Nasdaq market analysis: 14-APRIL-2025Good morning! Happy New Week! Here's your daily Nasdaq market analysis. Learn, grow, and trade wisely.

NSDQ100 China to Hike Tariffs on All US Goods – Market MixedChina to Hike Tariffs on All US Goods – Market Reaction Mixed
China announced it will raise tariffs on all US imports from 84% to 125%, effective April 12. The move follows Washington’s decision to increase levies on Chinese goods to 145% earlier this year.
However, Beijing signaled it will no longer respond to future US tariff increases, calling the back-and-forth “a joke,” suggesting a shift in tone from retaliation to dismissal.
Market Reaction:
USD: The dollar weakened further following the announcement, reflecting rising trade tensions and risk-off sentiment.
Equities: US futures turned lower as traders priced in the potential economic drag from escalating tariffs.
Gold: Continued to rise, reinforcing its role as a preferred safe-haven amid geopolitical uncertainty.
US Treasuries: Traditionally seen as a safe-haven, Treasuries underperformed, suggesting investor confidence in them may be weakening under mounting fiscal and trade concerns.
Analysis:
Markets are increasingly pricing in the fallout from an intensifying US-China trade standoff. The rise in gold and the dip in Treasuries suggest a shift in investor preference toward alternative safe-haven assets. If trade tensions continue to escalate, further downside in risk assets and USD strength reversal are possible.
Key Support and Resistance Levels
Resistance Level 1: 19000
Resistance Level 2: 19552
Resistance Level 3: 19873
Support Level 1: 17254
Support Level 2: 16773
Support Level 3: 16400
This communication is for informational purposes only and should not be viewed as any form of recommendation as to a particular course of action or as investment advice. It is not intended as an offer or solicitation for the purchase or sale of any financial instrument or as an official confirmation of any transaction. Opinions, estimates and assumptions expressed herein are made as of the date of this communication and are subject to change without notice. This communication has been prepared based upon information, including market prices, data and other information, believed to be reliable; however, Trade Nation does not warrant its completeness or accuracy. All market prices and market data contained in or attached to this communication are indicative and subject to change without notice.

Actionable Nasdaq insights: 11-APRIL-2025Rise and shine, traders! Start your day with actionable Nasdaq insights. Let's grow your skills together, one chart at a time.

NSDQ100 INTRADAY oversold bounce backDonald Trump’s new reciprocal tariffs are now in place, adding pressure to the global economy as he aims to reshape international trade. Unlike past moves, China hasn’t responded immediately, marking a shift from its usual quick retaliation.
European and Japanese stocks fell on rising trade tensions, while U.S. futures remain steady ahead of the open. According to Goldman Sachs’s John Flood, the S&P 500 has dropped to a level where long-term investors are beginning to step in.
Key Support and Resistance Levels
Resistance Level 1: 18130
Resistance Level 2: 18520
Resistance Level 3: 19000
Support Level 1: 16387
Support Level 2: 16000
Support Level 3: 15490
This communication is for informational purposes only and should not be viewed as any form of recommendation as to a particular course of action or as investment advice. It is not intended as an offer or solicitation for the purchase or sale of any financial instrument or as an official confirmation of any transaction. Opinions, estimates and assumptions expressed herein are made as of the date of this communication and are subject to change without notice. This communication has been prepared based upon information, including market prices, data and other information, believed to be reliable; however, Trade Nation does not warrant its completeness or accuracy. All market prices and market data contained in or attached to this communication are indicative and subject to change without notice.
Russell 2000 INTRADAY oversold bounce back
Key Support and Resistance Levels
Resistance Level 1: 1889
Resistance Level 2: 1920
Resistance Level 3: 2000
Support Level 1: 1700
Support Level 2: 1640
Support Level 3: 1590
This communication is for informational purposes only and should not be viewed as any form of recommendation as to a particular course of action or as investment advice. It is not intended as an offer or solicitation for the purchase or sale of any financial instrument or as an official confirmation of any transaction. Opinions, estimates and assumptions expressed herein are made as of the date of this communication and are subject to change without notice. This communication has been prepared based upon information, including market prices, data and other information, believed to be reliable; however, Trade Nation does not warrant its completeness or accuracy. All market prices and market data contained in or attached to this communication are indicative and subject to change without notice.

Nasdaq market analysis: 09-APRIL-2025Good morning, traders! Welcome to today's Nasdaq market analysis. Compare my price action insights with your own charts and enhance your trading skills.

Nasdaq trading insights: 08-APRIL-2025Nasdaq trading insights: Not signals, but informative zones to aid your decision-making. Please note: These zones are not trading advice. Use them as a starting point for your own analysis.

Market Review: Full Higher Time Frame Review of NASDAQ bear runI hope this get's featured 🎯
The simplest macroeconomic review of NASDAQ you may see this year.
It's all a fib retracement. That's all I have to say for now 🔪 Share this with someone looking for a good review 💰
**Video was cut short by a minute or two but the general idea was complete

NSDQ100 INTRADAY key trading levels ahead of US NFPKey Support and Resistance Levels
Resistance Level 1: 18435
Resistance Level 2: 18800
Resistance Level 3: 19580
Support Level 1: 17680
Support Level 2: 17300
Support Level 3: 17000
This communication is for informational purposes only and should not be viewed as any form of recommendation as to a particular course of action or as investment advice. It is not intended as an offer or solicitation for the purchase or sale of any financial instrument or as an official confirmation of any transaction. Opinions, estimates and assumptions expressed herein are made as of the date of this communication and are subject to change without notice. This communication has been prepared based upon information, including market prices, data and other information, believed to be reliable; however, Trade Nation does not warrant its completeness or accuracy. All market prices and market data contained in or attached to this communication are indicative and subject to change without notice.
