XRPUSD Long PositionEntry: 2.21337
Stop Loss: 1.28211
Take Profit 1: 3.40000
Take Profit 2: 5.00000
Take Profit 3: 7.50000
Value

Long SBIN - Trading exactly at Rev/share = 1.As per the Revenue Grid indicator, SBI is trading exactly at it's Revenue per share value. That means current price of 1 share is same as that of the revenue it is generating per share. Historically it has traded around this valuation. But given the steady growth of SBI over the years, This is a good price to buy for long term. Happy Trading :)

Long ICICI BankSince August 2021, ICICI Bank stock has been trading nicely between Revenue/share multiple of 3, 3.5 and 4. That means it is trading at 3 to 3.5 times it's revenue per share. It is clearly visible using Revenue Grid Indicator applied on daily chart. As per that, this is a good time to buy for a long term view. We can wait for 21 Apr 2025 for it's next earnings results also :) Happy Trading :)

The Hershey Company (NYSE:HSY) - Undervalued nowThe Hershey Company is an American multinational confectionery company, founded by Milton S. Hershey in 1894. The company initially focused on caramel and chocolate, eventually expanding into a wide range of confectionery products.
The company’s headquarters are located in Hershey, Pennsylvania, which is also home to Hersheypark and Hershey’s Chocolate World. ,
Business Model, Products, and Services
The Hershey Company is a leading confectionery manufacturer and marketer. Their core business revolves around producing and selling chocolate, sweets, mints, and other snacks.
Their key product lines include Hershey’s chocolate bars, Reese’s peanut butter cups, Kit Kat, Jolly Rancher, and Ice Breakers.
The company’s business model is centered on brand recognition, product quality, and extensive distribution networks.
Durable Competitive Advantage
Hershey possesses a strong durable competitive advantage primarily due to its iconic brand portfolio. Brands like Hershey’s and Reese’s have decades of consumer loyalty and strong brand recognition.
This aligns with the “unique product” business model, as these brands hold a distinctive place in the confectionery market.
Economic Moat
Hershey’s “economic moat” is built upon its powerful brand identity. The company’s brands have a long-standing history and strong emotional connection with consumers, creating a barrier to entry for competitors. Their distribution network also provides an economic moat.
Industry Outlook, Challenges, and Competitors
The confectionery industry is generally stable, but it faces challenges related to changing consumer preferences (e.g., healthier snacks), rising ingredient costs, and intense competition.
The company’s key competitors include Mondelez International (MDLZ), Kraft Heinz (KHC), Kellogg (K), and Campbell Soup Company (CPB). Additionally, increased competition from smaller, more innovative brands is also contributing to Hershey’s market share decline.
Health trends are a large challenge, sweet snacks have been under pressure as more consumers become aware of their calorie and sugar intake.
Supply chain risks are also a consistent threat for The Hershey Company, as disruptions in the procurement of key raw materials like cocoa, sugar, and dairy could impact production costs and margins. Additionally, geopolitical instability, trade restrictions, and transportation bottlenecks may further challenge the company’s ability to maintain steady inventory levels and meet consumer demand.
Comparative Analysis
The following is a comparative analysis of the company’s financial position and performance. The analysis evaluates eight key financial ratios to determine whether the company possesses a durable competitive advantage. The company’s financial ratios are compared with the median ratios of its main competitors.
Gross Margin %
Hershey maintains a consistent gross profit margin of 42%, which is significantly higher than the competitor average of 33.62%.
A high gross profit margin stems from the company’s durable competitive advantage, allowing it to price its products significantly higher than its competitors while maintaining strong profitability.
R&D to Revenue Ratio %
Hershey’s R&D expenditure is relatively low at 0.5% compared to its competitors’ 0.9%. This suggests that its competitive advantage relies more on brand strength and distribution than on product innovation.
Depreciation to Gross Profit Ratio %
Hershey’s depreciation-to-gross-profit ratio is a reasonable 9.48%, slightly lower than its competitors’ 9.65%, suggesting efficient asset utilization.
Interest Expense to Operating Income Ratio %
Hershey’s Interest Expense to Operating Income Ratio is 7.4%, significantly lower than its competitors’ 16.3%, indicating a strong financial position.
Operating Margin %
Hershey’s operating margin is strong, consistently above 20%. This suggests efficient operations and pricing power.
Free Cash Flow Margin %
Hershey’s free cash flow margin fluctuates, but it consistently remains higher than that of its competitors. This is a strong indicator that Hershey has a durable competitive advantage.
Basic Earnings Per Share (EPS)
Hershey’s EPS shows a generally upward trend, indicating consistent profitability.
Return on Equity (ROE)
Hershey’s ROE is strong and significantly higher than that of its competitors, indicating efficient utilization of shareholder equity.
Based on the analysis of key financial ratios, we have determined the following: The Hershey Company’s financial condition is stronger than that of its competitors. We believe the company holds a competitive advantage within its industry.
Intrinsic Value Valuation
Intrinsic Value: $236.80
Current Price: $171.16
Margin of Safety: 27.72%
Based on the provided data, Hershey’s stock appears to be undervalued, with a significant margin of safety.
The company’s strong brand portfolio, consistent profitability, and efficient operations are positive indicators.
The 27.72% margin of safety provides a good buffer against potential market fluctuations or valuation errors.
Recommendation: Given the current undervaluation and the company’s strong fundamentals, a “buy” recommendation is warranted. However, investors should carefully monitor industry trends, competitive pressures, and potential risks related to changing consumer preferences and ingredient costs.

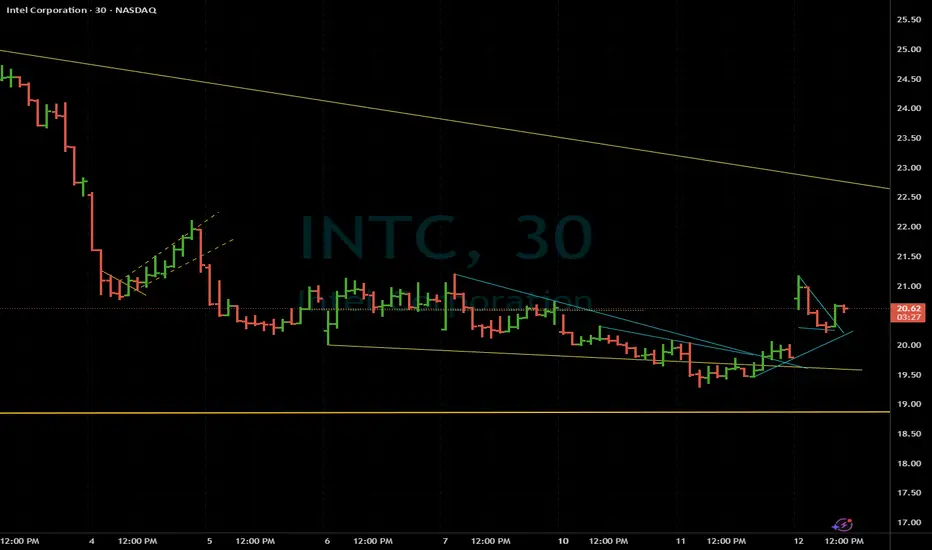
INTC | If Keeps This up it will get Past it's Technical IssuesINTC makes CNBC news as top mover today 3-12-25, it needs the attention, why... if Intel keeps this up it will get past it's technical issues which I think it will; buyout rumors are very real and possible and it's getting the attention it DOES deserve, I think it surprises the market with moves higher. Apple or Samsung could use all the patents and history on this mega-company, at this price I feel it's a steal absolutely. Someone must be eying taking it out outright IMO.
Strong technicals are forming right here and now.
I don't think US markets have bottomed outThe US stock markets are down.
I don't think they've bottomed out - there could be further downside to come - but this could be a fantastic opportunity for longer-term traders and investors. Buying the dip is often profitable for buy-and-hold investors.
As a trader, I'm still actively looking for index shorting opportunities.

Understanding Trump and future of US and BTCUnderstanding Trump
As investors, we constantly analyze news and charts to find opportunities to make money. But today, I want to take a step back and look at the bigger picture.
This is a story about Donald Trump. Predicting his future actions could be key to making profits in various markets. Lately, Trump may seem like a madman—Hunting down on illegal immigrants, imposing tariffs on countries, trying to befriend Russia, and being outright rude to other alliences. He even once demanded that Greenland be put up for sale.
Over the next few chapters, I’ll explain my idea about why Trump does what he does. You will realize he’s not as crazy as he seems. Hopefully, this will help us gain some foresight into the future and, in turn, make profitable investments.
Chapter 1 : The U.S. A Frog in a Boiling Pot
From Trump’s perspective, America today is like a frog sitting in a pot of water that’s about to boil. Not just lukewarm, but dangerously close to reaching a boiling point. Like a setting sun, the U.S. is slowly losing its position as the world's dominant superpower and is, in his eyes, on the verge of decline.
What we are feeling about US is more like this.
On the surface, it looks like things are going well.
Ordinary Americans seem to be doing fine, the stock market keeps hitting new highs, employment numbers are strong, and the U.S. military remains the most powerful in the world. There are no obvious signs that America is losing its status as the world’s leading power.
But Trump sees things differently.
In his view, if the U.S. continues on its current path, it will eventually lose its dominance to China and decline into a second-tier nation, much like Britain or Spain.
Why does he think that?
This perspective is likely influenced by books like Ray Dalio’s The Changing World Order and Paul Kennedy’s The Rise and Fall of the Great Powers.
These books analyze how once-great powers—such as Britain, the Roman Empire, and Spain—declined over time. They outline three key reasons why major powers historically collapse:
1 Excessive debt – Poor government management and uncontrolled money printing lead to inflation.
2 Overextension through war or expansion – Excessive military spending due to prolonged wars or imperial overreach.
3 Extreme wealth inequality and social conflict – Rising tensions and divisions among the population.
And I would add one more factor to this list.
4 Failure to adapt to new economic, social, and technological trends -
Trump believes that these factors are causing the U.S. to lose its status as the world's leading power.
In a few decades, he sees America becoming like Britain—reminiscing about its past glory—or like Russia—resource-rich but lacking real global influence.
So, will the U.S. really decline?
"The water in the pot is already getting hot. No one knows exactly when it will start boiling, but if these four factors continue fueling the fire, eventually, it will."

Applied Materials (AMAT) Stock Analysis ReportApplied Materials, Inc. (NASDAQ: AMAT) is a global leader in materials engineering solutions for semiconductor manufacturing. The company provides equipment, software, and services to help produce advanced chips used in various high-tech applications, including AI, 5G, and automotive industries. As a key player in the semiconductor equipment sector, AMAT competes with companies like ASML (ASML), KLA Corporation (KLAC), Lam Research (LRCX), Teradyne (TER), and Tokyo Electron.
Financial Performance Analysis
Profitability Metrics
Gross Margin:
47.46% (AMAT) vs. KLAC (61.19%), ASML (49.82%), Teradyne (54.83%)
Operating Margin:
28.95% (AMAT) vs. ASML (31.92%), KLAC (39.03%), Teradyne (19.46%)
AMAT maintains a strong gross margin but lags behind KLAC and ASML. However, its operating margin of 28.95% demonstrates effective cost control and efficient operations.
Return on Equity & Capital Efficiency
Return on Equity (ROE):
40.61% (AMAT) vs. KLAC (87.85%), ASML (48.19%), Teradyne (20.29%)
Cash-to-Debt Ratio: 1.43
While AMAT’s ROE is strong, KLAC significantly outperforms. AMAT’s cash-to-debt ratio of 1.43 suggests a manageable debt level, ensuring financial flexibility.
R&D Investment Efficiency
R&D-to-Revenue Ratio :
11.9% (AMAT) vs. ASML (13.95%), KLAC (13.06%)
A lower R&D-to-revenue ratio indicates AMAT is able to generate high revenue with relatively lower R&D spending, signaling operational efficiency and competitive advantages in innovation management. While ASML and KLAC invest more heavily, AMAT’s ability to maintain growth with a lower R&D ratio demonstrates strong execution.
Cash Flow
Free Cash Flow Margin : 27.55%
With a free cash flow margin of 27.55%, AMAT generates solid cash, supporting dividends and buybacks.
Industry Outlook & Growth Potential
The semiconductor industry is poised for strong growth due to increasing demand for AI chips, high-performance computing, and electric vehicles. However, the U.S. government’s new tariffs on Chinese semiconductor-related imports may impact AMAT’s global sales, particularly if China retaliates.
Despite this, AMAT remains well-positioned due to:
Its strong presence in leading-edge chip manufacturing.
Expansion in AI-related semiconductor production.
High free cash flow generation, allowing for reinvestment and shareholder returns.
Risks & Challenges
Impact of U.S.-China Trade Tensions
New U.S. tariffs on semiconductor equipment could reduce AMAT’s revenue from Chinese customers. If China restricts access to key materials, AMAT may face supply chain disruptions.
Competitive Pressure
ASML dominates the lithography equipment market, while KLAC and Lam Research lead in process diagnostics and wafer fabrication. AMAT must continue innovating to defend its market position.
Semiconductor Industry Cyclicality
Downturns in semiconductor demand could hurt AMAT’s revenue, as seen in previous industry cycles.
Investment Outlook & Valuation
Current Price: $155.68
Intrinsic Value: $207.38 (Safety Margin 24.93%)
Earnings Yield: 4.91%
Dividend Yield: 0.81%
AMAT’s intrinsic value suggests the stock is undervalued by 24.93%, making it an attractive long-term investment.
Bullish Case
Strong profitability and efficiency despite lower R&D spending.
High cash flow generation supporting shareholder returns.
Undervalued stock with strong upside potential.
Bearish Case
U.S. tariffs could impact sales in China.
Competition from ASML, KLAC, and Lam Research remains intense.
Semiconductor demand cycles may cause short-term volatility.
Final Verdict: Buy, Hold, or Sell?
Given AMAT’s undervaluation, strong margins, and efficient R&D spending, the stock presents a Buy opportunity for long-term investors. However, geopolitical risks should be monitored closely.
Investment Strategy:
Accumulate AMAT on dips, targeting a price range of $190-$210 over the next 12-18 months.

AVGO - Can we bounce off of good earnigns?AVGO A Powerhouse Investment Opportunity
Broadcom Inc. has emerged as a standout in the tech industry, demonstrating remarkable resilience and growth potential that makes it a compelling pick for investors. Here are some key highlights that underscore its appeal:
Robust Financial Performance: Broadcom consistently delivers impressive revenue growth and profitability. Its solid balance sheet, high margins, and strategic capital allocation provide investors with confidence in its long-term financial health.
Diverse and Innovative Product Portfolio: With strong positions in semiconductors, enterprise software, and infrastructure solutions, Broadcom benefits from multiple revenue streams. This diversification reduces risk while positioning the company to capitalize on various market trends.
Strategic Acquisitions and Partnerships: Broadcom has a proven track record of making smart acquisitions and forging strategic partnerships. These moves not only expand its technological capabilities but also open up new market opportunities.
Leadership in a High-Demand Industry: As the global demand for high-speed connectivity, cloud computing, and next-generation technologies continues to surge, Broadcom is well-positioned to meet these needs with its cutting-edge solutions.
Investor Confidence: The company’s consistent performance, coupled with its forward-looking strategy, has earned the trust of both institutional and retail investors. Its commitment to innovation and efficiency makes it a stock to watch for long-term growth.
Overall, Broadcom stands out as a reliable and dynamic investment, poised to thrive in the evolving tech landscape. For investors looking to add a resilient, high-performing asset to their portfolio, Broadcom stock is certainly a top contender.
Entry: 191
Target 1 - 219
Target 2 - 244
SL Just below the gap which will serve as our insurance : 176

DOCU is going to $30 because the moat is lost to AI toolsDOCU
Has already lost the moat, by ai tools/
Open source versions are out that function just like Docu.
This company is over valued because they have been
replicated for $20 tool by a senior dev.
See you at $30

JD.COM - we had amazing earnings, waiting for the yearly report!JD.com is scheduled to release its fourth-quarter and full-year 2024 financial results on March 6, 2025.Analysts are optimistic about the company's performance, with several key indicators pointing toward positive growth:
Earnings Projections:
Earnings Per Share (EPS): The consensus estimate for the upcoming quarter is $0.85, reflecting an increase from last year's $0.73 for the same period.
Revenue Growth: Projections indicate a year-over-year revenue growth of approximately 6.61%, with expected revenues rising from $43.11 billion to $45.96 billion.
Analyst Ratings:
Strong Buy Recommendation: Based on evaluations from nine analysts, JD.com has received a consensus rating of "Strong Buy," underscoring confidence in the company's growth trajectory.
Future Outlook:
Earnings Growth: Forecasts suggest JD.com's earnings will grow by 13% per annum, with an anticipated EPS growth rate of 12.8% annually.
Revenue Projections: The company's revenue is expected to increase by 5.6% per year, indicating sustained business expansion.
These positive indicators reflect JD.com's robust market position and its potential for continued growth in the upcoming earnings release.
Entry: 42.00
Target 70.00

Advanced Micro Devices, Inc. - Short - long failed upward candleAs of 10 April 2024, AMD PE ratio is at 334. It had a long failed upward candle on 8 March 2024.
Downside till 95 dollars.

Where Did Altcoin Season Go?Ah, Altcoin Season —that magical time when every random token is supposed to skyrocket, turning you from an average investor into a crypto mogul overnight. At least, that’s what the hype says.
Yet, despite endless Twitter (sorry, X) posts and YouTube thumbnails screaming, "It's coming! Any day now!", it still hasn't arrived.
So, let’s cut through the noise and ask the real question: Why didn’t Altcoin Season happen?
________________________________________
1. Everyone Was Expecting It—But Someone Was Selling
There’s an unwritten rule in financial markets: When everyone expects something to happen, it probably won’t.
Every self-proclaimed crypto guru has been yelling: "Altseason is here! 100x! To the moon!"
Meanwhile, someone was selling.
Instead of an explosive rally, we got some pumps followed by brutal sell-offs. Why? Because while retail traders were waiting for liftoff, big players were cashing out quietly. Someone always has to be the exit liquidity.
________________________________________
2. The Market Is Not the Same as 5 Years Ago
Just because Altcoin Season happened in 2017 or 2020 doesn't mean it will play out the same way again.
The crypto market has changed dramatically:
• No more reckless retail FOMO throwing money at anything with a flashy logo.
• Institutions have entered the space—but they don’t care about low-cap moonshots.
• Liquidity is more concentrated—Bitcoin and a handful of top coins dominate the inflows.
Altcoin Season thrived when everyday investors piled into random projects without thinking. But after multiple crashes and rug pulls, that blind optimism has vanished.
________________________________________
3. Projects Make Promises, But Don’t Deliver (Shocking, Right?)
Let’s be honest: Who makes the most money in crypto projects? Right—the developers.
Every market cycle, we get new buzzwords: DeFi revolutions, AI-blockchain fusion, metaverse takeovers… but what actually happens?
• Fancy whitepapers, vague roadmaps—but great marketing.
• Tokenomics built to enrich insiders, not retail investors.
• Initial hype, then a slow decline—until the next trendy project appears.
At this point, we all know only a tiny fraction of altcoins provide real innovation. Without real progress, there’s no fuel for a true Altcoin Season.
________________________________________
So… Is Altcoin Season Dead?
Not necessarily. But it’s no longer a guaranteed, predictable event. The expectations have changed.
• Without new retail money flooding in, who’s pumping these coins?
• With Bitcoin dominance high, who’s paying attention to altcoins?
• If most new projects exist to enrich devs, why would an altseason even happen?
Instead of waiting for a mythical altcoin boom, maybe the smarter move is to ask yourself:
Am I investing in a solid project, or am I just hoping to be "the lucky one" who catches the next 100x?
Either way, good luck with your HODLing—and with those "If I had just invested $100 at that price..." screenshots.

Gold Oversold - Bullish BiasAlthough macro-economic indicators are not confirming a sudden increment in gold value... But it's at a major support line that it shall increase the gold price for short-term accumulations today.
---
About me: Gerald Mann is an specialist in financial operations, and served as policy adviser to Barack Obama.

Since DOGE is pretty hot at the moment... It's also pretty in the middle of a longer range of price action range with no real reward and a lot of risk to be found at this price point.
You can look at it technical, you can say it's due to politics (like that has always been a solid in the past...), you can blame it on the fomo and the news...
You always have a choice when to act and what to do when you act. Just be smart about it ;-)
Cheers!

Lamb Weston Holdings | LW | Long at $51.32Lamb Weston Holdings NYSE:LW , the potato / French fry king, has gone through a tremendous downturn since 2023. Yet, earnings are forecast to grow 22% per year into 2027. Debt is quite high at 2.5x and this company, like many others, will significantly benefit from lower interest rates in the future. If the US experiences another way of inflation, Lamb Weston Holdings could be on the beneficiary side of things.
From a technical analysis perspective, the price has entered my "crash" simple moving average zone. Typically, this area signals a bottom, but it's not guaranteed. I foresee the daily price gap near $50 being closed in the short-term before a true move up. A dip to $47-$48 is not out of the question. Regardless of trying to predict bottoms, at $51.32, NYSE:LW is in a personal buy zone.
Targets:
$62.00
$68.00
$77.00

HAL NV: Unlocking Hidden Value in a Discounted InvestmentCurrent Price: Approximately €117.40 per share
Target Price: €150 per share
HAL NV (traded via HAL Trust) has long been recognized as a unique investment vehicle, thanks to its diversified portfolio of high-quality assets. Despite a current trading level around €117.40, a closer look at the underlying holdings and operational performance reveals a significant value gap—one that suggests the stock should be priced nearer to €150.
Key Holdings and Their Strengths
Boskalis – A Fully Owned Flagship
• 100% Ownership: HAL NV owns Boskalis outright, giving it full exposure to the maritime and offshore construction market.
• Robust Order Books: Boskalis benefits from a full order book, which not only secures future revenues but also demonstrates strong market positioning.
• Operational Efficiency: With steady execution in its core business, Boskalis adds both resilience and growth potential to HAL’s overall portfolio.
SBM Offshore – Secure Order Pipeline
• Substantial Stake (22.9%): While not fully owned, SBM Offshore represents a key component in HAL’s strategy.
• Solid Order Books: Like Boskalis, SBM Offshore’s strong order backlog underscores its ability to generate future cash flow.
• Strategic Exposure: The offshore energy market, driven by both traditional and renewable energy projects, positions SBM Offshore for long-term growth.
Vopak – Consistent Performer with Upward Trends
• Major Stake (51.4%): HAL’s significant interest in Vopak captures exposure to the global tank storage and logistics sector.
• Earnings Fluctuation, But Upward Trend: Although Vopak’s earnings can fluctuate year over year, the overall trend has been strongly positive, reinforcing its role as a reliable income generator.
Additional Growth Catalysts
• Coolblue (56.4%) & TKH Group (5.2%): These holdings further diversify HAL’s portfolio, offering exposure to high-growth sectors such as retail technology and industrial services.
The Valuation Gap: NAV vs. Market Price
One of the most compelling aspects of HAL NV is the notable discrepancy between its Net Asset Value (NAV) and its market capitalization:
NAV Insight: Recent reports and annual filings suggest that the NAV per share of HAL’s underlying assets is approximately €165.95.
Market Discount: Trading at around €117.40, HAL NV is effectively offered at a significant discount. This “hidden value” implies that the market has yet to fully recognize the aggregate worth of its high-quality investments.
Equity vs. Market Cap: With the equity value of its portfolio (including fully consolidated companies like Boskalis and the robust valuations from quoted holdings such as Vopak and SBM Offshore) substantially higher than the current market cap, the potential for upward re-rating is evident.
Hal NV is poised for robust long‐term growth, with annual rates expected to reach around 15%. This optimism is driven by strong demand for the services of Boskalis and SBM Offshore, both of which continue to benefit from substantial order books. Additionally, the accelerated growth of Coolblue and the steady, consistent performance of Vopak—bolstered by emerging opportunities in India—further enhance the outlook. Coupled with a conservative balance sheet that ensures a low cost of capital, these factors collectively support the company’s promising growth trajectory.
Catalysts for Price Convergence
Several factors support the rationale for a price target of €150:
Strong Order Books: Both Boskalis and SBM Offshore are backed by extensive order books, which not only secure future revenue streams but also reduce operational risks.
Consistent Growth Trends: Vopak, despite some earnings volatility, has demonstrated a significant long-term upward trend in earnings—enhancing the overall stability of HAL’s portfolio.
Undervalued Underlying Assets: The current market price does not fully reflect the NAV derived from HAL’s diverse investments. As market sentiment improves and the intrinsic value becomes more widely recognized, a re-rating toward the NAV is likely.
Favorable Valuation Metrics: HAL NV’s relatively low Price/Earnings ratio compared to its growth prospects and asset quality makes it an attractive buy for value-oriented investors.
Conclusion
HAL NV represents an intriguing investment opportunity—a trust whose market price currently undervalues a robust portfolio of operationally strong and strategically significant companies. With full control over Boskalis and solid stakes in SBM Offshore and Vopak, combined with additional growth prospects from Coolblue and TKH Group, the underlying equity far exceeds the current market valuation. In essence, if the market were to recognize the full value of these assets, a price target of €150 per share appears not only justified but highly attainable.
Investors looking for a value play in the industrial and investment holding space should keep a close eye on HAL NV, as the convergence of market price to NAV could deliver significant upside potential.
Note: The analysis above is based on current market data (price ≈ €117.40) and recent annual reports, and reflects the author’s view on the intrinsic value of HAL NV. Investors should perform their own due diligence before making any investment decisions.

BTC | NEWS | Abu Dhabi Invests $436.9M in ETFAbu Dhabi's sovereign wealth fund, Mubadala Investment Company, has made a significant investment in Bitcoin by purchasing $436.9 million in shares of the iShares Bitcoin Trust (IBIT).
This MUST be a clear indicator that they are bullish on BTC, at least for the longer term.
Investment firms most commonly invest with the eye on the longer term, and are usually unphased by short term swings like daily or even weekly corrections. This is, if anything, extremely bullish for BTC in the longer term (1 year and possibly beyond).
In similar news; the potential of the SEC approving XRP ETF is causing optimism for XRP.
XRP has recently made great progress in terms of fundamentals, more on that HERE:
________________________
BINANCE:BTCUSDT

PARAMOUNT - EPS Beat 12 out of 17 Q's can we extract potential?Hi guys we are going to take a look into Paramount and see if we can extract some potential from this stock!
Fundamentals&Technicals below -
As of February 15, 2025, Paramount Global's Class B stock (ticker: PARA) is trading at $11.30 per share, reflecting a 4.5% increase from the previous close. This marks the fourth consecutive day of gains, though the stock remains 22.3% below its 52-week high of $14.54 achieved on May 3, 2024.
In the third quarter of 2024, Paramount reported net income of $1 million, a significant decline from $295 million in the same period the previous year. Earnings per share reached breakeven, missing analyst expectations of 24 cents. Total revenue decreased to $6.731 billion from $7.133 billion, influenced by a 6% drop in TV media revenue and a 34% decline in filmed entertainment revenue.Despite these challenges, the company's streaming segment showed resilience. Paramount+ added 3.5 million subscribers in the third quarter, bringing the total to 72 million. The streaming service reported an adjusted operating income of $49 million, defying analysts' predictions of a $160.1 million loss.
In 2024, Paramount undertook significant restructuring efforts, including a $6 billion write-down of its cable-TV business and the elimination of approximately 2,000 jobs, representing about 15% of its U.S. workforce. These measures aim to achieve $500 million in cost savings and address challenges in the traditional TV sector.
Looking ahead, Paramount is set to merge with Skydance Media, with the merger expected to complete in early 2025. This strategic move is anticipated to inject significant capital into Paramount, aiding in debt reduction and enabling investments in new content and technologies.
Entry: on market open
Target: 17.00 just below the weak resistance.
SL: 7.50
P.S. We are sitting on a very key support area which has been overviewd long term which is around the 9.00 and 11.00 area, so this gives us additional confidence in the stock increasing.Hopefully the positive earnings report will have another beat in EPS, and would yield great value.

Looking for Investment in Cryptos ? wait for Levels !Wait for Price or divide your Investing money into different parts.
CRYPTO:BTCUSD
Always Wait for your Levels to grab. in FOMO dive with 5% Risk on Total Capital one time. Every Red weekly candle closing price should be your Price to buy and just focus on Avg buying Price.
CRYPTO:BTCUSD Let the king come to the Level. and every level grab the foots.

Overvalued insider tradeRelative valuation appears significantly inflated compared to peers. A more justifiable valuation would be in the vicinity of 90, with a target of 95 anticipated by next month. Even considering favorable political tailwinds, the current trajectory seems unsustainable, potentially reaching 120 before retracing.

USDJPY CHART TECHNICAL ANALYSIS TARGET WIN CONFIRMED!
Your target has been officially reached!
Congratulations on a successful trade! Your analysis and strategy paid off.
Now that your target is confirmed, what's your next step? Are you closing the trade, adjusting your strategy, or setting new targets?

EUR/USD CHART TECHNICAL ANALYSIS TARGET WIN Congratulations!
Your EUR/USD chart analysis has led to a successful trade, and you've reached your target!
Well done! Your technical analysis skills and market insight have paid off.
What's your next move? Are you:
1. Closing the trade and taking profits?
2. Setting new targets for further growth?
3. Refining your strategy for the next trade?
Share your next step!
