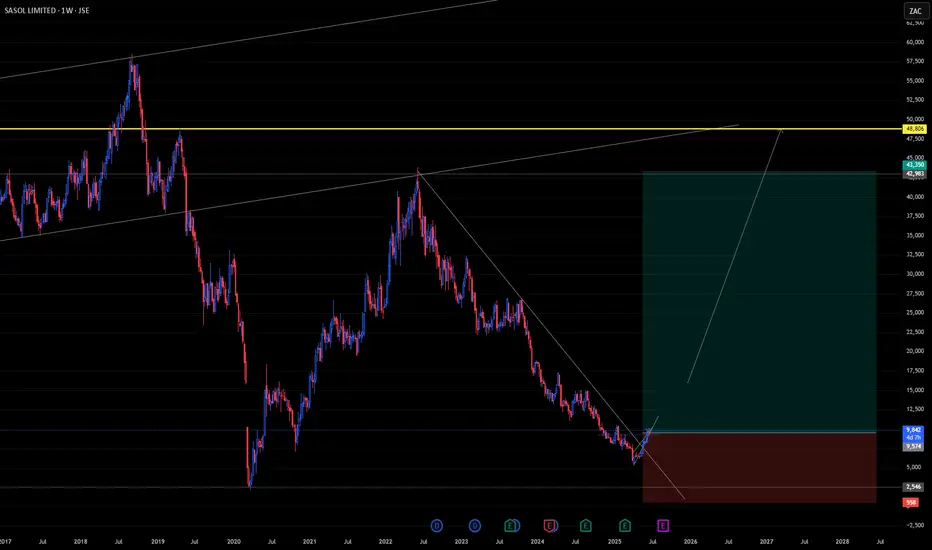
SOL Long Term Long PositionJSE:SOL credit rating has been stamped with a Ba1 by Moody's which is very unfavourable to the company, wholistically. This is as a result of its weakening operating performance mainly attributed to low demand in the chemicals market and weak oil prices.
With expectations of higher FX:USOIL prices and JSE:SOL being pretty much undervalued, trading near its supporting level of 8600 ZAC, a positive outlook is still evident. Long positions have been executed at 9574 ZAC with a possibility to further capitalize when necessary.
Cite: Sasol outlook downgraded to negative by Moody's Ratings, Ba1 rating affirmed - Luke Juricic
Value
NewtekOne | NEWT | Long at $10.92NewtekOne NASDAQ:NEWT is a financial holding company providing business and financial solutions to small- and medium-sized businesses across the U.S. Services include Newtek Bank, business lending, SBA loans, electronic payment processing, payroll and benefits, insurance, and technology solutions. While the stock has taken a major hit recently, insiders have scooped up over $1 million in shares with an average price of $11.70. Currently trading at a P/E of 5.6x, forward P/E of 6.6x, and near book value, the stock may be poised for a move up soon with the anticipation of interest rates dropping. Revenue is up 24.93% from $271.15M (2023) to $338.73M (2024) and earnings are forecast to grow 11.63% per year, but the company does have a high debt-to-equity ratio (over 5x).
Tariffs could indirectly impact NASDAQ:NEWT by increasing costs for its small- and medium-sized business clients, particularly in industries reliant on imports (e.g., manufacturing, retail). Higher costs may reduce client profitability, increasing loan default risks or reducing demand for Newtek’s lending and payment processing services. But an interest rate reversal may greatly limit the impact (longer-term).
So, at $10.92, NASDAQ:NEWT is in a personal buy zone.
Targets into 2027:
$12.00 (+9.9%)
$14.00 (+28.2%)

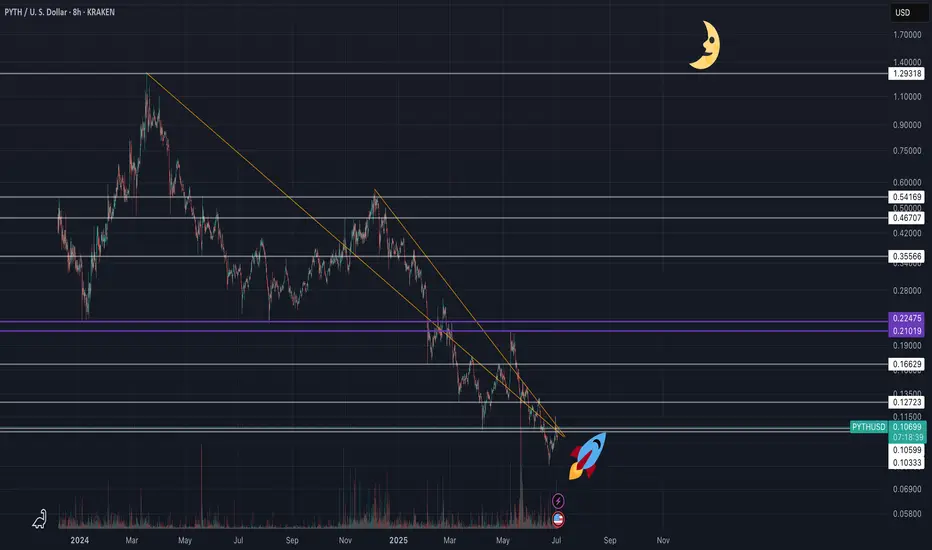
PYTH NETWORK (PYTHUSD) - (10X - 50X Potential)Pyth Network is an oracle protocol originally built for Solana, optimized for ultra-low latency and first-party data directly from exchanges and market makers. Unlike Chainlink’s node-aggregator model, Pyth enables real-time price feeds (as fast as 400ms) sourced directly from over 100 institutional providers, including Binance and Cboe.
🧩 Why Pyth?
DeFi apps need fast, accurate pricing to avoid exploits and ensure fair trading. Pyth delivers high-frequency, high-integrity data, especially valuable for derivatives, perpetuals, and high-speed DeFi protocols.
🌐 Massive Expansion
What started on Solana now powers 100+ blockchains, including Ethereum L2s, Cosmos, Sui, Aptos, TON, and more. As of 2025, over 420 protocols integrate Pyth, with over $48B+ monthly trading volume secured. It has become the #2 oracle in DeFi by usage, dominating ecosystems like Solana, Sui, and Injective.
📊 Tokenomics & Unlocks
Max supply: 10B PYTH
Circulating: ~5.75B (mid-2025)
Next major unlock: May 2026 (~2.1B tokens)
Utility: Governance, staking, publisher rewards, and oracle integrity
Pyth’s decentralized governance is growing, with a DAO now guiding key protocol parameters. It’s also expanding beyond price feeds, launching products like randomness (Entropy) and MEV mitigation tools (Express Relay).
Disclaimer: This is not financial advice. Always do your own research before making investment decisions.
XRP Army - prepare for a 72% crash to 0.6 USD! (lifetime chance)The current price of XRP is 2.19 USD, and I predict a big crash in 2025/2026 to 0.6 USD. Yes, I know you may think that that's completely impossible, especially if you are high on your XRP holdings, but I can assure you that this is going to happen! What can you do?
If you are a hodler, then you need to prepare for your portfolio to drop by 72%. Can you really handle this situation? If not, you need to take some action.
If you are a trader and you still speculate on the price increase, you can consider exiting your position. If you bought before the huge pump, take your profit now.
If you are a trader and you bought after the pump, that means at the TOP, you basically FOMOed-IN. It's time to take a small loss or exit your position at break-even. If you found yourself in one of the situations above, you have some work to do. And you need to do the work as soon as possible, before XRP starts crashing, which can be any day now. Otherwise, I strongly recommend entering a short position on futures on a strong resistance if you want to make money on XRP.
Now, importantly, why do I think XRP will crash? Technically, XRP is in a big range and has been in a range since 2017. Nothing changed at all after the pump; the price is still inside this ascending triangle. After the huge pump, the price created a big FVG (Fair Value GAP), and historically this has been a big issue for XRP because we went down each time and wiped out the GAPs. Don't forget that XRP is something like a bitch coin, it's doing weird moves, and it's always ranging and taking liquidity from traders, like a casino. Smart traders can take advantage of it and trade it, but you need to have a strategy. Right now it's obvious that XRP is going to go down in the next months!
Write a comment with your altcoin + hit the like button, and I will make an analysis for you in response. Trading is not hard if you have a good coach! This is not a trade setup, as there is no stop-loss or profit target. I share my trades privately. Thank you, and I wish you successful trades!

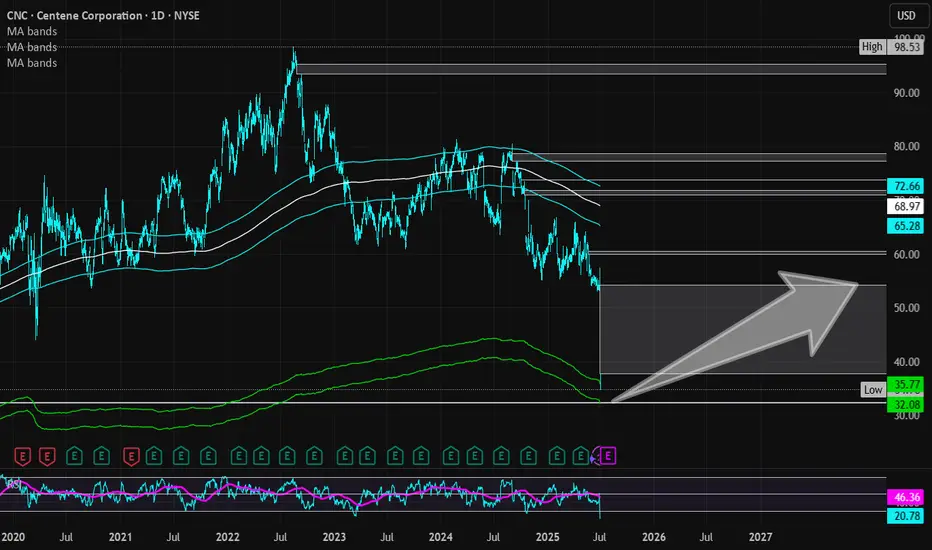
Centene Corp | CNC | Long at $35.00Centene Corp NYSE:CNC is a healthcare enterprise providing programs and services to under-insured and uninsured families, commercial organizations, and military families in the U.S. through Medicaid, Medicare, Commercial, and other segments. The stock dropped almost 40% this morning due to recent challenges, such as a $1.8B reduction in 2025 risk adjustment revenue and rising Medicaid costs (leading to withdrawal of 2025 earnings guidance). However, the company has a book value near $56, debt-to-equity of 0.7x (healthy), a current P/E of 5x, and a forward P/E of 9x.
It may be a few years before this stock recovers. But the price has entered my "crash" simple moving average area (currently between $32 and $36) and there is a price gap on the daily chart between $32 and $33 that will likely be closed before a move higher. Long-term, and potentially a new political administration, new life may enter this stock once again as the baby boom generation requires more healthcare services. But holding is not for the faint of heart...
Thus, at $35.00, NYSE:CNC is in a personal buy zone with a likely continued dip into the low $30s or high $20s before a slow move higher (where I will be accumulating more shares). Full disclosure: I am also a position holder in the $60s and cost averaging down.
Targets into 2028:
$45.00 (+28.6%)
$54.00 (+54.3%)
B&G Foods | BGS | Long at $4.45B&G Foods NYSE:BGS , owner of over 50 food brands including Green Giant, Ortega, Cream of Wheat, Mrs. Dash, and Crisco, has dropped nearly 92% in price since its high in 2021. Currently trading at $4.43 and with a book value of $6.43, NYSE:BGS may have some running room in the next 1-2 years for a forward P/E of 10x (currently negative, so there is anticipated growth, though small). This is another company that would greatly benefit from lowered interest rates due to its high debt-to-equity (4x).
So, while debt and consumer spending declines may pose a threat to NYSE:BGS , I believe it is currently undervalued. If the stock drops due to poor earnings (which could drop to under $2.00), I will be entering another position unless fundamental / outlook truly change.
Thus, at $4.45, NYSE:BGS is in a personal buy zone.
Targets into 2027:
$5.25
$6.25

How I screen for long term investmentsIn this video, I’ll show you the exact stock screener I use to find long-term investment opportunities — the kind of stocks you can buy and hold for years.
I’ll walk you through the key metrics to look for, how to use free tools like TradingView screener, and what red flags to avoid. This strategy is perfect for beginner and experienced investors who want to build long-term wealth, not chase hype.
Whether you're looking for undervalued stocks, consistent compounders, or just trying to build your long-term portfolio, this screener can help.
Hope you enjoy!!

JELD-WEN Holdings | JELD | Long at $4.02JELD-WEN Holdings NYSE:JELD designs, manufactures, and sells wood, metal, and composite materials doors, windows, and related building products in North America and Europe. The stock has taken quite a beating since the rise in interest rates, and I think a reversal *may* be in sight in the next year as rates are slowly lowered - even if the market is forward-thinking and purely anticipating a new housing boom (which I highly doubt given the current home prices). Regardless, there is risk with this stock since it has relatively high debt (debt-to-equity of 2.61x). A Quick Ratio of 1.1 and Altman's Z Score of 1.9 puts NYSE:JELD near a medium level of bankruptcy risk. The company has pretty good cash reserves and a forward P/E of 10x (current is negative), so growth is anticipated. Book value of $5.31.
A bear case here is a terrible earnings call in August 2025 due to the housing market slowing (i.e. people pausing home purchases/builds/repairs expecting interest rates to drop soon). That may plummet the stock near $1.00 or below, which would be a tremendous deal, *unless* the company fundamentals change (like bankruptcy).
Without a crystal ball, yet understanding the forward-thinking aspects of the market, NYSE:JELD is in a personal buy-zone at $4.02 with some risks.
Targets into 2027:
$5.40 (+34.3%)
$8.50 (+111.4%)

HELE | Historic Support Reclaim – Falling Wedge Breakout +113% 📍 Ticker: NASDAQ:HELE (Helen of Troy Ltd.)
📆 Timeframe: 1W (Weekly)
📉 Price: $28.10
📈 Pattern: Falling wedge + long-term horizontal support
🔍 Technical Setup:
NASDAQ:HELE is rebounding from a major horizontal support zone that's been in place since 1998, and just broke above a multi-year falling wedge. This marks the start of what could be a powerful bullish reversal.
🔻 Breakdown structure from 2022 now being tested from below
🟡 Long-term horizontal support: ~$26.00–27.00
📈 Breakout potential with plenty of headroom into prior supply zones
🧠 Trade Plan & Return on Invested Capital (ROIC):
📥 Entry Zone: $27.50–$28.50
⛔ Stop-Loss: Weekly close below $25.00 (structure invalidation)
🎯 Target 1: $47.99
→ 🔼 ROIC: +70.8%
🎯 Target 2: $60.06
→ 🔼 ROIC: +113.8%
⚠️ Key Observations:
Large-volume bottoming zone, breakout confirmed above falling trendline
Price targets align with key prior support → resistance flip zones
Multi-year trend reversal possible if price sustains above $31–32
Strong candidate for mid/long-term swing trades or LEAP call positioning
💬 Will Helen of Troy return to its former strength with a clean wedge breakout?
Add HELE to your watchlist for 2025–2026 recovery potential.
#HELE #FallingWedge #BreakoutTrade #LongTermSetup #ReversalPattern #TargetTraders

NFE | Long-Term Falling Wedge Reversal – 10X Over 39 months📍 Ticker: NASDAQ:NFE (New Fortress Energy Inc.)
📆 Timeframe: 1W (Weekly)
📉 Price: $3.34
📊 Volume: 829K
📈 Time Horizon: 39 months (~Q4 2028)
🔍 Technical Setup:
NASDAQ:NFE has formed a classic falling wedge over multiple quarters and is now attempting a long-term reversal from a compressed base. The structure suggests explosive upside potential if recovery unfolds as mapped.
🔻 Massive wedge complete
🟢 Accumulation phase after capitulation
📐 Breakout path projects full reversion to long-term resistance line
🧠 Targets & Return on Invested Capital (ROIC):
📥 Entry Zone: $3.00–$3.50
⛔ Stop-Loss: Weekly close below $1.65 (wedge structure failure)
🎯 Target 1: $6.89
→ ROIC: +105.6%
🎯 Target 2: $8.26
→ ROIC: +145.5%
🎯 Target 3: $11.10
→ ROIC: +230%
🎯 Target 4: $16.24
→ ROIC: +383%
🎯 Target 5: $24.97
→ ROIC: +643%
🎯 Target 6: $32.48
→ ROIC: +866%
🎯 Target 7: $39.68
→ ROIC: +1081%
⚠️ Key Insights:
Technical compression resolved upward = breakout watch
Price > $4.00 could initiate strong upside wave
Attractive for long-duration swing traders and structured LEAP positions
Rare asymmetric opportunity within energy sector
💬 Will NFE reclaim its prior cycle highs over the next 3 years?
Follow us and track the setup as it unfolds.
#NFE #TechnicalSetup #WedgeBreakout #LongTermTrade #EnergyStocks #TargetTraders #10xOpportunity

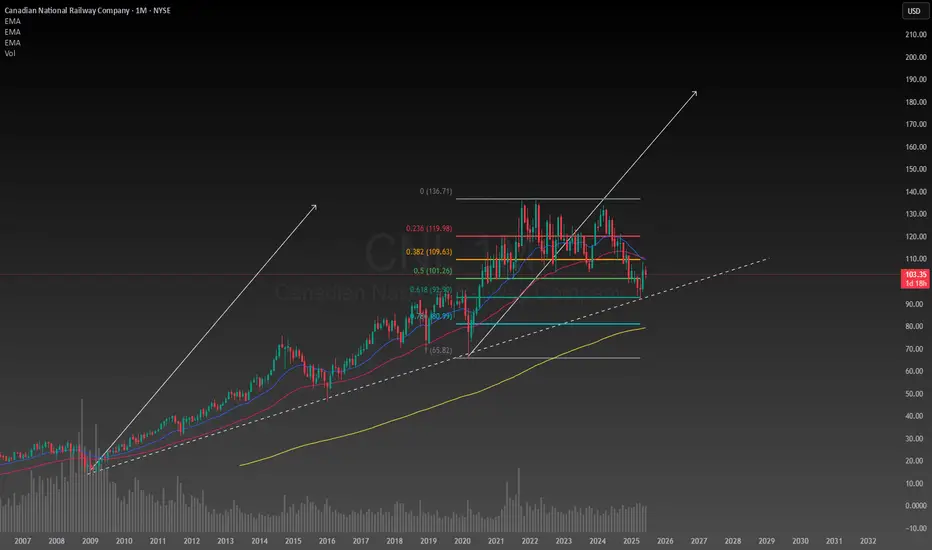
Canadian National Railway has huge upside potentialA decades old trendline still unbroken after months of correction, the Canadian economy seems to be in a great position considering the circumstances. After conducting a simple technical analysis predicting a second leg up the upside potential is enormous if I am right about this. The downside is I am looking at a monthly chart so this will need to be a position trade or long term investment to achieve the desired results. Even if my target is reached I will likely hold onto the stock for years afterwards because the company will continue to make money. The intrinsic value for CNI is between $120 and $225 so it is well below the intrinsic value making any new position on it now at a bargain deal. I will likely be allocating a significant portion of my portfolio to it in the next few days to weeks.
$PEP Bullish Swing Setup – Oversold & Ready to Rebound ?PepsiCo ( NASDAQ:PEP ) is sitting at a major long-term support after a deep pullback — this could be a strong opportunity for a risk-defined bounce. Here's what the chart is signaling:
🔹 Entry Zone: Price is currently near $128 — a historically significant level that acted as resistance in the past and now aligns with a potential support flip.
🔹 Oversold & Stretched: After a consistent downtrend, NASDAQ:PEP is looking oversold. A bounce is likely as sellers exhaust and dip buyers return at this key level.
🔹 Reversal Structure Building: Early signs of a bottoming pattern are emerging, with potential higher lows forming. If the current structure holds, we could see a climb toward the next resistance zones.
🎯 Targets:
TP1: $154 – minor resistance and previous consolidation zone.
TP2: $197 – major resistance and range high, aligning with earlier highs.
🛡️ Stop Loss: Below $102 — invalidates the support thesis and breaks structure.
💡 Why Price May Rise:
PEP is a defensive name with strong fundamentals, often benefiting during uncertain macro cycles.
Valuation is now more attractive after the sell-off.
The setup offers a high reward-to-risk ratio, especially if broader markets stabilize.
⚖️ Setup Summary:
Entry: ~$128
SL: $102
TP1: $154
TP2: $197
📌 Watching for confirmation with volume or bullish candle structure over the next few sessions.
🚫 Not financial advice — just a technical outlook based on structure and probability.

Stellantis | STLA | Long at $9.59Stellantis NYSE:STLA is the maker of the auto brands Fiat, Peugeot, Jeep, Citroën, Opel/Vauxhall, Ram Trucks, Dodge, Chrysler, Alfa Romeo, Maserati, DS Automobiles, Lancia, Abarth, and Vauxhall. The stock has fallen sharply due to a 70% profit drop in 2024, weak U.S. sales, high inventory, and tariff uncertainties. The turnaround for NYSE:STLA beyond 2025 hinges on new CEO Antonio Filosa’s focus on U.S. market recovery, new product launches (e.g., Ram 1500 Ramcharger, Jeep hybrids), pricing adjustments, aggressive marketing, $5B U.S. manufacturing investment, and mending dealer relations. The stock is trading at a P/E of 5.1x, debt-to-equity of 0.8x (not bad), a book value of $29 (undervalued), a tangible book value of $9.82, and earnings and revenue are forecasted to grow into 2028. Economic weakening and tariffs may hamper these predictions, but the new CEO and future interest rate drops may get this stock rolling again.
However, if NYSE:STLA shows zero sign of near-term recovery or other fundamental issues arise, I truly think this stock could enter the high $5-$6 range before a true reversal begins.
From a technical analysis perspective, the stock price is currently with my selected "crash" simple moving average. This area often signifies a near-term bottom, but like mentioned above, watchout out for the "major crash" simple moving average area currently between $5.83 and $7.09.
Regardless of bottom predictions, NYSE:STLA is in a personal buy zone at $9.59 with a greater position likely if it enters my "major crash" zone, as mentioned above.
Targets into 2027:
$12 (+25.1%)
$14 (+46.0%)

Diageo | DEO | Long at $101.15Diego NYSE:DEO is the owner of alcohol brands such as Johnnie Walker, Crown Royal, Smirnoff, Baileys, Guinness, Tanqueray, Don Julio, Cîroc, and Captain Morgan. The stock has fallen significantly since 2021 due to several factors, such as: post-COVID recovery slowdown; retail/travel disruptions hurting high-margin segments; inflationary pressures raising costs for materials like glass and agave, squeezing margins; consumer downtrading to cheaper alternatives; and macroeconomic headwinds. While tariffs may prolong overall recovery, I do not think it's the end for this company by any means.
Factors likely to drive NYSE:DEO stock higher include:
Interest Rate Cuts : Expected U.S. rate cuts in 2025 could boost consumer confidence and spending, benefiting premium brands. Lower rates may also reduce debt costs, easing pressure on its debt load.
Productivity Initiatives : NYSE:DEO $2B savings program (2025-2027) aims to improve efficiency, margins, and cash flow, potentially restoring investor confidence.
Undervaluation : Trading at 17.5x forward earnings (below historical 21x), the stock may attract value investors.
From a technical analysis perspective, NYSE:DEO has been riding my "crash" simple moving average zone. While the momentum has a strong downtrend, entry into this "crash" zone typically only happens a few times before a trend reversal. But there is a good probability, that my "major crash" zone (currently in the $80s) is possible before a true reversal. Regardless, without a crystal ball, I am starting to form a position and plan to add more if the "major crash" happens with this stock.
Thus, at $101.15, NYSE:DEO is in a personal buy zone with the noted potential for a drop into the $80s due to projected earnings revisions, etc.
Targets into 2027:
$120.00 (+18.6%)
$140.00 (+38.4%)

Amazon swing trade ideaAmazon has fallen below its trendline and started to dip slightly despite the fact that the broad market is going higher. I have found an opportunity for a decent long entry and have ran the numbers, the intrinsic value of Amazon right now is between $180 and $520. Not only is it a retail giant but is an emerging technology innovator and investment company. I got about 4% of my portfolio allocated to it now.

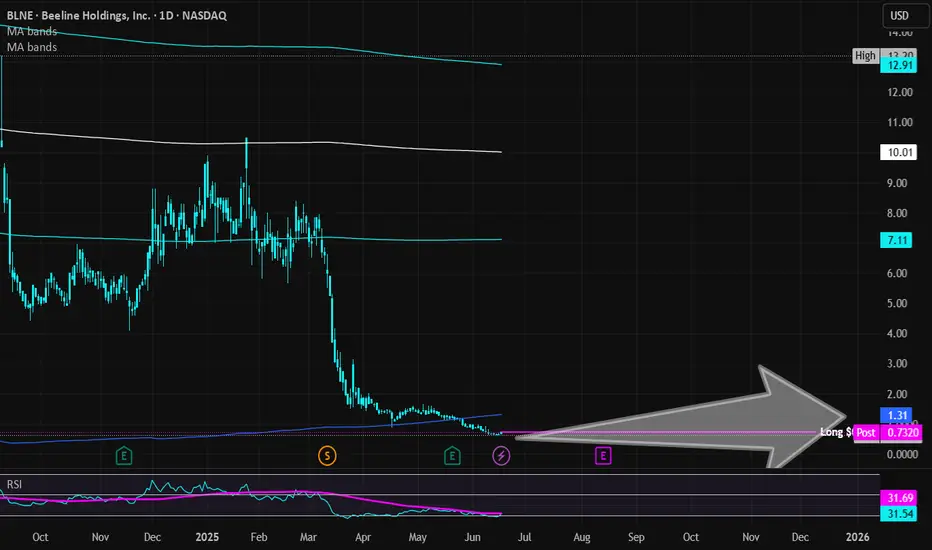
Beeline Holdings | BLNE | Long at $0.72**This is a VERY risky penny stock. Please do not invest if you are risk averse.**
Beeline Holdings NASDAQ:BLNE
Book value = $5.00-$6.00
Revenue past 12 months: $5.21 million (grew by 27.4% over the past year)
Debt-to-equity: 0.21x (low)
Insiders purchased almost $500k in shares in the past 6 months and volume increasing
6 million float, 1.96% short interest, 0.85 days to cover
This is purely a gamble play based on value and insider purchases. Thus, at $0.72, NASDAQ:BLNE is in a personal buy zone.
Targets:
$1.00
$1.25
XRP Price Finds Some Relief — But Headwinds Remain,Says ArtavionAfter slipping below $0.50 last week, XRP has rebounded modestly, now trading above $0.52. While this short-term recovery provides relief for holders, fundamental and structural challenges still limit the token’s upside potential, according to analysts at Artavion.
The recent bounce appears largely technical. Support held near $0.48, and with Bitcoin regaining strength above $66,000, sentiment across altcoins briefly improved. XRP’s Relative Strength Index (RSI) has moved out of oversold territory, suggesting some room for additional upside — but resistance between $0.56 and $0.60 remains firm. Low trading volume suggests the rally lacks conviction.
A major ongoing concern remains XRP’s legal battle with the U.S. Securities and Exchange Commission (SEC). Although Ripple Labs scored partial wins, the case is unresolved. Until a final judgment or settlement is reached, institutional investors will likely remain cautious, and U.S.-based platforms will continue restricting XRP exposure.
🗨️ “The legal cloud hasn’t lifted — and that limits capital inflows,” says a regulatory analyst at Artavion.
From a network perspective, XRP Ledger remains functional and Ripple’s payment infrastructure is active, particularly in select cross-border corridors. However, XRP still lacks integration with key crypto sectors like DeFi, NFTs, and gaming, which restricts organic demand and developer activity.
Externally, macro conditions are neutral to negative for altcoins. The Federal Reserve’s rate outlook and rising bond yields continue to pressure speculative assets. Stablecoin inflows into XRP trading pairs have slowed — another signal of fading short-term appetite.
Outlook
At Artavion, we believe XRP is currently locked in a range-bound pattern. A breakout above $0.60 is unlikely without:
Full legal clarity in the U.S.;
Stronger altcoin sentiment market-wide;
Renewed ecosystem development and integrations.
🗨️ “XRP isn’t broken — it’s waiting,” says the Artavion market desk. “But without a catalyst, it stays reactive — not directional.”


Trade Ideas For GOLD: Long and Short TRADE IDEA FOR SHORTS: Price may try to sell at Previous Day's High.
It may reject PDH following the order flow. US involvement will boost the
metals. Trump may announce or strike on the weekend.
TRADE IDEA FOR LONGS: The unmitigated demand level has broken structure.
Buyers here created new highs. So there may be a willingness to buy again from this level, considering the looming US involvement in Iran Israel war. I would be targeting the unmitigated sellers' block at 3.410.21

Wedge Breakout in Motion – 317% Potential Toward Channel Up📍 Ticker: NASDAQ:ACB (Aurora Cannabis Inc.)
📆 Timeframe: 1D (Daily)
📉 Price: $4.71
📊 Volume: 1.22M
📈 RSI: 42.76 (rising from oversold territory)
🔍 Technical Setup:
After years of decline, NASDAQ:ACB has broken out of a large descending wedge, with price pushing above downtrend resistance and reclaiming horizontal support.
🔼 Breakout Structure: Descending wedge + horizontal base
📉 Bear market floor established at ~$3.00
📈 Next key level: ~$5.60, then $9.00+
💠 Price projection drawn within expanding ascending channel, targeting mid-to-upper range reversion over time.
🧠 Trade Plan & Price Targets:
✅ Entry Zone: $4.60–$4.80 (confirmed breakout, medium risk)
✅ Entry Zone: $3.60–$3.80 (full gap retest, lower risk)
✅ Entry Zone: $2.95–$3.10 (Lowest low, lowest risk)
❌ Stop-Loss: Close below $4.00 (failed retest + support invalidation)
❌ Stop-Loss 2: Close below $3.55 (Lower than the biggest gap low level)
❌ Stop-Loss 3: Close below $2.84 (Lower than the lowest low)
🎯 Target 1: $5.60
→ 📈 Return: +18.9%
🎯 Target 2: $9.00
→ 📈 Return: +91.0%
🎯 Target 3: $15.00
→ 📈 Return: +217.0%
⚠️ Key Insights:
RSI curling up from below 40 = momentum shift
Short interest remains high → potential short squeeze trigger
Price is now above long-term downtrend — trend reversal scenario in play
Macro sentiment toward cannabis may act as catalyst
Still haven't started the biggest US market
💬 Can Aurora Cannabis light up again and return to its long-term channel highs?
Follow for more setups with asymmetric risk/reward.
#TargetTraders #ACB #CannabisStocks #WedgeBreakout #ChannelReversion #PennyStockSetup

Greer Free Cash Flow Yield (FCF%) — Long-Term Value Signal✅ Title
Greer Free Cash Flow Yield (FCF%) — Long-Term Value Signal
📝 Description
The Greer Free Cash Flow Yield indicator is part of the Greer Financial Toolkit, designed to help long-term investors identify fundamentally strong and potentially undervalued companies.
📊 What It Does
Calculates Free Cash Flow Per Share (FY) from official financial reports
Divides by the current stock price to produce Free Cash Flow Yield %
Tracks a static average across all available financial years
Color-codes the yield line:
🟩 Green when above average (stronger value signal)
🟥 Red when below average (weaker value signal)
💼 Why It Matters
FCF Yield is a powerful metric that reveals how efficiently a company turns revenue into usable cash. This can be a better long-term value indicator than earnings yield or P/E ratios, especially in capital-intensive industries.
✅ Best used in combination with:
📘 Greer Value (fundamental growth score)
🟢 Greer BuyZone (technical buy zone detection)
🔍 Designed for:
Fundamental investors
Value screeners
Dividend and FCF-focused strategies
📌 This tool is for informational and educational use only. Always do your own research before investing.


TIA Dynamic Support LineThe support I have set for Tia purchase
The QT process is ongoing. There is no liquidity in the market. In non-major markets, support levels are dynamically shifting downwards.
