ETHUSD: Buying opportunityWarning, this is highly speculative!
Ethereum faced a gruesome decline since the peak of around 4000 back in december, reaching a bottom of ~$1400
Then, in may, we had a huge rally, boasting a nearly 100% bounce from bottom to top.
Now, this fact alone has many people holding off on buying short term, as they feel a drop could be just around the corner, however, i think for this exact reason, aswell as an inbound risk-on environment, it will continue the rally, and much faster and for much longer than anticipated, creating that FOMO wave people seem so desperate to try and catch.
The whole reason you end up with the feeling of FOMO, is because your past decisions seem stupid in hindsight, and recent price action makes it seem obvious.
Well let me tell you, its NOT obvious, and that is precisely why it runs and creates that FOMO wave.
Price targets are irrelevant, focus on recognizing when greed runs amok, and take profits accordingly.
EOY Would be an obvious point at which selling heavy might be smart, but then again, its never obvious... Goodluck!
Value

Novo Nordisk: Massive buying opportunityNovo has been struggling big time, december and march hit especially hard.
American institutions have held large positions in Novo, and this was felt when they had to sell off due to risk management with the looming tariffs.
However, the sheer devaluation & importance of their export, is going to create a massive wave following a risk-on environment, which i firmly believe is coming.
One of the few large EU based firms worth investing heavy in.

XAU/USD ShortSimple setup.
Gold has performed exceptionally, but faces a likely correction due to an imminent flip from risk-off to risk-on.
Go risk-on while you're still relatively early!

Nike (NKE) Long Term Buy - Pennant SetupNKE -33.46% 1Y
Analysts price target = 73.05 (suggests ~16.3% upside)
EPS expected to bottom in Q4 '25
P/E ~35% lower than historical
P/S ~42% lower than historical
Dividend yield 2.57%
Buy Zone = 58-60
Target 1 Area = 70-72

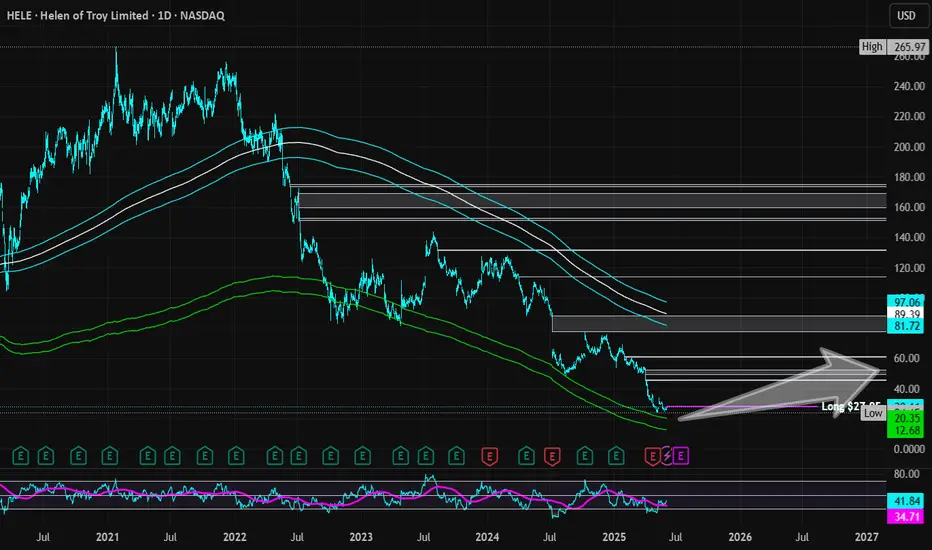
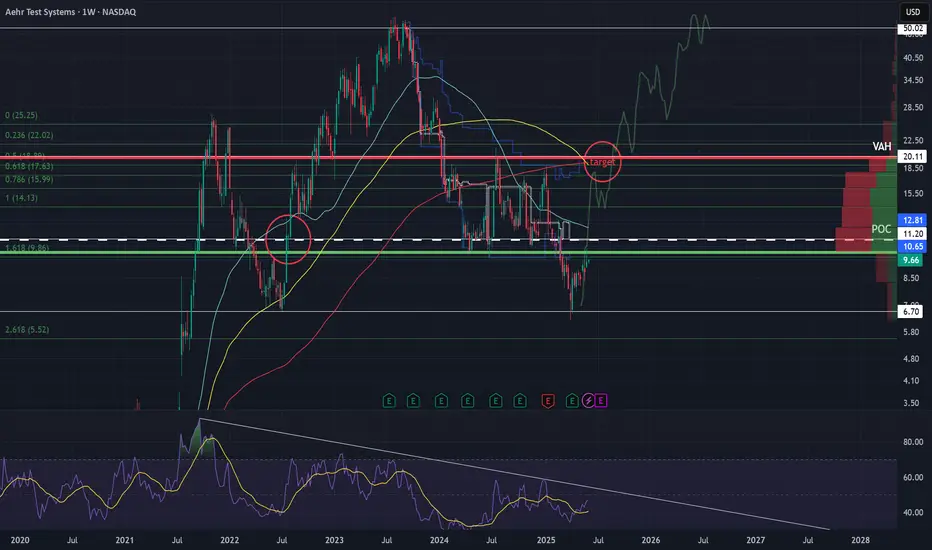
Helen of Troy | HELE | Long at $27.95Helen of Troy NASDAQ:HELE , owner of brands such as OXO, Hydro Flask, Osprey, Vicks, Olive & June, etc, has witnessed an immense decline in share price since its peak in 2021 when it hit just over $265. Now, trading in the $20s... Growth has been a problem for this company (now and future projections) and a major turnaround is needed. However, NASDAQ:HELE is implementing several growth strategies for 2025-2030 under its Elevate for Growth plan and Project Pegasus, so they are very aware of the need to re-inspire investor confidence. They also announced last month the appointment of an interim CEO and CFO. With a 22M float and 12% short interest, this could get interesting.
Excluding the current growth issue, the fundamentals of NASDAQ:HELE are quite strong:
P/E Ratio: 5x (undervalued)
Book Value: ~$70.00 a share (undervalued)
Debt-to-Equity: 0.6x (healthy)
Quick Ratio: Over 1 (healthy)
From a technical analysis perspective, it may have just formed a double-bottom near $24-$25, but a quick drop between $10-$20 is absolutely possible if bad economic news emerges.
At $27.95, NASDAQ:HELE is in a personal buy zone with a caution regarding the US economy and this company's ability to turn things around moving forward.
Targets:
$40.00 (+43.1%)
$52.00 (+86.0%)
Revenue growth nine consecutive quarters Ouster’s global partner network spans over 50 countries, supporting approximately 600 customers with applications in autonomous vehicles, robotics, drones, mapping, defense, and smart cities. Ouster has been getting lots of attention lately 230k 20 call 1/16/26 I'm wondering if someone knows there's an announcement coming this year that will get them ABOVE $20. Great growth stock huge partners here are some notable ones.
Anduril Industries: weapons/defense tech *
Komatsu: construction mining *
Vecna Robotics: warehouses
NVDIA: integration/traffic ***
Forterra, Textron, Field AI, and U.S. Army: vehicles
Google Maps, Apple Maps, Oshkosh Defense, John Deere: sensory
Amazon Robotics: Ouster’s LiDAR sensors are reportedly used in Amazon’s Proteus robots, described as part of a significant order, though not officially published. ***
Right at monthly resistance now 15$ is a strong resistance. Any pull back to $10 ish would make great buying opportunity I'm long from earlier this week July 14C / 16C Aug 17C looking to add BUT I'm also trading these the daily RSI is at 75 nearing overbought, weekly has room to run at 64 monthly is at 50 which it could reject momentarily from. Either way great company to DCA shares still under 1B market cap!

Columbus McKinnon Corp | CMCO | Long at $14.90Columbus McKinnon Corp NASDAQ:CMCO is a stock that is highly cyclical, moving in "boom and bust" cycles every 3-5 years. As indicated by its entry into my "crash" simple moving average area (currently between $11 and $13), it may be nearing the end of its bust cycle (time will tell). With a book value at $31, debt-to-equity of 0.6x (healthy), quick ratio over 1 (healthy), insiders buying over $1 million in the past 6 months, a 2% dividend yield, and earning forecast to grow after 2025, NASDAQ:CMCO may be a hidden gem for double-digit returns in the coming years. But every investment is a risk.
Thus, at $14.90, NASDAQ:CMCO is in a personal buy zone.
Targets:
$25.00 (+67.8%)
$30.00 (+101.3%)

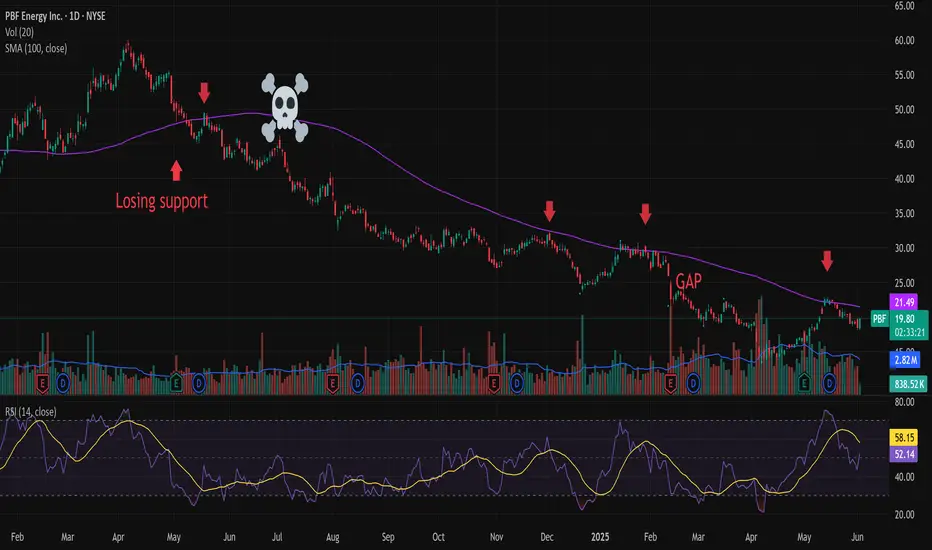
PBF Energy turnaround happening?Fundamentals:
The stock is trading at 0.42x book value, and pays 5.58% dividend. Of course, if profitability deteriorates further, the dividend can be cut and the P/B value can fall lower, but!
PBF is doing a good job on cost cuts, in the last earnings report posted narrower loss than expected
The mexican company 'Control Empresarial de Capital' is continously buying shares of the company, and nor Carlos Slim, neither another insiders-holders selling shares.
Technicals:
The 100 day moving average is the Boogeyman for PBF Energy.
One year ago, early May 2024 the price lost it, and never got back above.
Death cross happened in 2024 July.
Got rejected by the 100MA 4 times, as seen on the picture. The 50day got under the 100, but not worked as support. In 2025 Jan-Feb it tried, but failed.
Is this time different?
A final washout is already happened to $13.45 in April.
In May 2025, the 100MA rejected the price again, but this time the 50MA held as support.
Now the price battles with the 100MA again, break above means a target of $25, as this is an unfilled gap of 2025 February, and the 200 day MA.
Short-term traders can set $25 as target.
Long-term investors can eye $32-36 with proper risk management, or continous buying-selling. Can take a year or two.
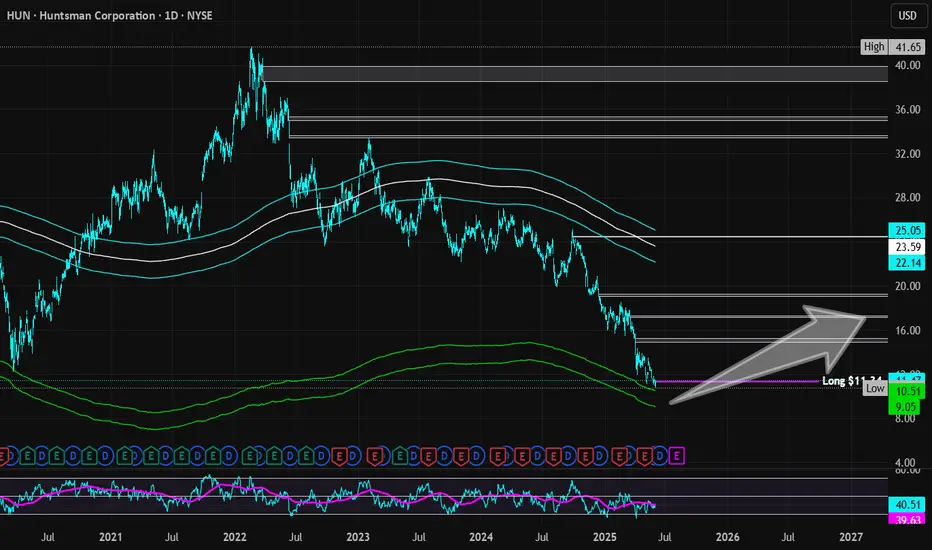
Huntsman Corporation | HUN | Long at $11.34The stock price for Huntsman Corp NYSE:HUN , a manufacturer of organic chemical products, has dropped significantly since its peak in 2022 ($41.65). This was due to lower sales volumes, weak demand in construction and transportation, higher input costs, and European operational challenges, including a $75M hit from closing a German Maleic Anhydride facility. This year (2025) is anticipated to be its worst earnings year, and the stock is priced as such. However, this stock is historically cyclical, and the company expects recovery / growth again in 2026. Moving forward, earnings are forecast to grow and the company is trading at good value compared to peers and the industry. While many headwinds may still exist with tariffs, etc., insider are grabbing shares and large options positions (very bullish). With a book value of $17, debt-to-equity at 0.8x, quick ratio under 1, etc., the company appears healthy.
From a technical analysis perspective, the stock price just barely missed my "crash" simple moving average area (currently between $9.00 and $10.50). It may reach those levels and below in 2025, for which I will add another position as long as fundamentals do not change. This moving average area often signifies "bottom" territory and historically, the stock has rebounded from this area. While my entry at $11.34 may be a little early, predicting true bottoms isn't my trading method and I hope to strengthen the position at lower trading prices.
Targets:
$15.00 (+32.2%)
$17.25 (+49.9%)
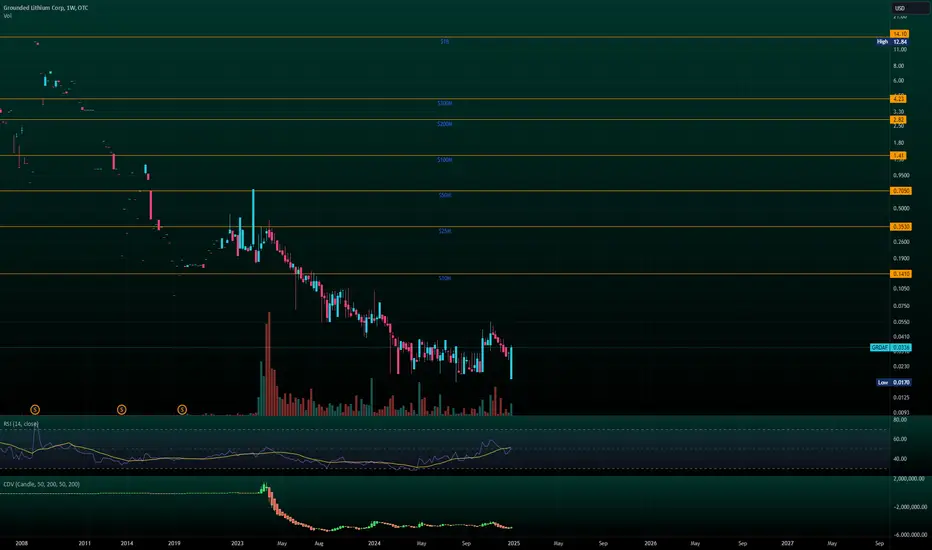
Grounded Lithium - undervalued, strong business modelGrounded Lithium and Denison Mines are exploring and developing direct lithium extraction (DLE) from brines in Western Canada. Exploration is being directly funded via Denison Mines, who has the option to provide funding in exchange for deposit ownership. Their current deposit has an after tax NPV with 8% discount rate of $1B. Grounded Lithium currently owns 70% of the deposit and will, ultimately, own 25% of the deposit ($250M NPV). Assuming Grounded Lithium is bought out by Denison Mines at a rate of 30% of the NPV, Grounded Lithium will be valued at $75M, a 30x increase from their valuation today. This does not include any added value from additional discoveries or other reasons.
This is a long play and I do not expect Denison to make an offer until their buy-in phases have completed in 2026-2027.
Wedge pattern - Bullish Strategy (MSTR)My expectations for June for Microstrategy stock aka Strategy. Ofc, It all depends heavily on BITSTAMP:BTCUSD

100% run up into earningsChance to get hot with semis if SPX can claim above 5950
High $8 for buying until we lose the 50MA.
Break above 12 with strength/volume will be key for continuation to 20.
Price-To-Earnings ratio (12.6x) is below the US market (17.8x) *
Revenue is forecast to grow 17.78% per year *
Earnings grew by 47.8% over the past year *
Short Interest 6.94M
Short Previous Month 7.16M
Short % of Shares Out 23.30%
Short % of Float 26.13%
Short Ratio (days to cover) 17.67
they will have tariff issues, so guidance is likely to bring uncertainties
Bitcoin analysis based on market liquidity and M2 money supply This trade enters Bitcoin in the $101,500–$102,200 zone, aiming to capture a high-probability bounce from a dense liquidity pocket formed by recent long liquidations. This region has historically acted as a bull market reaccumulation zone, typically holding after 5–8% drawdowns during major trend continuations.
The trade is structured to ride a macro continuation leg toward $125,000, targeting the next major expansion phase driven by both short squeezes (clustered above $106K) and a broader surge in demand following increasing M2 money supply and institutional inflows.
The stop-loss is placed at $97,000, a deliberate distance below local support but above the deeper liquidity sweep zone at $89K–$92K. That level is unlikely to be reached unless the market undergoes a full liquidation cascade, which would likely bypass $97K altogether in a fast move. This stop protects against structural failure while avoiding premature exits in normal volatility.
The setup is designed for maximum reward with acceptable risk, offering a risk-reward ratio of over 4:1, and aligns with the thesis that Bitcoin is entering its final acceleration phase toward a new macro high.

GOLD SHORT ENTRY
AronnoFX will not accept any liability for loss or damage as a result of
reliance on the information contained within this channel including
data, quotes, charts and buy/sell signals.
If you like this idea, do not forget to support with a like and follow.
Traders, if you like this idea or have your own opinion, please feel free command me.

POLESTAR (PSNY) - LONGTERM BUYING OPPORTUNITY, RISK:REWARD 1:10Polestar (PSNY) has been in a long term downtrend since its launch on the NASDAQ, the EV sector has seen some excitement however adoption to EV vehicles has been a slow trend worldwide compared to the hype when first introduced. At current, EV sector participants are in the beginning phases of mass adoption and battery and charger technology is seeing some much needed advancement before mass adoption can take place, many barriers exist in real world infrastructure and this technology will take many years to advance. The promise of autonomous self driving will ultimately catapult these EV companies to new heights financially, however the timing is not right just yet. Once AI advances enough to power ASD, rob taxis and self driving will be a common sight around the world starting in smaller cities and eventually becoming advanced enough to power more of the vehicles worldwide. Polestar's all time low trading price is at $.60 cents and currently sits right above $1.00 per share. Any price between $.60 cents and its current price would be a good 1:10 risk reward investment with downside very limited to potential upside gains to $10 and potentially higher in the long term future. If the EV and AI fulfill its promise, the investment should pay off in the long term.
Disclaimer: With any investment advice especially those where you plan to invest your hard earned money, do your own research before taking any financial advice to understand your exposure and risk tolerance, analyze the utilization of any broker(s) or investment vehicle(s) to understand how your funds are stored or utilized within the platform and always have a plan and strategy prior to entering any market.

XMR/USDT Monero super cycleWarning: LONG READ
TL;DR: Monero is going to encapsulate a similar growth cycle to Bitcoin's, Privacy, agency and its extremely decentralized nature will create a FOMO storm, a new narrative for the next many years, an uprising against the control and attack on our free will as citizens.
_________________________________________________________________________________
These past few years we've seen an incredible surge in surveillance, government intervention, banks freezing funds, the list goes on, of which has led many people into deep frustration and dissatisfaction with the system.
However, what it really boils down to is the lack of agency, and within that, the lack of privacy.
This coming storm of rebellious action against the system of surveillance and control, will mean new market possibilities, and Monero is an obvious pick.
Despite its headwinds throughout the years, Monero has had incredible resilience, likely due to its very nature, providing exactly what it means to provide, privacy, agency, and decentralization.
Bitcoin has led the frontier of agency and decentralization, but an ever increasing concentration of mining power, means that its decentralization is being partially eaten away at, losing some of its initial pull of being "The people's money"
Slowly turning into a transaction-less store of value, where more and more people simply hold on without actually using it, Bitcoin was never going to have any future as a sort of day-to-day cash or money that some people were hoping for.
This should have been obvious all along, even in earlier days, that the adoption would eventually lead to stagnating transaction count, aswell as miner & ASIC concentration, meaning an ever, not increasing, but instead decreasing decentralization.
Bitcoin in its earlier days was also seen as a private, but this is simply a lack of studying Bitcoin, because its always been clear as day that we would eventually run our heads against the wall.
With states having tools to track everything, and firms like Arkham who recently uncovered Strategy's (MicroStrategy) Bitcoin wallets, where Michael Saylor prior had stated he would never unveil the adresses or location of said Bitcointo preserve privacy, well, of course someone was inevitably going to find out, Bitcoin is after all, a fully transparent blockchain, which is also good in its own sense, but that brings us to the exact problem we're facing now.
And no, i don't think Bitcoin is going anywhere.
But how are we going to take back that decentralization, take back our privacy (we never had it on Bitcoin but it certainly pushed the value thinking it did) take back our agency AND have an actual day-to-day use case where we can transact without being taxed in gigantic fees for even the smallest sums?
Monero, and it has been Monero for over a decade now.
Monero ticks all the boxes that people are so desperately trying to figure out, and Monero is slowly creeping up again, seeing impressive price increases despite its recent scrutiny, with the EU set to ban it in 2027.
Whitewashing, crime, all kinds of illegal activity, that's what the nations and states see Monero as, and for the vast majority of people, it keeps them from buying the asset, in fear of being punished for owning or using it.
Do you remember the early days of Bitcoin? I certainly do
Countries & influential people would hang Bitcoin out for being only used for criminal activity, and being nothing more than a pyramid scheme.
Again, it should be obvious that it would never be the case, a completely transparent blockchain, crime? really? the smartest criminals are not THAT stupid.
Yes, many criminals probably use Monero, the same way as criminals use dollar bills for crime, because its for a large part untraceable.
But is that untracability a feature or a flaw?
In Monero's case, its a FEATURE
A feature so undervalued, you can't even begin to comprehend the sheer size of its importance
And no, I don't support criminal activity, but Monero being used for it simply means that it is doing exactly what it sets out to be, private and untraceable.
Its not the form of money's job to fix crime, that's the job of the government and politians we "elect" in our "democracy"
It is crystal clear to me, that Monero will create a throne for itsself in the top, claiming the original purpose of Bitcoin, The people's money.
Untraceability, Privacy, Decentralization, Agency.
These key features aswell as the scrutinty it is facing on the national level, will nothing but fuel the FOMO.
The ultimate resilience, the ultimate cryptocurrency.
If you're still this early, i sincerely salute you, and congrats on life changing wealth and privacy.
BINANCE:XMRUSDT.P KRAKEN:XMRUSD CRYPTO:XMRUSD

Sell then Buy NQSelling from market vol movement. Buy for sustained trend similar to Gold. Slipping for too many reasons

Regeneron Pharmaceuticals | REGN | Long at $502.28Regeneron Pharmaceuticals NASDAQ:REGN stock dropped more than 17% today due to mixed Phase 3 trial results for itepekimab, a potential COPD drug. However, the company has an extensive drug pipeline, raked in over $14 billion last year, and is currently trading at a price-to-earnings of 15x. Debt-to-equity is 0.09x (extremely healthy) and earnings are forecast to grow 7.5% per year. While 2025 is anticipated to be its "worst" earnings year, the outlook through 2028 looks like steady growth in revenue and cash flow.
From a technical analysis view, the stocks entered my "crash" simple moving average zone today (currently between $466 and $502). More often than not, this area signals a bottom in the near-term, but it's not guaranteed. I wouldn't be surprised if the $450s-$460s get hit before a reversal if the market shifts negatively - which will be another entry for me. If it moves into my "major" crash zone in the $300s to close more gaps on the daily chart, I will be piling into this stock heavily (like I did with NYSE:UNH ) for a longer-term hold - of course, unless fundamentals change. I'm going to keep my target small unless there is a "major crash" and eye the closing of the nearest price gap on the daily. There is another between $883-$914...
Targets:
$590 (+17.5%)

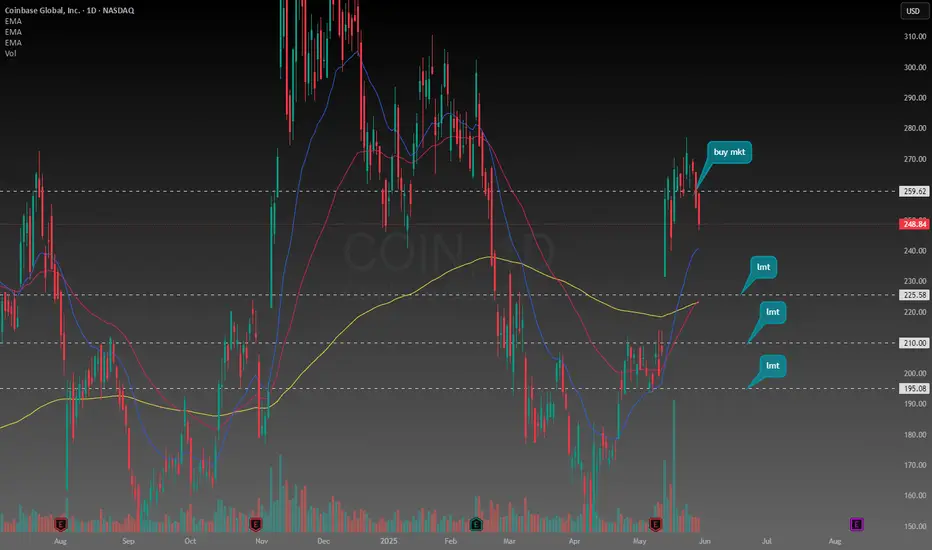
Coinbase is an excellent instrument for exposure to cryptoTrading at roughly 2x the price of Bitcoin, Coinbase presents a unique opportunity for exposure to the crypto sector. Fundamentally it is better to invest money for the long term on a business that generates revenue. I am very bullish on crypto, but with limited funds I want to make sure I deploy my capital as intelligently as possible.
There is several interesting strategies Coinbase uses to generate revenue based on crypto and blockchain processes and capabilities. From being able to exchange currencies like traditional currency systems for payments or money transfers. Mining proof of work assets like Bitcoin have used far too much resources to not be considered "valuable, and scarce". Proof of stake where staking rewards payout better than most dividends. Recent institutional adoption by some of the most significant entities. Coinbase has a portfolio of most of the crypto currencies so it guarantees a diverse exposure to the sector.
Its very obvious the people are loving crypto currencies, I want to be exposed to crypto but also want to invest in the fundamentals of generating revenues. Coinbase is the perfect vehicle in my opinion for exposure to crypto they generate revenues based on commissions and spreads, I'm sure they have some other strategies they use to consistently generate income even if crypto is going down, so that makes me even more convicted in my decision to put my money on Coinbase stock. Only being listed on the Nasdaq for four years I believe we are in for a wild ride to the upside so long as Bitcoin and the crypto market as a whole continue with this volatile momentum.
XAUUSD MARKET FORECAST Gold has defined a 4 hour chart dealing range in confluence to the Daily chart bearish ChoCh.
I stalk rejections in areas of interest (4h) to give us Bearish price action on the 30 min chart, I further will investigate on the 5 min chart after 30 min momentum swing downside either on the second leg swing high or on retracement after price breaks down (LL).

DCA into $FI- NYSE:FI is big recognizable brand in Point of Sales. You might have seen clover handheld machines.
- I believe fundamentals on this blue chip company is getting cheap. I'm not going all in but have started DCA into this name.
- If it falls further 20-30 or even 40% I will be happy to DCA further.
- Fundamentally, I am buying it close to fair value.
Year | 2025 | 2026 | 2027 | 2028
EPS | 10.21 | 11.91 | 13.88 | 15.72
EPS% | 16.35% | 16.63% | 16.51% | 13.25%
- Any company which is growing EPS% mid teens with a recognizable brand value deserves a fair forward p/e of 20
Base Case Fair Value w/ forward p/e = 20:
Year. | 2025 | 2026 | 2027 | 2028
Fair Value | $204 | $238 | $277.6 | $314.4
Conservative Base Case fair value w/ forward p/e=15:
Year. | 2025 | 2026 | 2027 | 2028
Fair Value | $153.15 | $178.65 | $208.2 | $235
Bull Case Fair value w/ forward p/e=25:
Year. | 2025 | 2026 | 2027 | 2028
Fair Value | $255 | $297 | $347 | $393
Bear Case fair value w/ forward p/e = 10:
Year. | 2025 | 2026 | 2027 | 2028
Fair Value | $102 | $119 | $138 | $157

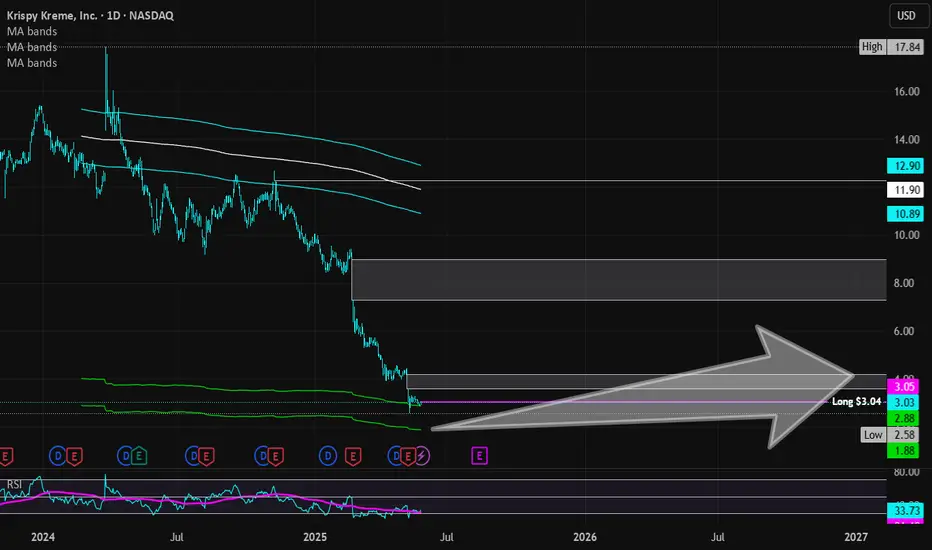
Krispy Kreme | DNUT | Long at $3.04Krispy Kreme NASDAQ:DNUT has entered and slightly exited my simple moving average "crash" indicator. More often than not, this zone (currently between $1.88 and $2.88) is a bottom indicator. However, this means there is a still a probability that stock could drop to a value less than $2 in the near future (and I wouldn't be surprised if it gets there). But predicting a "true" bottom is a fool's game. Building a position using data-driven decisions is the best strategy.
Fundamentally, NASDAQ:DNUT has many economic headwinds and a relatively high probably of bankruptcy in the next 24 months. It brought in $1.6 billion in revenue in 2024 and is a great target for takeover, but that requires a crystal ball. Earnings are anticipated to become positive by 2026, but growth is slow. The dividend yield, currently around 4.8%, may get cut in the near-term to help the company financially (again, crystal ball needed). Short interest is 30% with a float of 78 million... Debt to Equity = 0.90x. Essentially, if it can get through 2025, the company predicts it can turn things around into 2026 and beyond.
So, is this a good investment? Fundamentally, many better options are out there. From a technical analysis perspective, a potential opportunity. Thus, a gamble. I'm not betting the farm here, but at $3.04, NASDAQ:DNUT is in a buy zone - with a warning for potentially better entries to emerge in the near future in the $1-$2 range.
Targets:
$3.60
$4.20
Where to Look Today: 5 Hot Crypto Sectors with Real UtilityHello traders and investors!
These five sectors are seen as the most promising areas for crypto market development. Each represents real blockchain applications, not just speculation: they enable simpler, faster, and cheaper access to finance, data, and computing power. Based on them, you can build a diversified crypto portfolio. Each sector offers unique drivers—from real-world assets to AI. This selection helps you navigate trends and pick promising tokens according to your strategy and investment horizon.
1. Real-World Assets (RWA)
What it is: Real assets—such as bonds, real estate, or commodities—are digitized and issued as tokens on the blockchain. These tokens can be bought, sold, used as collateral, or integrated into DeFi applications.
Why it’s growing: Institutional players (funds, corporations, DAOs) are seeking reliable yield and transparency. Over $7 billion has already been invested in tokenized US Treasuries.
Top tokens:
ONDO: Token of Ondo Finance: offers access to tokenized funds, including U.S. Treasuries from BlackRock.
CFG: Token of Centrifuge: connects real assets (invoices, equipment, real estate) to DeFi, allowing companies to receive financing.
POLYX: Token of Polymesh: a blockchain specialized in securities tokens, with a focus on regulation and compliance.
RIO: Token of Realio: merges traditional assets (e.g., real estate) with DeFi and private equity potential.
2. Ethereum Layer-2 / Rollups
What it is: Layer-2 networks (Optimistic and ZK-rollups) process transactions separately and then send them to Ethereum in batches. This lowers load, speeds up the network, and reduces fees.
Why it’s growing: Layer-2 scales Ethereum without compromising security. Transactions become cheaper, dApps faster, and startups/corporates can build without overloading the base layer.
Top tokens:
ARB: Token of Arbitrum, the largest Optimistic Rollup network.
OP: Token of Optimism, which is being integrated into various partner projects and DAOs.
zkSync: Layer-2 platform based on ZK-rollups, focused on scalability and privacy. Native token: ZK.
STRK: Token of StarkNet, one of the most advanced ZK-based solutions.
3. Restaking & EigenLayer Ecosystem
What it is: If you’ve already staked ETH, you can reuse it by delegating it to EigenLayer, which lends it to other protocols. If they act honestly, you earn extra yield. This is restaking.
Why it’s growing: One ETH can now generate multiple streams of income. Restaking increases capital efficiency and supports a new ecosystem of reliable services that don’t need their own security. Total Value Locked (TVL) has already exceeded $15 billion, and the EIGEN token has just launched.
Top tokens:
EIGEN: Native token of EigenLayer.
ETHFI: Ether.fi platform issues eETH and enables restaking without transferring ETH custody to third parties.
PUFFER: Protocol offering pufETH—a token for restaking in EigenLayer. It features enhanced protection from price manipulation and MEV (Maximum Extractable Value) front-running, focusing on security and restaking yield optimization.
RSETH: Token from KelpDAO earned via restaking through EigenLayer. It's a liquid equivalent of a staked token, usable in DeFi apps while your ETH keeps working.
4. Yield Tokenization
What it is: Splitting an asset into two parts: principal and future yield. This lets you sell or buy just the yield the asset will generate.
Why it’s growing: It brings flexibility to financial planning. Users can lock in returns or buy discounted yield. A bond-like market within DeFi emerges. Traders, funds, and DAOs benefit from flexible and strategic income management.
Top tokens:
PENDLE: Sector leader; supports yield trading from crypto assets (e.g., stETH) and tokenized RWAs. Enables separating "principal" and "interest" to trade them independently—like selling a bond coupon without selling the bond itself.
ELEMENT: Allows trading fixed and variable yields. Users can split a yield-bearing token (like an LSD) into two parts—one entitled to yield, one not.
SWIVEL: Designed for institutional clients: supports KYC/AML and packages deals as fixed-rate, long-term bonds, easily understood by funds and treasuries. Works with crypto assets (e.g., staking and DeFi tokens) but presents them in traditional finance format.
5. AI & Decentralized Compute
What it is : Projects at the intersection of AI and blockchain: decentralized rendering, GPU power exchange, model training, and data sourcing.
Why it’s growing: Decentralized compute enables AI scaling without centralized cloud dependence. It boosts privacy and global access to AI infrastructure.
Top tokens:
FET: Fetch.AI: platform for creating "smart agents" — AI that can autonomously negotiate, buy or sell services and data. Entirely blockchain-based and mediator-free. Promising for automation in logistics, smart cities, and data economy.
TAO: Token of Bittensor: a network where thousands of participants train and share AI models. TAO is used for payments, rewards, and governance. Think of it as "Bitcoin for neural networks."
RNDR: Render Network connects users with spare GPU power to those who need rendering. A decentralized cloud-rendering system paid in tokens. In demand for 3D, film, and metaverses.
GRT: The Graph helps find and structure data from decentralized apps. Like Google for Web3—essential for the growing Web3 ecosystem.
Each of these sectors reflects real utility and demand for blockchain innovation. Following them may help you form a future-proof, high-conviction crypto portfolio.
Wishing you profitable trades!
