A Step-by-step Guide to One of the Chart Analysis MethodHello Friends,
Welcome to RK_Chaarts,
Today we're going to learn step-by-step guide to one of the chart analysis Method by analyzing a chart of " Varun Beverages Ltd. (VBL) " to identify a trend change opportunity.(Educational Post).
Let's get started!
Applying Elliott Wave Theory
First, we can see that the bottom formed in March 2025 is likely a Wave ((4)) in Black as a bottom, marked as such on the chart. From there, Wave 5 should move upwards. Looking at the daily timeframe, we can see that price gone up in five sub-divisions of Wave (1) in Blue of Wave ((5)) in Black have completed, marked as Red 1-2-3-4-5, that means blue intermediate Wave (1) has ended, and Wave (2) has begun, which is unfolded in corrective nature marked as WXY in Red of Wave (2) in Blue.
According to the wave principle, Wave (2) should not retrace more than 100% of Wave (1), which started from the 419.65 bottom. Therefore, 419.65 becomes our invalidation level. If the price moves below this level, it would invalidate our Wave (2) principle.
Assuming our wave counts are correct, the upward movement is in the five sub-divisions, and the downward movement is in the three sub-divisions. Definitely, the conviction is increasing that we have correctly identified Waves (1) and (2). Shown in chart image below
Tweezers at Bottom
Now, we can see that Wave 2 has retraced more than 70% and has formed a Tweezer candlestick pattern at the bottom. A bearish candle was followed by a bullish candle, both with a Tweezer-like shape, with the second candle being green. This could indicate a potential reversal. Moreover, the latest candle has also taken out the high of the previous two candles, showing follow-through. The price has also shown follow-through on the upside after that. So, this can be considered as the first sign that Wave 2 might be ending, marked by a significant Tweezer pattern at the bottom with a follow-through candle. Shown in chart image below
Significant Breakout Pending Yet
Secondly, from the top where Wave 1 ended, we've been considering the decline from around 560.50 as a resistance. We drew a resistance trend line, and if the price breaks out above it, we can say that the resistance trend line has been broken, indicating a breakout above the last fall's trend line, Which is not Broken yet. Shown in chart image below
Dow Theory
The Dow Theory states that when the price moves up, it forms a Higher High, Higher Low pattern, and when it moves down, it forms a Lower High, Lower Low pattern. Somehow, the Dow Theory also needs to change, as the last swing was forming a Lower High, Lower Low pattern. The last swing high was at 479, which we marked with a green arrow. If the price crosses above it, we can say that the price is now forming a Higher High pattern. This indicates that the Dow Theory is changing from a falling trend to a rising trend. Shown in chart image below
Stop Loss
Once the Dow Theory also changes, we can use the last swing low at 446.15 as our stop loss. However, this stop loss will only be valid after the Dow Theory changes; otherwise, the invalidation level will remain at 419. Shown in chart image below
Projected Target of Wave (3)
So, friends, we've applied the Elliott Wave principle, and there's been a significant retracement, all within the valid range, without violating any rules or triggering invalidation. There's limited room left on the downside, and then we have the Tweezer candlestick pattern, which is a significant sign. We're expecting a reversal from there, and the price has followed up with an upward move.
What's left now is the breakout above the resistance trend line and a change in the Dow Theory. Once these two conditions are confirmed, all parameters will match, and we can add a position to our portfolio using the last swing low as our stop loss, instead of the invalidation level.
This is how chart analysis is done for investment purposes. We've seen many signs in our favor, and yet we still use a stop loss to prevent significant losses in case the stock or market moves unexpectedly. This is what stop loss is all about - minimizing potential losses.
We've also discussed the target projection based on Wave theory, 161.8% level, which we explained through an image. So, friends, I hope you've understood the entire conclusion and learned how to analyze charts using different methods, one of which we shared with you today.
I am not Sebi registered analyst.
My studies are for educational purpose only.
Please Consult your financial advisor before trading or investing.
I am not responsible for any kinds of your profits and your losses.
Most investors treat trading as a hobby because they have a full-time job doing something else.
However, If you treat trading like a business, it will pay you like a business.
If you treat like a hobby, hobbies don't pay, they cost you...!
Hope this post is helpful to community
Thanks
RK💕
Disclaimer and Risk Warning.
The analysis and discussion provided on in.tradingview.com is intended for educational purposes only and should not be relied upon for trading decisions. RK_Chaarts is not an investment adviser and the information provided here should not be taken as professional investment advice. Before buying or selling any investments, securities, or precious metals, it is recommended that you conduct your own due diligence. RK_Chaarts does not share in your profits and will not take responsibility for any losses you may incur. So Please Consult your financial advisor before trading or investing.
VBL

VBL: A Multibagger ready to break Key Resistance LevelTechnical Pattern :: Inverted Head & Shoulder
Key Resistance :: 660 has become a crucial resistance which it is not able to break and sustain.
It is again approaching the same level.
Possibility and Possible Move :: If this time is sustains (Successful Breakout and a retracement) then It can continue it's log time trend. (Bullish --> confirmed by a Pole and Flag pattern on weekly and monthly chart)

Vbl crash with Low volume can give reversal When a stock (or any tradable asset) experiences a volume breakout level crash but does so with low trading volume, it can often signal a potential reversal rather than further downside movement.
Here’s why:
1. Weak Commitment: A price break below a significant support level on low volume indicates there isn't strong conviction among market participants. In other words, sellers are not aggressively dumping shares, and buyers are likely cautious. This implies the move could lack sustainability.
2. Reversal Potential: Low-volume breakdowns often reflect temporary price movement caused by minor selling pressure, rather than a trend-defining event. If demand re-emerges or larger buyers enter the market at these lower prices, the stock may rebound above the support, triggering a reversal.
3. Significance of Support: Support levels act as zones where buying interest historically outpaces selling pressure. A false breakdown (especially on low volume) below such a level can prompt a "trap," where sellers expecting further decline are forced to cover when prices rebound, amplifying the reversal.
Key Considerations:
Volume Analysis: Always compare the volume during the support breach to the average volume. A convincing breakdown requires high volume to confirm significant selling pressure.
Catalysts: Check for underlying reasons, such as news, sector performance, or earnings reports, which could explain low-volume moves.
Price Action Afterward: Watch for a reversal candle pattern (like hammer or engulfing candle) at the breached level to validate reversal potential.
To summarize: A crash below support on low volume often indicates an unreliable breakdown and increases the probability of a reversal, especially if significant buyers step in at the lower price zone.

VBL swing trade | visit chart for detailsHello,
Trend-Based Analysis. Buy the Dips, Sell The Rallies, Also Following the Trend. Let's see where the Price Action takes us, Riding the wave. Potential trade setups based on trend momentum.
Technical analysis based on trend identification and momentum, Looking for high-probability setups within the prevailing trend.
Analyzing the current market trend and potential future price movement. Focusing on risk management and reward-to-risk ratios.
Details is Mentioned in Chart, Read carefully.. .

Strong Buy-Varun Beverage-VBL
Strong Buy above 1619
T1-1674
T2-1760
SL-1551
26.06.2026
1. Inside candle broken
2. Range broken and price taken retracement
3. Wait for weekly green candle
4. Price rejection at 0.618 Fibonacci
5. Previous resistance turned to support

Just A View - VBL 📊 Script: VBL
📊 Sector: FMCG
📊 Industry: Food - Processing - Indian
Key highlights: 💡⚡
📈 Script is trading in consolidation zone since last few trading session.
📈 Script has to give breakout or breakdown to came put of consolidation zone.
📈 For breakout script has to give closing above 1644, and for breakout script has to give closing below 1578
KEEP AN EYE ON STOCK
⚠️ Important: Always maintain your Risk & Reward Ratio.
✅Like and follow to never miss a new idea!✅
Disclaimer: I am not SEBI Registered Advisor. My posts are purely for training and educational purposes.
Eat🍜 Sleep😴 TradingView📈 Repeat 🔁
Happy learning with trading. Cheers!🥂

Keep An Eye - Consolidation Breakout Soon - VBL📊 Script: VBL
📊 Sector: FMCG
📊 Industry: Food - Processing - Indian
Key highlights: 💡⚡
📈 Script is trading near its resistance level which is 1477.
📈 Script is trading at upper band of BB and giving breakout of it.
📈 MACD and Double Moving Average are giving crossover .
📈 Right now RSI is around 62.
📈 One can go for Swing Trade only above 1477.
BUY ONLY ABOVE 1477
⏱️ C.M.P 📑💰- 1475
🟢 Target 🎯🏆 - 1561
⚠️ Stoploss ☠️🚫 - 1433
⚠️ Important: Always maintain your Risk & Reward Ratio.
✅Like and follow to never miss a new idea!✅
Disclaimer: I am not SEBI Registered Advisor. My posts are purely for training and educational purposes.
Eat🍜 Sleep😴 TradingView📈 Repeat 🔁
Happy learning with trading. Cheers!🥂

#AVANTIFEED 556 TGT 800+ #VBL #HATSUN #KRBL #ZYDUSWELL #BIKAJIAVANTIFEED 556
TGT 800+
SL 470
Return > 45%
Risk < 15%
RR ~3
Timeframe <8M
NSE:AVANTIFEED
Buy Recommended
Can hold for long term
Shared with 💚
By Rachit Sethia

Varun Beverages Ltd Trading Signal📈 **Varun Beverages Ltd Trading Signal:**
🔵 Buy above: 1051
🔴 Stop Loss @: 959

VBL--Bearish viewA strong rise is observed in this stock, after breaking the trendline.
now this stock is showing bearish pressure.
now the price is at important level of resistance, showing strong bearish pressure.
this is the right time to look for short, short side until price reach the demand zone..

VBL - Bullish Consolidation with VolumesNSE: VBL is closing with a bullish consolidation candle supported with volumes.
Today's volumes and candlestick formation indicates strong demand and stock should move to previous swing highs in the coming days.
The stock has been moving along the horizontal support for the past few days which is indicating demand.
One can look for a 8% to 13% gain on deployed capital in this swing trade.
The view is to be discarded in the event of the stock breaking previous swing low.
#NSEindia #Trading #StockMarketindia #Tradingview #SwingTrade

VBL: All set for next leg of Journey!About to breakout from top of the channel with Cup and Handle breakout.
This is going to be the second time VBL is going to breakout from a channel after its post IPO period.
Highly Bullish structure in my opinion.
Expect more consolidation and up move as this is an FMCG stock.
Good for investment. Fundamentals are great.
Do Think about R:R before entering.
Kindly boost the post if you like the content so that more people can see it.

Profit calling you.!Yesss....profit calling you....!!!
Here varun beverages found in my strategy for long build.
In last some days trading sessions this stock made W pattern.
Buy ₹1335/- and book at least 5% profit.

VBLVBL has potential to give a good move as per the chart.
Disc: Only for learning use. Not a trading Recommendation.


VBL NSE VARUN BEVERAGES BULLISHVIEW ABOVE 950VBL NSE VARUN BEVERAGES is bullish if 950 holds. New Lifetime high. New 52weekHigh. Fresh Breakout above 950.
*** Educational purpose only.
NSE:VBL

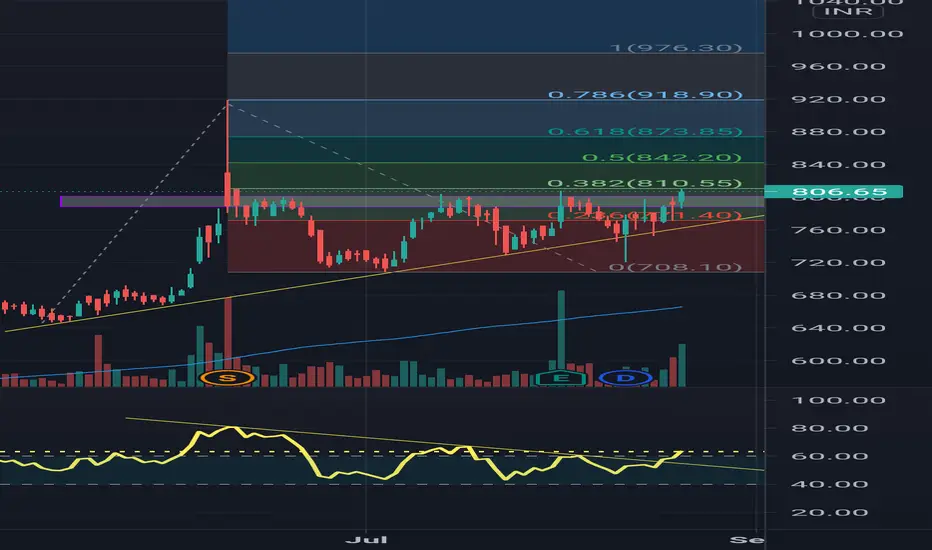
VBL is very close to a good breakoutVarun Beverages (VBL), a stock of FMCG sector has given a weekly closing above 800 for the first time after its split on 10th June 2021. The day high of '810' on Friday coincides with 38.2% golden ratio on Fib levels.
Above 811, it can easily give 1-2% targets in intraday.
A 15 minute candle closing above 810, ater 9.45 am can be a good buy for a swing trade too. Also, a trendline breakout can be seen even in the momentum indicator (RSI) which gives a double assurance for the breakout.
Vbl is ready for another leg upVrl tested its previous high as suppprt and is ready to go for ride up.
I opened a long here.

R-0130 BUY VBL @714-717 SL 682 TGT 778SHORT TERM BUY VBL @714-717 SL 682 TGT 778
Above VWAP + MACD cross over + Good volume + TK cross over so go long for short term.

VBL continues uptrend Long for profits with a SL !!!VBL is in a strong uptrend. After a fall it took support at 675 and is continuing is steep uptrend. Can go long.

VBL - VCP breakoutVBL
CMP 817
Stop 776
Target Open
Daily Chart VCP breakout observed supported with good volumes.
