NATO (VCP - 9W 13/5 3T)Doesn't has a sound fundamentals, but I like how it sets up a VCP.
This is the earliest buy point after turning into an uptrend, I like to see some interesting moves here.
VCP

CubeSmart $CUBE breakouts after VCPCubeSmart is a real estate investment trust that invests in self storage facilities. It rents spaces for individuals and businesses of all kind.
Since september the price its been forming a volatility contraction pattern (VCP) with a footprint of 13W - 13/4 - 4T. Today made the breakout with good volume and high close. But, as the market hasn't been respecting breakouts, I started small by buying just 1/3 of my position sizing. If the stock follows through, I'll add to my position.
NYSE:CUBE respects my trend template, confirmed by IBD with a 92 relative strength rating. Is also respecting the Code 33: three quarters of accelerating earnings, sales and profit margins.

Transportation leader $NSC is making new highsNorfolk Southern Corp. operates more than 19,000 miles of rail road in the U.S. With a #2 ranking in the IBD Group Leadership and a RS line rating of 84, NSC is close of making an ATH. This is a sign of very good technicals.
On the fundamental side, it had a revenues increas of 15% to $8.29B for the nine months ended 30 September 2021. Also, for the last 3 quarters reported and increase in sales and EPS.
What may drive the price up for the upcoming weeks, are the news of NYSE:NSC is collaborating with NYSE:X and NYSE:GBX to create a new and sustainable high-strength steel railcar. Is a partnership between supplier, builder, and end-user.
The company is also launching a new web site called NSites, a GIS-based search engine to help businesses easily find rail-served industrial sites and transload facilities that meet their needs.
Remeber that round numbers like $300 holds a pretty strong psychological barrier. So I'll be waiting for the breakout.

Nucor Corp $NUE, tight action might give buy signal soonThis Steel-Producer might be the percfect example of good technicals and good fundamentals.
After a good bull run from March to August is been forming a base that has been tightening from left to right, with low volume on down days and high volume on up days. That is the kind of action I like to see before a buy signal.
According to @TradeStation, for the nine months ended 02 October 2021, NucorCorporation revenues increased 76% to $26.12B. Its quarterly results reflect a good Code 33, that's three quarters of accelerating earnings, sales and margins.
My firts buy would be just above $117.86 with 1/2 of my position sizing. If the price follows through the resistance lines I marked, I'll add up.
Its IBD RS rating is 95 and has a #1 ranking in its industry.

Buy signal - VCP with UC&RWith EVTC i see two buy signals - both based on the teachings of my masters - M. Minervini and G. Morales.
First we see a VCP over the last few days (it was also on a short list from our VCPSniper). What is interesting when you look at in details is that we see a 'shakeout' (following MM rules of VCP) that for aggresive traders can be taken as UC&R (undercut and rally) from the previous low. What is even better is that this offers a very tight stop.
Lets see how this develops!

(US) DLTR Weekly Breakout Huge BaseDLTR experience breakout it huge base (1386 days) on mid Nov with solid volume.
Price experience minor pull back for 1 month and attempt to break new high ground again.
Daily chart shown to have short base VCP setup. It also shown the resistance to drop while overall market experience major drawdown.
Let's see how it act.
Disclaimer:
Not buy call recommendation, just my sharing on technical analysis based on chart pattern development. Trade at your own risk.

US stocks setting up VCPs for possible buys (Minervini template)Todays list of stock showing VCP qualities.
Trade safely! As i commented under the last video - number of names completely cancelled VCP setup by moving through the bottom range.
In this video i also share the combination of VCP with UCR (undercut rally as per Gil Morales).
Safe trading to all!

List of US stocks setting up VCPs for possible long entriesResult of our VCPSniper analysis helping us (and you) to quickly scan through 1000s of names to create a short list of actionable stocks. We always look for price tightness and trend template criteria as defined by Mark Minervini.
We publish videos couple of times a week and also add additional analysis on stock by stock basis.
The entry should be at the break of the VCP and stop loss MUST be always in place. Your entry needs to take into account your risk appetite. Do not chase stocks that gapped up! There will be another day!.

National Aluminium - VCPThe tape has formed a VCP.
Volume dry up on red days indicating supply absorption.
Tape is drifting sideways around key 21 & 50 EMA.
Missed pivot buy at 104.
Tracking this tape.
Publishing for my own reference.
Not an investment/trading advice.

a great example of successful exit from VCPThis stock was in my video from Sunday ... it is a great example of what we are looking for ... look at this clean break of the top of the VCP and holding nicely. However ... given the overall market situation - if you caught it ... maybe it is good to pocket the profits and move on ... it is a tricky market we are experiencing now.

SCNWOLF VCP SETUPSCNWOLF developing VCP with below contraction.
C1: -36%
C2: -9%
C3: -5%
During C2 and C3 contraction, volume observed contract as well. The price and volume interaction is good.
Let's see if will pull back another round and form a C4 or it will direct surge up. Prefer to pull back another round for more solid base take off.
Disclaimer:
Not a buy call recommendation. Just technical analysis sharing based on my personal experience in chart pattern study. Trade at your own risk.

GUH VCP PredictionWould like do predict GUH upcoming movement based on chart pattern analysis. Chart always our best insider. I have done this for several stocks such as CIMB, GREATECH, can see previous idea link in below.
GUH formed C1 where major correction occur due to profit taking/cut loss for those that chase high.
Price/Volume observed coming back on 24 Dec 2021 and this caught my attention and then price experience natural pull back and form C2.
Predict the movement to go for another pull back and form C3.
Then breakout C3 and surge for new high again. Let's see.
Disclaimer:
Not a buy call recommendation. Just technical analysis sharing based on my personal experience in chart pattern study. Trade at your own risk.

RESINTECH VCP AGAINI traded RESINTC back then in Oct 2021 and got profit around 25%. (Previous idea in the ink below)
RESINTC experience major profit taking from 12 Nov till 6 Dec. This form the C1.
Price and Volume return back strong on 21 Dec 2021 - this caught my attention After that price undergo natural reaction with volume contraction. (C2)
Price and volume surge again on 27 Dec. Then another round of natural reaction. (C3)
Price and volume surge again on 3 Jan 2022. Let's see if this round breakout strong or not!
Disclaimer:
Not a buy call recommendation. Just technical analysis sharing based on my personal experience in chart pattern study. Trade at your own risk.

MYEG VCP (Huge Base)Happy New Year everyone. Just got back from year end vacation.
Have been following MYEG since Nov 2021 (link below), pull back after attempt breakout. (50% of the time pull back will happened in stock market), our job is to monitor if the pull back is a healthy or unhealthy pull back.
Seem like this round is natural reaction where pull back <10% range. Price stand firm back up MA50. Entire VCP form 4 contraction below:
C1: -31%
C2: -10%
C3: -9%
C4: -4%
Awaiting strong demand come in and breakout again!
Disclaimer:
Not a buy call recommendation, technical analysis sharing based on chart pattern analysis. Trade at your own risk.

DLTR - Dollar Tree, Inc.Bought position as the stock came thru the high-volume pivot from Dec 10. The stock has been one of the strongest in the market, gapping up and out of a very long-term base on an analyst upgrade in November and having a very strong day on earnings.
Since earnings, it has digested its move very orderly and with very low volatility. It looks like it may be ready to attempt another leg higher, but since this name does not have the strong earnings numbers I usually look for, I will be aggressive with profit taking.

ZEEL VCP StructureZEEL has formed VCP characteristics.
Tight candlesticks at final contractions.
Volumes drying, less supply.
Stock is ready for an another momentum towards upside.
Only for educational purpose. Trade at your own risk.

$F / Long through a VCPScan Criteria
Does this stock meet my 8 point scan criteria? Yes
Structural Checklist
1. Can a proven price patterns be identified? Yes, a VCP
2. Is the 50D SMA trending up? Yes
3. Has price moved >20% since its last consolidation? Yes
4. Is the weekly RS above its Zero Line? Yes
5. Does price action suggest the stock is consolidating / digesting the recent price move? Yes
6. Is the price consolidation longer > 20 days? Yes
7. Has price volatility contracted from left to right? Yes
8. Has volume volatility contracted from left to right? Yes
9. Are there visible signs of demand within the base? Yes
10. Are there visible signs supply has been absorbed? Yes
Pivot Buy Point (Last 3 Bars)
1. Is there a visible Tight Zone? Yes
2. Have there been 3 Tight Closes? Yes (2)
3. Has there been a Constructive 3 Bar Correction? No
4. Is there a Bullish Inside Bar? No
AND
1. Has volume dropped dramatically? Yes
2. Can risk be managed under 8% in one of 3 ways? Yes
Other Notes
1. Note made of the the distribution day on December 16th, Supply still present above 20.50.
Scan Score (Minimum 8/8)
All Trading Dirty stocks have a Scan Score of 8
Structural Score (Minimum 7/10) 10
Entry Score (Minimum 1/4 then 2/2) 4

$FLNC Strong IPOcame across $FLNC this weekend so haven't have a chance to see it trade so not sure how spready it is but a strong looking alternate energy IPO that is acting very well.
Broke its down trending line (red dotted) and putting in a sideways cheat shelf.
looking for an inside day below supply line to give us a bit lower risk entry.

$TECK 8 Months Base on Base$TECK 8 month base on base could work right out of the gate in 2022.
Wished volume pattern is a bit more convincing with stock sitting right below $29 supply line.

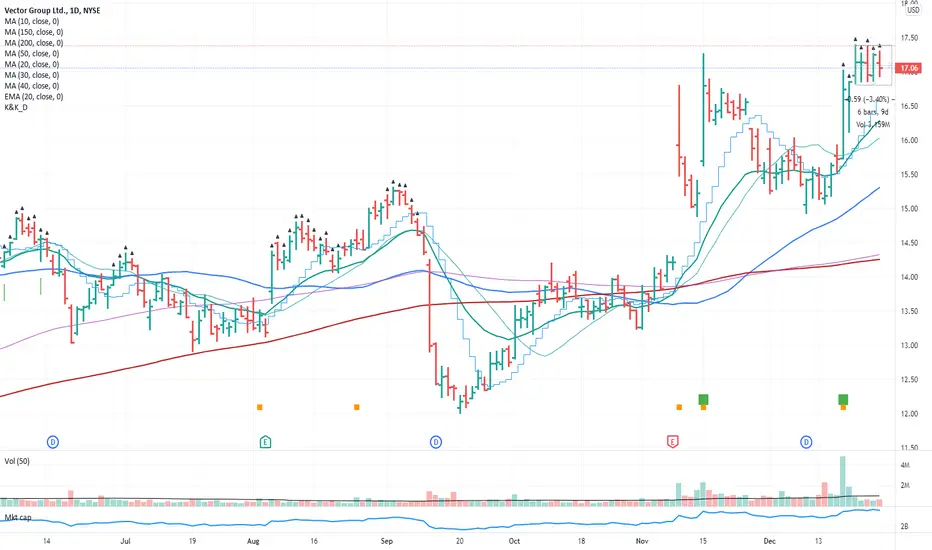
Why is it better to wait for move up out of VCP!!! <= IMPORTANT!it might be tempting to buy within VCP ... but is it still so when you look at what happened to VGR?
Once you have been caught in a move like that ... you learn very fast :)
ALWAYS apply risk management where size of your position is in line with your risk apetite!
Happy trading!

CXW - cheat entry according to M. Minervini rulesHave a look at the chart .. you clearly see the contraction in volatility for the last couple of days. A cheat entry according to Mark. I also like the volume below average and 50SMA going upwards!

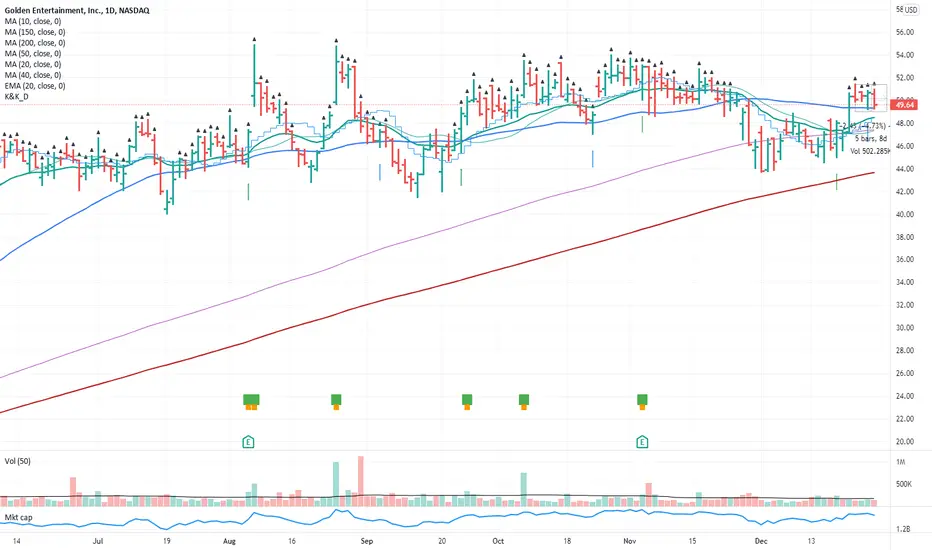
GDEN long from VCPclearly visible VCP holding just above 50SMA. Price holding in very tight range. Break of top of the range will be a entry trigger.
VCP formingthe left hand side looks a bit choppy but you can see a nice price contraction together with volume lower than average. In good market conditions - this would be a good candidate for long entry provided it would clear the 17.40 level.