Sequent ScientificComing out of a VCP or a cup and handle pattern.
Awaiting a breakout.
*****
Help Me to Help Us.
I believe in keeping the chart simple with minimal drawings & easy to interpret.
Always keep a stop loss to rescue you out of troubles.
So kindly express any disagreement & improvements so that we learn & earn together.
Please support the effort and appreciate it with a Like if you felt it deserves it and Following me would only add on to the motivation.
VCP

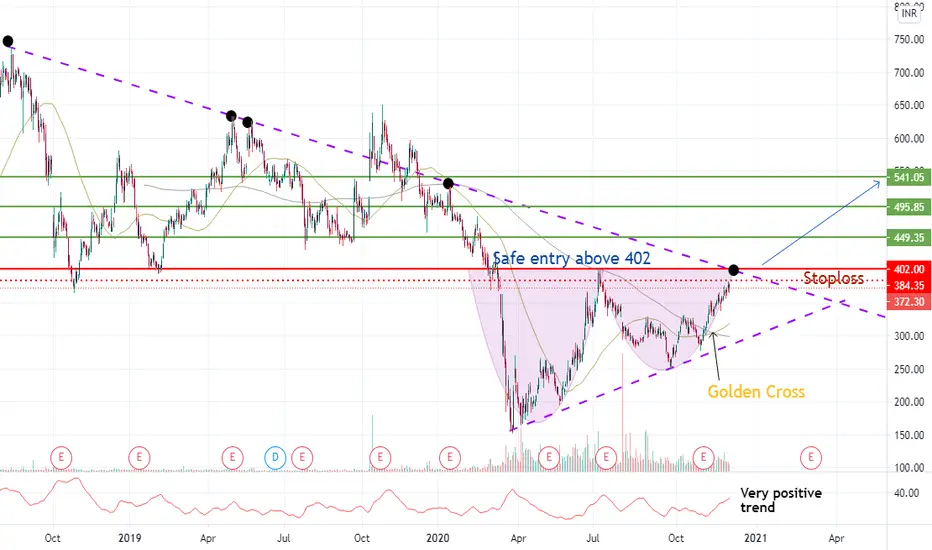
Bandhan Bank - Can it break the stiff resistance on 5th attempt?At 402 , there is a strong resistance from a long trend line.
Safe playing investors should enter only above 402 on "closing basis" for the targets in green in due course.
However, the ADX > 25 indicates a very strong trend at the moment backed by a Golden Cross recently.
So risky investors can take a chance entering at CMP- 373 for a target of 402 which is about 8% but a strict stop loss is mandatory. This 8% target might be achieved in the next few intraday sessions as well.
*****
Help Me to Help Us.
I believe in keeping the chart simple with minimal drawings & easy to interpret.
Always keep a stop loss to rescue you out of troubles.
So kindly express any disagreement & improvements so that we learn & earn together.
Please support the effort and appreciate it with a Like if you felt it deserves it and Following me would only add on to the motivation.
$PTON reversing back to ATHDowntrend reversal on Peloton
MACD Golden cross
ARKK buying on 8/12 for the first time
Low volume pullback
Gap-fill 122
H/E, might show similar patterns to $AAPL and $TSLA. Could go down to a HIGHER low before cracking ATH's again

QES VCP DevelopmentQES volatility contraction pattern has developed ~4 months since it previous peak with 4 contraction below:
C1: ~39%
C2: ~16%
C3: ~12%
C4: ~5%
The last 3 trading day shown strong support together with volume around 0.315.
QES will further attack once it break 0.325.
With 0.295 as final support, the risk ~6.5%.
In term of fundamental wise, 5 recent quarter shown profit. Not like other penny stock that rise without fundamental support.
Disclaimer: This analysis is just a sharing on volatility contraction pattern and not a buy call sharing. Trade with own risk.

MTAG VCP DevelopmentAnother stock that current with VCP development.
C1: ~40%
C2: ~16%
C3: ~6%
C4: ~6%
As VCP related to demand vs supply. Seem like supply is not that much now with volume decreasing.
Awaiting huge demand to come in and push the price up!
Will take off anytime soon.
First support: 0.720 and second support 0.705
Disclaimer: Not a buy call suggestion, trade with your own risk. Just a VCP trading sharing.

APPASIA VCP SETUPFall in love with VCP setup trading and would like to share my analysis about VCP trading.
Seems like APPASIA has undergo 3 round of contraction with each contraction smaller that previous!
C1: ~38%
C2: ~16%
C3: ~6%
I believe price will form a pivot point at current stage.
Is a good entry for 1st position.
Once it break 0.740, you can top up for 2nd position.
Support set at 0.620, ~8% risk.
Disclaimer: Not a buy call, buy at your own risk.

PFIZER Awaiting a Breakout from a Cup and Handle Pattern.
*****
Help Me to Help Us.
I believe in keeping the chart simple with minimal drawings & easy to interpret.
Always keep a stop loss to rescue you out of troubles.
So kindly express any disagreement & improvements so that we learn & earn together.
Please support the effort and appreciate it with a Like if you felt it deserves it and Following me would only add on to the motivation.

APPS Digital Turbine, Inc., through its subsidiaries, provides media and mobile communication products and solutions for mobile operators, application advertisers, device original equipment manufacturers, and other third parties worldwide. Its software platform that enables mobile operators and OEMs to control, manage, and monetize devices. The company also provides programmatic advertising and targeted media delivery services; and other products and professional services directly related to the core platform.
Corporate Governance
Earnings growth yoy: 275%
Qtly: 33%
VCP 6W 40/12 3T
Stage : 2/27/1%/52% stage 2/ 27weeks/1% from resistance/ 52% from MA

BINTAI VCP - Next Solution?BINTAI is constructing VCP that is similar to Solution VCP that i shared earlier (link below).
C1: ~33%
C2: ~23%
C3: ~9%
Current construction around 58 days. There might be a C4 that is less than 9%.
Need volume to kick in and break 0.770! Need more vaccine good news booster!
QR is coming soon, should be still a bad QR. I believe market not really care, as long as it is Vaccine related.
Support 0.670, ~6.5% risk.
Let's see.
Disclaimer: Not buy call, just sharing VCP method that i found useful for trend trading.

SCGM VCP In Progress??? Disclaimer: This is just a sharing purpose and not a buy call.
Seem like SCGM already gone through 2 contraction and 3rd contraction is in progress.
Volume also getting dryer compare to previous.
Strategy:
Waiting the 3rd contraction to develop.
Only consider to enter if the price able to stand firm back above MA50.
Enter point will be during it breakout the previous high.
Similar to previous Solution trade. Link is below.
#Patience is the key to success.

Solution VCP TradeDisclaimer: This analysis just serve for sharing purpose and not a buy call purpose.
As you can see above, solution experienced 4 contraction (C1, C2, C3 and C4).
Each contraction is getting smaller and the last contraction is less than 10%. (very important step in VCP)
Contraction less than 10% at the final contraction mean the supply in the market is less.
Whenever huge demand come it, the price will explode.
On 3rd November, price gap up and close with volume that more than previous day. I enter on 3rd Nov 2020.
With the vaccine news and our budget 2021 announced recently, vaccine counter really explode.
I have sold partially at 0.930 with 32% gain.
Bintai has the same pattern, but i pick solution due to it support by its MOU, Private Placement Announcement which seem more realistic for me.
Note:
VCP required patience to wait for the pattern fully developed.


Tight price action near resistance.What's the $PLAN? TA,
- Breakout attempted on 2/10 but failed.
- Tight price action near 63.6 level with decreasing volatility
- Earnings catalyst and the price is consolidating till the short term moving averages catch up. Seen this with a lot of growth stocks recently. So, I gave it a name : CAT20e
FA,
- Baillie Gifford 1.3%/Druckenmiller added
-Increasing margins and sales growth
-Increased guidance
-Increased enterprise spend as economy recovers
Concerns,
- Lawsuits
- Negative earnings
High risk, Swing trade only.
Buy: Above short term pivot 66.1 on increasing volume
Stop loss: $60 invalidates thesis if it crosses the wedge downwards
Max risk: 9.2%

VCP for a break out buyNASDAQ:FRG
Volatility contraction pattern along with solid fundamentals. 2052% change in revenue last quarter with a 3 years sale growth rate of 44%. I will keep this on watch for more consolidation while the market gives the green flag to come out from being cash.

GMDC - RevisedCMP 44.2
The last time I drew my lines, I had disregarded the low on 1st June of 34.2 due to which my stop loss was hit.
The revised base line in the Ascending Triangle shows that the support was was actually not breached. However, Stop loss is our best friend at nervous points. Falling is alright but to be a winner one should accept the mistake and move on with a learning.
MACD is positive at the moment with a bullish crossover.
Now , we can also see that a Golden Cross looks very likely in the coming days which would only add on to its momentum.
Fundamentally also the stock is strong.
*****
Help Me to Help Us.
I believe in keeping the chart simple with minimal drawings & easy to interpret.
So kindly express any disagreement & improvements so that we learn & earn together.
Please support the effort and appreciate it with a Like if you felt it deserves it and Following me would only add on to the motivation.

KOTAK MAHINDRA BANKAfter 5 unsuccessful attempts, finally a breakout suggests the stock is ready for a fresh rally.
The last days candle did a retest and also closed well above which indicates strength.
Enter on any dips if available.
*****
Help Me to Help Us.
I believe in keeping the chart simple with minimal drawings & easy to interpret.
So kindly express any disagreement & improvements so that we learn & earn together.
Please support the effort and appreciate it with a Like if you felt it deserves it and Following me would only add on to the motivation.

SUVEN LIFE SCIENCES - AttractiveA VCP on display.
A breakout with volume and re-test done at the resistance turned support.
All the ingredients for a good rally unless something really unfortunate happens.
28% available here with very low risk.
RSI poised for a good momentum.

APEX FROZEN FOODS - Wait for breakoutCMP 266
A 3 VCP has been formed and is trading at the resistance.
It is also within the 'Ascending Triangle' .
A GoldenCross is also being awaited soon.
On the upside the potential of gains is good at 19.5% and 28% above the resistance of 330.
*****
Help Me to Help Us.
I believe in keeping the chart simple with minimal drawings & easy to interpret.
So kindly express any disagreement & improvements so that we learn & earn together.
Please support the effort and appreciate it with a Like if you felt it deserves it and Following me would only add on to the confidence.

INVERSE HnS + BREAKOUTMYX:KGB
FIFT +VE
ATOM GREEN
STOCHASTIC CROSS UP
TURTLE EMA UP TREND
VOLATILITY CONTRACTION PATTERN
BREAKOUT TREND LINE
EP: 1.17
SL: 1.06 BELOW
TP: LIMIT UP IS THE LIMIT
RECENTLY MALAYSIA MARKET ARE WAY TOO CRAZY
USE FIBONACCI TO ESTIMATE TP
ANYONE INTERESTED ON TURTLE TRADING SYSTEM PLEASE REFER MY MENTOR @KGIAP123


