VeChain with currently 10.000% chanceHello everyone,
please see my current idea on VeChain, where my counts suggests a minimum target of around 1.2 $. This is due to the fact that wave 3 is similar length as wave 1 on log scale. Based on this knowledge I assume that the ''real'' bullish impulse is just getting started.
Let me know your thoughts.
This is no financial advice, just my technical view.
RT
Vechain

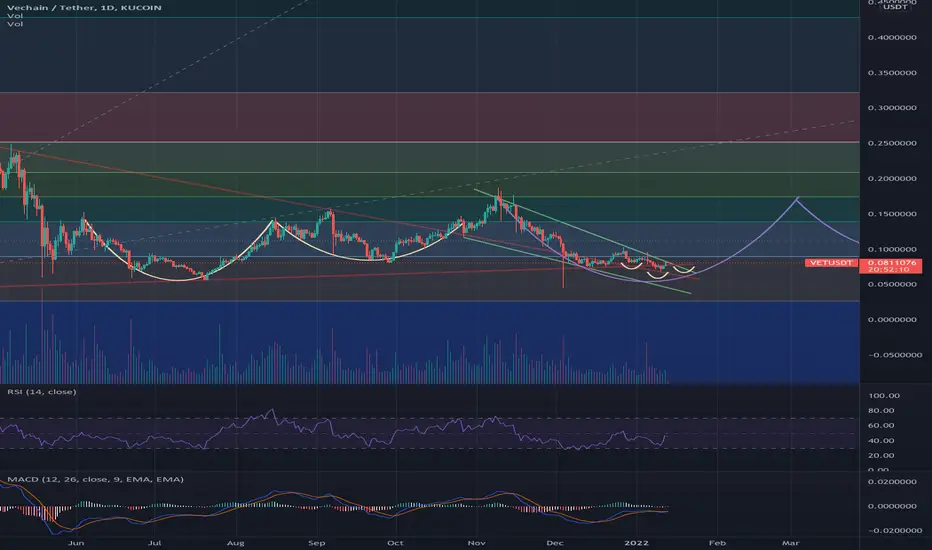
VeChain at a discount?Honest don't have much to say about Vechain, other than the fact that it has had a mojor drop in the past couple of months. Personally I think if price hits the final support and doesn't break it, I'll buy some VeChain myself.
(NOT FINANCIAL ADVICE, DO YOUR OWN RESEARCH)


VETBTCWe can see couple of coins which looks bullish. That is one the reason why I think that market will not go more down.
On of them is VET.
I think that we will see break here.
LBL_CZ


Vechain Possible Bounce/Double BottomVechain has been moving within this triangle for a long time now and is almost reaching its apex.
We can see that its sitting on strong support on the bottom of the triangle and is looking good for a bounce here.
It also looks like a possible double bottom scenario.
However if we do not hold the white line, vechain could possibly fall lower to the 5.6 cents area, and if that doesnt hold I'll be looking at around 3.6 cents for support.

VETUSD LONG TERM UPDATEVETUSD is still bullish. Wave 4 consolidation in play. I expect it to hit $1 as long as wave 4 doesn't overlap end of wave 1 (0.022).
VETBTC and VETETH charts are at their lows. This favors VET technically.
Be ready to hold as it may take TIME.
Not financial advice. DYOR!

VET (Updates)VET been moving real slow, being drag down by BTC. Unable to climb back and continue the Apex trendline. Next key support down for VET will be 0.06072 (Blue line). On the RSI VET failed to hold 45.48 which is the key support on the weekly timeframe. RSI reaching oversold. Bearish cross on the macd.
VET 8H

VET/USD - updateVET an in-depth 1day chart analysis:
If you look at my previous 3 VET charts and press play, you can see that VET has dropped out of its Symmetrical Triangle Pattern on the 1d timeframe.
VET is still below its Bollinger Bands Middle Band Basis 20 Period SMA for this 1d timeframe. Not that the Middle Band is moving downwards and so is the Upper and Lower Bands.
VET is testing its Descending Pitchfork Pattern Median Line, if VET drops below this line the we can expect VET to drop to $0.068 again.
Note that VET is still above its Least Squares Moving Average (LSMA) level at the moment. The LSMA Level is near the Pitchfork Median Line so if VET drops below the Pitchfork Median Line then it may also drop below the LSMA as this area is a crucial support. Note that if VET CLOSES a daily candle BELOW the LSMA then that will be considered a sell signal on this 1d timeframe for this indicator.
Note that VET is also in a Descending Triangle Pattern on this 1d timeframe. Note that a Descending triangle Pattern is a potentially a Bearish Pattern.
For your viewing pleasure i have added various Support and Resistance Lines as well as a few Support and Resistance Areas.
Volume is still very low on this Binance 1d chart and note that VET has not closed a daily Volume Bar above its Volume 20 Period Moving Average since the 10th Jan and note that that Volume Bar closed n the red.
VET is fighting to stay above its Volume Profile Fixed Range Point of Control (VPVR POC) for the Fixed Range of 8x daily candle s that i have selected.
VET is also under its Volume Profile Visible Range Point of Control (VPVR POC) for this charts Visible Range.
If we look at the Average Directional Index (ADX DI) we can see that Negative Momentum has increased with the -D (Red Line) rising to 17.64 and Positive Momentum has decreased with the +DI (Green Line) dropping to 13.96. Not that the Trend Strength is very weak with the ADX (Orange Line) at 15.21 and still under its 9 Period EMA (White Line) which is at 17.73. Note that the ADX (Orange Line) is still under the 20 Threshold.
If we look at the Stochastic Indicator (STOCH) we can see that Momentum is downwards at the moment and note that the %K (Blue Line) is still below its %D (Orange Line) on this 1d timeframe. If VET drops below its Pitchfork Median Line and LSMA then we will see the %K (Blue Line) enter back into the Oversold Zone agin on this 1d timeframe.
If we look at the Moving Average Convergence Divergence (MACD) we can see that the MACD Line (Blue Line) is indicating momentum is sideways for this indicator and note that the MACD Line (Blue Line) is still above its Signal Line (Orange Line). Note that Upwards momentum has weakened because today’s MACD Histogram Bar has decreased in size and has lightened. Note that the MACD Line (Blue Lien) is still in the Negative Zone under the 0.0 Base Line and has not been in the Positive Zone above the 0.0 Base Line since the 21st Nov 2021.
If we look at the Chaikin Money Flow (CMF) we can see that the CMF (Green Line) is still under the 0.0 Base Line in the Distribution Zone. However the CMF (Green Line) is pointing upwards indicating that Accumulation is increasing and this is confirmed by the CMF (Green Line) being above its Least Squares Moving Average (LSMA) (Cyan Line) which is a sign of accumulation strength. For accumulation strength to be sustainable, we need the CMF (Green Line) to eventually cross back above the 0.0 Base Line back into the Accumulation Zone on this 1d timeframe.
At the moment VET is fully under the control of BTC and in what direction BTC goes in. As you can clearly see from this Binance daily chart, Volume is still very VERY LOW for VET as well as for the overall crypto market in general. As we can see, the Market Makers are focusing on other select cryptos at the moment like ADA, but that rise is also being slowed because of BTC’s drop and control of the market. Overall there seems to be a lack of Market Maker Liquidity being traded at the moment.
There is a lot of talk about VET rising BUT any rise NEEDS to be backed up by INCREASING LARGE VOLUME to remain sustainable for the longterm. I would not get excited until Volume Increased and VET crosses above and more importantly CLOSES a daily candle ABOVE the Bollinger Bands Middle Band Basis 20 Period SMA and successfully ret-test it as support on this 1d timeframe. So overall there may be some more really good opportunities to acquire more VET at a much cheaper price.
I hope this is helpful with your Trading and Hodl-ng.
NOTES:
LSMA = Yellow Squiggly Line on chart
Bollinger Bands = Grey Bands on Chart
VPFR POC = Short Horizontal White Dashed Line on Chart
VPVR POC = Long Horizontal White Dashed Line on Chart
Support and Resistance Areas = Parallel White Lines with Yellow Shading on Chart
Volume Bars = Red and Green Bars bottom on Chart
Volume MA = Orange Line going through Volume Bars on Chart
Pitchfork Median Line = Long Descending Thin White Dashed Line on Chart

Vechain primed for a run!!Today we are looking at Vechain on the daily timeframe and one thing is pretty clear... we are ready and looking for a run to the upside, VET has seen a steep decline in price since mid November but that doesn't change the absolute brilliance and expanding business of this project! I am personally looking to pick up some more Vechain adding to my current bag around our current price and also if we see a little bit further of a drop. I have drawn out a buy zone that i am personally looking at, from where we are right now to the bottom 0 FIB level at just about 7 cents USD (0.0069). Looking at the BJ Key levels we are currently coming down turning a couple key levels back to resistance but more of what i looking at is the level directly above the 0 FIB, this represents strong key support and gives us a likely chance to see a nice bounce and reversal. Checking out the MACD we are looking okay but not very bullish as of right now, the histogram has had a tiny green cycle but is now on the way back down to the midline, now we could either see a push into a red cycle or we can likely see a bounce and another green cycle, what we want to see is an increase in green bars day by day showing a rise in bullish momentum, the blue MA is trailing back towards the orange where we could either be looking at a bearish cross or a fakeout and bounce, think we are very likely to see a bounce sooner than later due to the current downside we are facing! Checking out the RSI we are looking at a potential bounce here aswell, we are currently sitting right on the yellow simple moving average coming in for support for us and this spot also gives us an opportunity for a bounce, the main goal here is to make our way upto that midline and ultimately reclaim it, this is the most important step because it allows us to reclaim a confirmed uptrend, being stuck below the midline keeps us in a confirmed downtrend and being above and holding it puts us back into a confirmed uptrend! Not financial advice just my opinion!

VeChain (VET) - January 15Hello?
Welcome, traders.
If you "follow", you can always get new information quickly.
Please also click "Like".
Have a nice day.
-------------------------------------
(VETUSD 1W chart)
Above the 0.03981204 point: the uptrend expected to continue
Above 0.08458101 point: Expected to create a new wave.
We need to see if we can move above the 0.08458101 point along the uptrend line.
If it continues to fall, it could fall near the 0.03981204 point, so you need to trade cautiously.
At this point, it must move above the 0.10127644 point to turn into an uptrend.
To continue the uptrend, you need to break out of the downtrend line.
-------------------------------------
(VETBTC 1W chart)
Above 158 Satoshi point: Expected to create a new wave.
A volume profile section is being formed over the 158 Satoshi-260 Satoshi section.
As such, it is important to be able to sustain the price above the 221 point.
------------------------------------------
We recommend that you trade with your average unit price.
This is because, if the price is below your average unit price, whether the price trend is in an upward trend or a downward trend, there is a high possibility that you will not be able to get a big profit due to the psychological burden.
The center of all trading starts with the average unit price at which you start trading.
If you ignore this, you may be trading in the wrong direction.
Therefore, it is important to find a way to lower the average unit price and adjust the proportion of the investment, ultimately allowing the funds corresponding to the profits to be able to regenerate themselves.
------------------------------------------------------------ -------------------------------------------
** All indicators are lagging indicators.
Therefore, it is important to be aware that the indicator will move accordingly as price and volume move.
However, for the sake of convenience, we are talking in reverse for the interpretation of the indicator.
** The MRHAB-O and MRHAB-B indicators used in the chart are indicators of our channel that have not been released yet.
(Since it was not disclosed, you can use this chart without any restrictions by sharing this chart and copying and pasting the indicators.)
** The wRSI_SR indicator is an indicator created by adding settings and options to the existing Stochastic RSI indicator.
Therefore, the interpretation is the same as the traditional Stochastic RSI indicator. (K, D line -> R, S line)
** The OBV indicator was re-created by applying a formula to the DepthHouse Trading indicator, an indicator disclosed by oh92. (Thanks for this.)
** Support or resistance is based on the closing price of the 1D chart.
** All descriptions are for reference only and do not guarantee a profit or loss in investment.
(Short-term Stop Loss can be said to be a point where profit and loss can be preserved or additional entry can be made through split trading. It is a short-term investment perspective.)
---------------------------------

$VET H/S Forming to begin right wall of cup (followed by handle)*THIS IS NOT FINANCiAL ADVICE*
Overall, I am bullish for VET's 2022.
If you take into consideration their niche, and their current partnerships, you'd be bullish on VET also...
If we take the April - May '21 run-up to the .20 cent range, we can consider the top there to be the .786 fib line on a larger scale.
Otherwise, on a smaller scale, it is the .236 "top" fib line but we currently sit under the .786 which acts as resistance.
If you zoom in, you can see the potential formation of an inverse Head and Shoulders which could act as a retest for the green upper trend line.
If it flips it for support, expect a retest / completion of the 2nd shoulder + the starting of the cup wall up to the .618 and .5 fib lines.
If the .5 fib line is flipped when finishing the handle I do not expect much resistance at .382 line... but if there is, expect the handle to be formed.
Or, it could just be a hell of a year for Vechain itself, and none of these lines matter, and we go to $1 and beyond with ease 🤷🏻♂️
VeChain - My Trading Plan in 3 mins!Hello everyone, if you like the idea, do not forget to support with a like and follow.
Here is the top-down analysis for VET, feel free to request any pair/instrument or ask any questions in the comment section below.
Best of luck!

VETUSD Long from potential bullish dragonVechain is showing selling exhaustion on the daily and 4hr with triple classic divergence on the MACD and the RSI. In addition, there is a potential bullish dragon pattern with a double bottom at the $0.077 to $0.072 area. Looking for a 70%-100% gain with a potential 15% stop loss.
Entry: $0.0773
Stop loss: $0.065
1st Target: $0.127
2nd Target $0.141
3rd target: $0.18

vet coin don't miss this coinvet in buying zone don't miss this time vet 200% profit opportunity
look this idea carefully

vechain -- vetusdtWe are seeing that vechain has broke a strong resistance line 0.0816 .
In my opinion It will reach the white rectangle area which might be consider as strong buying zone. The the priced may deflect toward the previous summit (0.1875). However, it is following our precious bitcoin.

i was wrong but had a back up plan! #VETSo, i missed completely, but i had a backup plan. Had buy orders till 0.786 lvl
all filled up.
And now this is the plan.
Stop loss is at 0,0802

Vechain #VET. Multi-Month Schiff PitchforkBINANCE:VETUSD
After several months of the descending pitchfork, VET broke out and the pitchfork became resistance as seen in early December. I've been holding VET since 2018 and I'm not actively trading it. I will buy more when it follows the resistance line into Zone 2 with a take profit in Zone 1. I will consider this idea invalidated if it breaks below Zone 2 and continues down the multi-month pitchfork as resistance. I'm not a pro and nobody should trade off of my ideas. Just verbalizing it for commentary and criticism to learn.
If it breaks above Zone 1, 1) I will be happy for my long-term bags, 2) Will revisit this chart.

Decentraland 1D TA : 01.07.22 : $MANAAll supports and resistances are marked on the chart. As we can see, the price is in an important range and recommended to keep an eye on it ...
Follow our other analysis & Feel free to ask any questions you have, we are here to help.
⚠️ This Analysis will be updated ...
👤 Arman Shaban : @ArmanShabanTrading
📅 07.Jan.22
⚠️(DYOR)
❤️ If you apperciate my work , Please like and comment , It Keeps me motivated to do better ❤️

Fantom Daily TA : 01.07.22 : $FTMAs you can see, the price has pullback to the broken level of of its resistance, and if it stabilizes, we can expect further price growth up to the previous ATH.
All supports and resistances are marked on the chart. As we can see, the price is in an important range and recommended to keep an eye on it ...
Follow our other analysis & Feel free to ask any questions you have, we are here to help.
⚠️ This Analysis will be updated ...
👤 Arman Shaban : @ArmanShabanTrading
📅 07.Jan.22
⚠️(DYOR)
❤️ If you apperciate my work , Please like and comment , It Keeps me motivated to do better ❤️

Bitcoin Short 6H TA : 01.07.22 : $BTCLast analysis is still valid... All short-term targets reached ...
As we expected, the price break the trading range from the bottom and also lost its important dynamic support. Currently, the first very important support and bearish target is the (Swing Low) price, which is in the range of $ 42,000. Up to $ 42300, if this critical level is broken the next downside targets will be $ 40 ,000, $ 38,600 and $ 37,700 and if all 3 of these support will be lost , the Potential Reversal Zone (PRZ) could be the of 35,500 $ range ... (This analysis will be updated)
Follow our other analysis & Feel free to ask any questions you have, we are here to help.
⚠️ This Analysis will be updated ...
👤 Arman Shaban : @ArmanShabanTrading
📅 06.Jan.22
⚠️(DYOR)
❤️ If you apperciate my work , Please like and comment , It Keeps me motivated to do better ❤️

Will this become a crypto VET?Like many alts, VET has faced a strong pullback from its ATH in April dropping by >70% (never buy at an ATH). Since then, it has been trading within this weak triangle on the 4-day timeframe. VET seems to have found shallow ascending support along the black line and could make its way toward the upper resistance over the next few weeks.
The support looks strong but the main question is, will the support hold even if BTC drops to ~41/42k? Remember, any candle close below the black line means the idea is cancelled. For now, it is still trading above its 200 day EMA and is testing its 100 day EMA. I think it can move up.
Please note I am not a financial advisor and this is not financial advice. All ideas are for educational purposes only :)
Please feel free to leave your comments, questions and thoughts below!

Vechain ready for a run!!?Vechains daily candle today is rising fast and currently sitting around a +10%, we are looking very bullish if this price action continues and we could be seeing the beginning of a breakout for VET! We are currently trading inside of a bullish triangle where the chances of us breaking out to the upside is likely, especially when you look at our current spot in price, we are sitting above the pivot point where if we can close above could send price action flying upwards likely shredding through multiple major levels on the way. As far as resistance goes we are looking at the pivot point we are currently above and then the top of this bulllish triangle, the 0.6 FIB level and then the R1 resistance apart of the pivot points! for our support we have quite the cushion underneath us we are looking at the midline on the bollinger bands (if we close above today) uptrend support coming from the bottom of our triangle, support at 0.08 cents, and support at 0.069 cents! Looking at our bollinger bands we notice that price action is sitting right below the top band, if we can make the push today to close ontop of here we could be looking at a big run to the upside, even if we take a couple days to do so a close ontop of this top band is going to be very bullish! Our MACD looks good we seem to be starting another bullish run here, the histogram came way down but todays green bar is significantly bigger than yesterdays, showing us a rise in the bullish momentum, and if we can continue this on day after day then we are looking at another bullish cycle. The MA's are a little bit squeezed together which we would like to see that separation, but the blue MA is starting to bounce and seems to be reversing and ticking back to the upside, this is exactly what we want to see here and ultimately continuing this on creating that big separation making it more difficult to trigger a bearish cross! NFA just my opinion!
