💡Don't miss the great buy opportunity in VETUSDTrading suggestion:
". There is a possibility of temporary retracement to the suggested support line (0.08887).
. if so, traders can set orders based on Price Action and expect to reach short-term targets."
Technical analysis:
. VETUSD is in an uptrend, and the continuation of the uptrend is expected.
. The price is below the 21-Day WEMA, which acts as a dynamic resistance.
. The RSI is at 59.
Take Profits:
TP1= @ 0.09407
TP2= @ 0.09990
TP3= @ 0.11053
TP4= @ 0.11929
TP5= @ 0.12825
SL= Break below S2
❤️ If you find this helpful and want more FREE forecasts in TradingView
. . . . . Please show your support back,
. . . . . . . . Hit the 👍 LIKE button,
. . . . . . . . . . Drop some feedback below in the comment!
❤️ Your support is very much 🙏 appreciated!❤️
💎 Want us to help you become a better Forex / Crypto trader?
Now, It's your turn!
Be sure to leave a comment; let us know how you see this opportunity and forecast.
Trade well, ❤️
ForecastCity English Support Team ❤️
Vechain

💡Don't miss the great buy opportunity in VETUSDTrading suggestion:
". There is a possibility of temporary retracement to the suggested support line (0.08887).
. if so, traders can set orders based on Price Action and expect to reach short-term targets."
Technical analysis:
. VETUSD is in an uptrend, and the continuation of the uptrend is expected.
. The price is below the 21-Day WEMA, which acts as a dynamic resistance.
. The RSI is at 58.
Take Profits:
TP1= @ 0.09407
TP2= @ 0.09990
TP3= @ 0.11053
TP4= @ 0.11929
TP5= @ 0.12825
SL= Break below S2
❤️ If you find this helpful and want more FREE forecasts in TradingView
. . . . . Please show your support back,
. . . . . . . . Hit the 👍 LIKE button,
. . . . . . . . . . Drop some feedback below in the comment!
❤️ Your support is very much 🙏 appreciated!❤️
💎 Want us to help you become a better Forex / Crypto trader?
Now, It's your turn!
Be sure to leave a comment; let us know how you see this opportunity and forecast.
Trade well, ❤️
ForecastCity English Support Team ❤️

VET - VECHAIN; PT 2; see pt1 success, the final stageVET - VECHAIN; PT 2; see pt1 success, the final stage
The final acts are near. Prepare yourself.
See part 1. I am refining this one a lil, reducing top options a bit.
Good luck on the EXIT
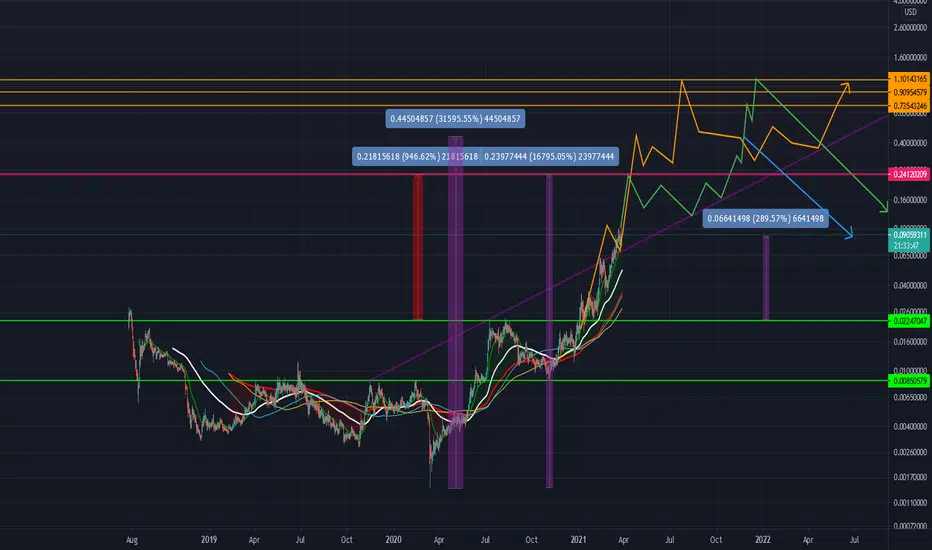
VeChain / USD Fibonacci Analasys 🎯I HAVE TWO SENARIO FOR ALMOST NEXT YEAR
The targets is bullish, but at different times we will see the influx of buyers near the new year, So which is indicated in the chart.
Please share your opinion with me in the comments. 🙏✌

VeChain (VET) - September 27Hello?
Welcome, traders.
By "following", you can always get new information quickly.
Please also click "Like".
Have a nice day.
-------------------------------------
(VETUSD 1W Chart) - Medium to Long-Term Perspective
Above the 0.03981204 point: the uptrend is sustainable.
Above 0.06265984 point: Expected to create a new wave.
(1D chart)
First support section: 0.06265984-0.08458101
Second support section: near point 0.03981204
First resistance section: 0.12610267-0.14187200
Second resistance section: 0.20955073-0.22890460
A move to break above the first resistance zone should be checked to see if there is a sideways movement within the support zone.
In particular, you should see if the volatility around September 28 (September 27-29) is moving upwards above the 0.09110688 point to break out of the downtrend line.
--------------------------------------
(VETBTC 1W Chart) - Mid to Long-Term Perspective
Above the 136 Satoshi-158 Satoshi section: The upward trend is sustainable.
(1D chart)
First support section: 177 Satoshi-193 Satoshi section
Second support section: 136 Satoshi-158 Satoshi section
It is necessary to check whether it can rise above the volume profile section formed near the 221 Satoshi point.
Therefore, it is necessary to check whether the price is maintained above the 221 satoshi-237 satoshi section.
------------------------------------------
We recommend that you trade with your average unit price.
This is because, if the price is below your average unit price, whether it is in an uptrend or in a downtrend, there is a high possibility that you will not be able to get a big profit due to the psychological burden.
The center of all trading starts with the average unit price at which you start trading.
If you ignore this, you may be trading in the wrong direction.
Therefore, it is important to find a way to lower the average unit price and adjust the proportion of the investment, ultimately allowing the funds corresponding to the profits to regenerate themselves.
------------------------------------------------------------ -----------------------------------------------------
** All indicators are lagging indicators.
Therefore, it is important to be aware that the indicator moves accordingly with the movement of price and volume.
However, for the sake of convenience, we are talking in reverse for the interpretation of the indicator.
** The MRHAB-O and MRHAB-B indicators used in the chart are indicators of our channel that have not been released yet.
(Since it was not disclosed, you can use this chart without any restrictions by sharing this chart and copying and pasting the indicators.)
** The wRSI_SR indicator is an indicator created by adding settings and options to the existing Stochastic RSI indicator.
Therefore, the interpretation is the same as the traditional Stochastic RSI indicator. (K, D line -> R, S line)
** The OBV indicator was re-created by applying a formula to the DepthHouse Trading indicator, an indicator disclosed by oh92. (Thanks for this.)
** Support or resistance is based on the closing price of the 1D chart.
** All descriptions are for reference only and do not guarantee a profit or loss in investment.
(Short-term Stop Loss can be said to be a point where profit and loss can be preserved or additional entry can be made through split trading. It is a short-term investment perspective.)

VeChain - still in its Symmetrical TriangleVeChain is still within its massive Symmetrical Triangle on this 1d timeframe.
Note that VET is still ABOVE its Longterm Upwards trend-line.
Note that VET is back ABOVE its Least Squares Moving Average (LSMA) on this 1d timeframe.
VET is still below its Bollinger Bands Middle Band Basis 20 Period SMA. Note that the Lower Band is moving upwards indicating weakening volatility and a possible Bollinger Bands Squeeze/Pinch.
Volume on Binance has decreased and note that the last 4 Volume Bars have been below its Volume 20 Period Moving Average.
VET is back above its Volume Profile Fixed Range Point of Control (VPFR POC) for the fixed range of 4 daily candles that i have selected.
VET is still below its Volume Profile Visible Range Point of Control (VPVR POC) for this charts visible range.
If we look at the On Balance Volume (OBV) the OBV (Blue Line) has increased but note that it is still under its 9 Period EMA (Orange Line). If you are waiting for confirmation of renewed upwards momentum STRENGTH then you need the OBV (Blue Line) to cross back above the 9 Period EMA (Orange Line) and stay above it.
The Average Directional Index (ADX DI) is indicating the trend strength has increased with the ADX (Orange Line) at 32.49 and ABOVE its 9 Period EMA (Black Line) which is at 30.46. The -DI (Red Line) has increased to 26.70 and the +DI (Green Line) has dropped to 10.52. This tells me that Negative Momentum has increased and Positive Momentum has decreased on this 1d timeframe.
The Moving Average Convergence Divergence (MACD) is indicating VET still has a very long way to go on this 1d timeframe before we see the MACD Line (Blue Line) cross back over the Signal Line (Orange Line). Note that we do have lessoning Histograms but note that the MACD Line (Blue Line) is still under the 0.0 Base Line and it is still in the Negative Zone.
The ascending trend-Line of the Symmetrical Triangle is a major support level. If VET ends up dropping more, a good spot to buy extra VET would be around $0.076 - $0.069. I wouldn’t get excited until VET crosses and closes a daily candle back ABOVE the Descending trend-line of the Symmetrical Triangle and turns it into strong support. Also, be on the lookout for when the OBV (Blue Line) crosses back above the 9 Period EMA (Orange Line) as well as a CLOSE back ABOVE the Bollinger Bands Middle Band Basis on this 1d timeframe.
Here is a closer look at this 1d chart.
I hope this is helpful with your trading and hodl-ing.
Notes:
Symmetrical Triangle = Black Lines on Chart
Longterm Upwards Trend-line = Dashed Line on chart
LSMA = Black Squiggly Line on Chart
Bollinger Bands = Grey Bands on Chart
VPVR POC = Long Horizontal Red Line on Chart
VPFR POC = Short Horizontal red Line on Chart
Volume = Red and Green Bars bottom of Chart.
Volume MA = Orange Line going through Volume Bars bottom of Chart.

$VET at resistance#VeChain is facing heavy R after the latest bounce.
As you can see in the chart, the 200D EMA and year long trendline resistance is holding it down here.
Caution is needed here too.

Vechain(VET) Update 23/09/21: Road back to ATHVechain is currently fighting some heavy resistance at the 23.60% Fibonacci level. From here we can expect a break above this level, and if the bullish momentum continues we could see VET pushing past the 38.20% fibonacci level @ $0.14 (42% Gain from the current price level) . Due to the bear trap in the market we have seen all ALTS make a similar corrective chart pattern, we can expect the recovery to be a quick as the flash crash experienced during this week. Please see previous analysis below. Happy Trading :)
Vechain(VET) Update: 220% Gain from Buy Zone..Next Stop $0.28. Vechain has tested the 200SMA and broke above showing strong signs of bullish momentum. There is potential 220% Gain from Buy Zone @ 23.60% Fibs to the ATH @ $0.28. Vechain is 62% up from the Buy signal triggered by the swing call script. From here we may have a small cool off period as VET is currently fighting some resistance at the 38.20% Fibonacci level. So far VET has gained +115% over the past 30 days and +45% over the past 7 days, we can expect continued momentum as the alts continue to slowly wake up and rise. Please see previous analysis below. Happy Trading :)
Vechain(VET) Update 07/ 05 /21: 40% Gain from current price level to 127.20 Fibonacci extension @ $0.33. See previous analysis below
Vechain(VET) Update 27/04/21: 228% Gained from our Buy Zone 4 from the 4th April to 16th April...Next Stop $0.33 from Buy Zone 5 which is an 81% Gain from 50.0% Fibonacci retracement level. Lets take advantage of the current prices as we will not be seeing these low prices for a long period of time once the Bulls are back in the market for the next push phase. Use the Buy Zones to map your Buys or simply for dollar cost averaging. The Fundamentals are great for this project and we are very bullish on Vechain and can see EOY price target between $2 to $5. See previous analysis below. Happy Trading :)
Vechain(VET) Update 05 /04/21: VET perfect bounce from Buy Zone 4 37% Gain to $0.11. See previous analysis below.
Update 30/03/21
Vechain(VET) looks ready for another 37% Gain to $0.11. Since the 27th March Vechain has been consolidating between $0.087 & $0.097 range. Stochastics are now showing an oversold market and VET looks ready for continued Bullish momentum to the upside. Be patient with your entry as we expect VET to test the 78.60% Fibonacci level before confirmation of a move towards our target at the 127.20% Fibonacci level @ $0.11. Failure to test the 78.60% Fibonacci would see a 12% Gain from the current level to the previos ATH tested on the 22nd March @ $0.10.
Use the Buy Zone ($0.088) to map your entry if you are not already riding the current wave, from here you can DCA to accumulate more coins, 37% Gain to our $0.11 price target.
See previous analysis below. Happy Trading :)
$VET #Hodl
Update 23/03/21
Vechain(VET) looks ready for another 46% Gain to $0.11 at the 127.20% Fibonacci level. Stochastics on 4H showing an oversold market at this price level. On 22 March VET reached $0.10 on the Binance exchange. Since reaching this price level, the price broke below the 13 EMA and 50 SMA as the profit takers came into the market after 21 days of this strong bullish continuation pattern. Although we have broke below both 13 EMA and 50 SMA , overall VET is still bullish and we can expect a bounce from the price pushing above the 50 SMA but be patient as they may be more profit takers in the market. There is a high probability the Bulls will take back control and continue to keep pushing the price higher. Currently VET is showing signs of a weak retracement just below the 78.60 Fibonacci level. Use Buy Zone 3 to map out your Buys from here and if the 13 EMA crosses below the 50 SMA , we will be looking to DCA and Accumulate between the 61.80% to 50% Fibonacci level. From the 61.80% Fibonacci level we expect a 57% Gain to the 127.20% Fibonacci level, this would be the worst case scenario if we get a stronger retracement. See below previous analysis of a new ATH target @ $0.14 as this is the best case scenario from here. Happy Trading :)
Vechain Monthly Outlook Update 23/03/2021
Vechain(VET) Explosive Move New ATH Target, 62% Gain to $0.14, we are very confident this new price target will be reached over the next coming days/week(s). Stochastics showing an oversold market on the 4h
*Update Vechain Outlook 20/03/21*
Vechain is still on course to our 127.20% Fibonacci level, beautiful continuation pattern. Some great Buy Zones to DCA in this channel. New Target @ 161.80 Fibonacci, lets ride this wave to $0.11, 24% Gain from current price level.
Vechain dropped into the perfect Buy Zone zone to enter if you’re not yet in or want to dollar cost average if you’re already riding the current wave. Happy Trading :) See previous analysis below.
*Update Vechain Outlook 18/03/21*
Road to $0.10 is clear, we are still in a strong continuation pattern in search of new ATH at the 127.20% Fibonacci level in the short term. Use Buy Zone 3 to set up your buys, perfect sniper entry would be at the 78.60% Fibs (33% Gain to 127.20 Fibs). Watch for price action as we may see a small retracement down to test the 50 SMA just below the 78.60% Fibs before pushing to the upside towards the $0.08 price level and further $0.10 (40% Gain to 127.20% Fibs).
*13/03/21*
Vechain's price soared to a new ATH on 12/02/21 reaching $0.606 on the Binance exchange. Following the new ATH there was a small retracement before trying to push past the resistance set at ATH , but this failed to break on 19/02/21 and was met with huge selling pressure at these price levels, retracing down further, quite sharply after 4 days on 23/02/21 touching the 50 SMA on the daily chart with a low of $ 0.0341. The downward pressure was met with a sharp bounce on the 50 SMA recovering in a day 24/02/21 back to the 38.20% Fib retracement level showing strong signs of Bulls still in the market. As of the past 3 days the price has been consolidating between a small range between the 38.20% Fibonacci retracement levels and 23.60%. Further to note the price on 2 occasions has tested to break below the 50 SMA failing twice signalling strong bullish pressure and signs of the Bulls to continue driving the current price to test the ATH yet again whilst also setting the sentiment of a possible new ATH at the 127.20% Fibonacci retracement level @ $0.0702.
Furthermore the 200 SMA has been tested at 3 occasions on the 4H Chart, failing to break past this level. Vechain is in a perfect zone for Buys back towards the ATH . Stochastics on the Daily chart signal an extremely oversold market so expect Vet to push back 55% back to ATH levels and Further 74% to 127.20% Fibonacci with the potential to set a new ATH in the coming days to weeks in March.
The Fundamentals are great for this project and we are very bullish and can see EOY price target between $2 to $5. Buy Zone 1 @ 23.60% Fibonacci retracement level for the perfect sniper entry. Be patient, wait for confirmation before entering any buy. Happy Trading :)

Accumulate Leverage tokens before they put a limit!Not if, but when... Vet hits .50 this can easily hit $7-$10

Vechain The Road Ahead!since the beginning the channels below have played a fundamental role for this coin. I strongly believe that right now is the best time to buy. New all time highs will come later this year!!

Vet/Eth potential play out into 2022 Possible breakout around November2021-March 2022 , if bitcoin heads to higher local tops easily Vechain will have a parabolic run towards the phycological target of $1-2 easy
Seems unrealistic and demotivating now..
Just give it time patience stay away from the charts and go play in the park or playground

$VET VECHAIN POTENTIAL WAVE IN THIS BULLRUN (LASTCALL)BINANCE:VETUSDT
Vechain VETUSDT still look bullish while they keep in bullish channel
the potential WAVE 5 will touch at fibonacci level 2.414, 2.618 or 3.
(not financial advice)


Vechain LongVechain should see targets of 35-45 cents based on the major impulse leg back in April 2021.

VET Spot Entry 0.11 Still Time to Get in!!If you missed out the other day there is still time for an entry at VETUSDT 0.11100 anywhere there.
The Idea:
Entry 0.11
TP 0.12
Entry VET/USDT 0.11
I Sell All 10% Profit about 0.12.
Or, I HODL please myself.
Or I sell some 75% and hold a little for more growth.
My idea is to buy and sell all at 10% profit. All In and all out. Little exposure time in a market that's risky to be in. You can lose your shirts in this market easy.
Enjoying the Robert Johnston Blues during these slow boring times trading.
Jaffasoft Signals

VET, A PREDICTED SCENARIO...The vet had a good reaction to the dynamic resistance line and after breaking it, we'll see great targets hitting one by one...

VETUSD Spot Trade Idea - VeChain
Entry: 0.11000
Take Profit: 0.12200
10% Profit In and Out and the trade is done in a few days even shorter.
I use the 1HR charts for these trades.
Saturday 18th Sep/21. Bitcoin just did a lower low to $47600. This is the first video I ever published on TradingView. Suggest any improvements below thank you. I watch markets 24/7.
This is just a basic buy and sells trade! Est a day or a few days/weeks.
Though HODL as long as you want.
Jaffasoft Signals:
See me on Twitter as Jaffasoft and Etoro for the performance of a publicly shared portfolio.
Disclaimer: You must understand trading has risks and this is not financial advice.

VeChain - Longterm Weekly Chart AnalysisLet’s have a look at the weekly chart for the most criminally undervalued crypto EVER. A Blockchain that is actually being USED by some of the words top companies and has a client base that would make any corporate jealous & salivate with envy. It HAS and IS everything every other Blockchain wishes it was. Worthy of note it that the behemoth PwC is an actual shareholder! I’m talking of course about VeChain.
VET is below its Bollinger Bands Middle Band Basis 20 Period SMA. A weekly CLOSE ABOVE this level is crucial.
VET is still above its 50EMA on this 1W timeframe.
VET is still above its Least Squares Moving Average (LSMA) and note that the last weekly candle bounced off the LSMA as support.
Note that overall Volume is still relatively low and the last 16 weekly Volume Bars have been below its Volume 20 Period Moving Average.
VET is still above its Volume Profile Visible Range Point of Control (VPVR POC) for this charts Visible Range.
VET is below its Volume Profile Fixed Range Point of Control (VPFR POC) for the fixed range of 9 Weekly Candles that i have selected. A weekly Candle CLOSE ABOVE this POC is crucial.
I have added a few support and resistance areas. At the moment, VET has found some support from its lower support area located at around $0.107 - $0.113 . A weekly CLOSE ABOVE the support are is crucial but not the end of the world if we don’t as there is still a lot of support below.
Note that VET is in a massive Symmetrical Triangle on this weekly timeframe. Note that the APEX is around the week of the 13th December.
The Moving Average Convergence Diveragnce (MACD) is indicating momentum is downwards at the moment and note that the MACD Line (Blue Line) has crossed back under its Signal Line (Orange Line) creating a Red Histogram. Note however that the MACD Line (Blue Line) is still above the 0.0 Base Line in the Positive Zone. A drop below the 0.0 basle line on this 1W timeframe will be very bad so its crucial VET stays above the 0.0 base line in the positive zone.
The On Balance Volume (OBV) is indicating momentum is downwards within a range at the moment. Note that the OBV (Blue Line) is below its 9 Period EMA (Yellow Line). We need the OBV (Blue Line) to cross back above the 9 Period EMA (Yellow Line) as well as break back ABOVE the dotted line at around 162.8B and then at around 163.72B for upwards momentum confirmation. The OBV indicator needs to stay above the 160.079B level.
Looking at this longterm chart, even if VET does drop lower, it would still be in a longterm uptrend so long as VET CLOSES ABOVE its Longterm Trend-Line (Dashed Line).
Unless BTC massively shits the bed again down to $28k then VET won’t drop to $0.07 but VET may possibly drop to $0.099 - $0.0934 if downwards pressure continues and VET cannot make a higher low or higher high next week.
Hopefully, after the release of POA2.0, we’ll see VeChain added onto other major exchanges & platforms like Kraken, Coinbase, Phemex, eToro and Bitstamp which will bring much needed liquidity and exposure. I mean FFS, if ShibaInu & Dogecoin are good enough for Coinbase & eToro, surely VET must be. ;-)
I hope this is helpful with your Trading and Hodl-ing.
Notes for those who don’t know:
LSMA = Black Squiggly Line on Chart
50EMA = Yellow Squiggly Line on Chart
Bollinger Bands = Grey Bands on Chart
Longterm Trend-Line = Dashed Line on Chart
VPVR POC = Long Horizontal Red Line on Chart
VPFR POC = Short Horizontal Red Line on Chart
Volume Bars = Green and Red Bars Bottom of Chart
Volume 20 Period MA = Blue Line going through Volume Bars on Chart
Support and Resistance Areas = Black Lines with Yellow Shading on Chart
Symmetrical Triangle = Ascending dn Descending Trend-Lines

VETUSDT 1DA flag pattern is formed for this altcoin
As prices rise above the resistance of the flag pattern, more buyers are expected to enter the market
After that, Wei China will be on a certain path to the September 6 price ceiling at $ 0.15
On the other hand, bears can push the price towards supporting the flag pattern
In this case, the price is expected to move back to the levels of $ 0.1 and $ 0.095
Thankful
good day

VETUSDT - 2 possible upcoming entries - +10% LONGVET is bumping against an upper trend line, if it gets broken on 4 hour it triggers a long for me. Depending on market conditions I may seek extra confirmation and require break and close on 1day.
If BTC experiences some downside I will look to enter off a retest of 0.11 support.
Be looking to take profit at 0.14
---
FUNDAMENTALS
---
Logistics
Rank #26
Market cap = $7.7 billion
---
------------------
NOT FINANCIAL ADVICE, please don't trade off solely my ideas. Always do your own TA and develop your own convictions.
------------------

Important Price Levels for VechainSome price levels that will be important for vet for the rest of this market cycle.

VET USDT Broke Trendline (wait for the PUMP) VEchain broke trendline up lets wait for the pump
BTC is stable? YES
vechain long term good? YES
do I think it will pump? YES
dont take it as finacial advice i just love posting my ideas and MAYBE you can trade them.

VET - BULLISH - Value Entry Area VET Vechain is in a GREAT value entry area. Looking primed for the next leg up on this BULL run. This is likely going to create a NEW ATH.
