Vechain

VETUSD LONG TERM UPDATEEven though H1 is a lower time frame, It does shows a complete ABCDE consolidation. VETUSD is set for an upside break-out with the first target being $0.35 from a measured objective of that peannut. $1 could also come sooner. It is only a 5x pump from the current price. We only buy the Dips and HODL!

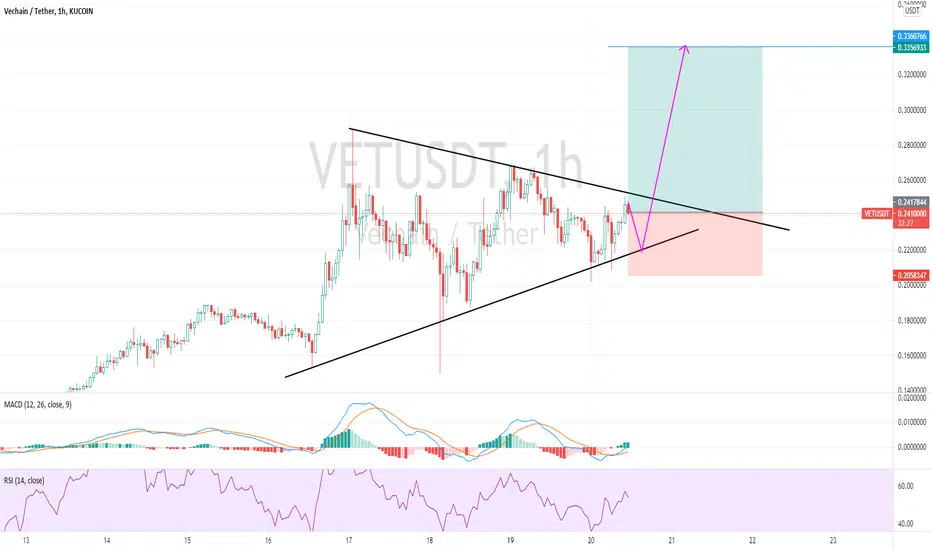
VETUSDT TRADE DAILY #3 --> Asc triangles everywhere!Potential setup here. Its on the 1 hour, 4 hour doesnt look too bad. These are forced trades on VET for me, they just a daily thing im having fun with, i dont recommend trading them.
Problem with this setup is relevance on smaller time frames. BTC is testing 50k, i think, as of writing, it wants to touch below it at least once. Does feel a little bullish overall tho, like we are interested in exploring higher highs today.
These ascending triangles are forming across a ton of pairs now, evidence higher highs are being made and ALTS are reacting bullishly to it. ALTS really look like they want to go up.
-=-=-=-=-=-=-
Todays VET Trade
-=-=-=-=-=-=-
BUY: Along the trend line when it comes down to touch
TARGET: Prepare to sell .206c to .207c
OTHERWISE: take profit after the breakout, get a close above the 206 to 207 mark then strap yourself in.
STOP: .185c or 5% below wherever you may get in on the trend line
-=-=-=-=-=-=-
--==--==--==----==--==--==--
Fundamentals
--==--==--==--
Rank #13
Market Cap = $14,333,165,000
Blockchain-powered supply chain platform
Top tier project
--==--==--==----==--==--==--

Morning Market VLOG#3 - We could be entering an uptrend!First 15 mins on mostly BTC price movements of the past 24 to 48 hours, i go over VET briefly and look at IOST and BTC on 1minute that i was watching last night.
I end with checking out some useful market websites, checking reddit and some crypto news aggregators

Safe Haven (SHA) ready for its next leg up$SHA
-5 Wave Microstructure (green) EW
-Retraced back to 0.618 Fibonacci
-Wave 1 & 2 of Macro EW
-MACD & RSI oversold on the Daily
-If it breaks lower Daily 200MA is a test...(should bounce)
Thoughts?


$VETUSD - Triangle continuationHello everyone!
Yet another VET analysis.
This will be my rebuy of VET here as I still hold a bag full of VeChain.
The best strategy here is to wait for a breakout and go long.
VET/USD Buy Idea UPDATEAfter ABC correction is finished its time to buy some more Vechain. Price hit 0.16-0.18 area also 0.50-0.618 Fibb retrecment, trend line and on H4 chart doji pin bar was created.

VET had a Fib extension of 4.618If the 4.618 extension is in play and was the absolute top for Wave 3, we just witnessed a correction Wave 4, I mean looking at the different supports from 0.382 where 18.9c was supported, then down to 0.618 where 13.3c, does feel like it is more correct than the way I had the other one. We shall see I guess.
Orange EW is the one I had to redo, compared to the original green as the green did not retrace.

VeChain Textbook Ascending TriangleVetchain has remained very bullish since the last rally. It is bouncing off resistance at 0.265 and the ascending triangle support which is typically a bullish pattern determined by breaking of the top horizontal resistance line which could trigger a rally once again.
Pros:
- The structure remains very strong despite bitcoin correction, validates an ascending triangle pattern.
- Indicators are being fixed, looking ready for rally (etc moving averages coming together)
Cons:
- Unstable time in the crypto market, BTC hanging on support if break below there will be more downside for all altcoins.
Personal trade idea: enter at break above 0.265 with retest / buy at accessing triangle supports. SL 0.195

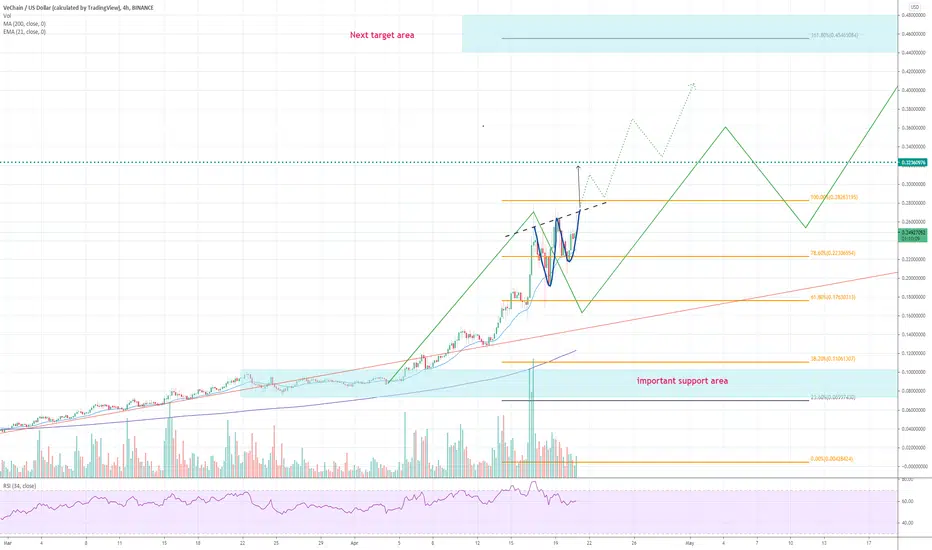
VET 1D Will it increases +200% again?Two months ago we published an idea for a VETUSDT pair that the price can do +200%
And she did, even more, breaking through the channel upwards in which the price of VETUSD moved for a year and showing the result of +400% - +500%
Further, is even more interesting , the annual channel has confidently broken through up and even managed to test the strength of the channel base with a squeeze.
Now the daily candles are showing a consolidation above the $0.220 level, not really reacting to the BTC straits
If this trend continues, then we can expect another +200% increase in the price of VET
Is there a strong fundamental news background behind the Vechain project? Please write about it in the comments.
We consider the level of $0.17 to be the critical point. Fixing the VETUSDT price below this level may start a correction to the $0.75-0.95 zone.
_____________________
Since 2016, we have been analyzing and trading the cryptocurrency market.
We transform our knowledge, trading moods and experience into ideas. Each "like under the idea" boosts the level of our happiness by 0.05% . If we help you to be calmer and richer - help us to be happier :)

VETBTC TRADE DAILY #2 ---> DANGER! dont trade this unless stupidPretty simple one today guys, we are outside the ascending triangle , breaking pattern. We are oversold across the board. We are showing all sorts of bearish signs, we have no identity, completely following BTC price action.
Only hope is a hail mary last ditch tom brady style throw from deep to try and win it all.
DONT TRADE THIS, ONLY take greedy entry down towards 413, yes iam trading this, yes im stupid, but this is for tradertainment purposes. Can i beat the market?!
-=-=-=-=-=-=-
Todays VET Trade
-=-=-=-=-=-=-
BUY: 413 to 422
TARGET: 445 to 450
STOP: 410
-=-=-=-=-=-=-
--==--==--==----==--==--==--
Fundamentals
--==--==--==--
Rank #13
Market Cap = $14,333,165,000
Blockchain-powered supply chain platform
Top tier project
--==--==--==----==--==--==--

What I'm watching over the next few days (Vechain / USD)If it stays within the section, I see this as a major buy opportunity once it breaks above.


VET/USDT 🔫Hey hey my friends 👋
Looking for VET to be pretty explosive, we never really fell with the market when BTC dropped. Aggressive entry now front running this larger ascending triangle pattern, targets on the chart 🔥

Vechain (VET) Symmetrical Triangle Forming to $30 cents.Since my last call on April 4th VeChain (VET) has been up over 150% in the past two weeks. I knew VeChain (VET) wouldn't be trading at $0.10 cents for too long considering what VeChain is, the current market sentiment, and the global supply chain & logistics problems they're revolutionizing. If we breakout of our symmetrical triangle to the upside I believe we will retest $0.28 cents. If not I expect us to hold steady above trading at $0.20 cents. For the past 2 weeks we've also been producing higher lows.
To put things in a quick perspective according to research and consulting firm Armstrong & Associates Inc. The global logistics market was $9.6 trillion in 2018 and is expected to surpass $12 trillion by 2023. If VeChain we're to even capture 1% of a $12 trillion global logistics market that would put Vechain at a $120 billion from it's current $15 billion market cap. That's not even counting the monumental capital coming into the cryptocurrency markets. VeChain is the first mover in when it comes to supplychain blockchain technology. So when big corporations are looking to utilize cryptocurrency technology to replace antiquated logistics systems VeChain will most likely be at the discussion table. Bitcoin and Ethereum aren't specifically solving logistics and supply chain problems when it comes to enterprise.
It seems like VeChain is making strides to capturing a significant portion of the global supply chain & logistics industry everyday. The Internet of Things (IOT) is upon us. I've been saying that VeChain to a $1 is a very real possibility this cycle. Much peace, love, health, and wealth!


Morning Market VLOG#1 - VET got me back into crypto!This is the beginning of my market vlog journey, here I talk a bit about what got me back into the crypto charts, i talk a lot about VET and towards the end come up with an interesting idea which im about to go chart now!

VECHAIN/ETH PAIR LOOKING FOR COOL-OFFdrew this VET ETH line a month ago and it seems to be playing out. may see a fat correction in VET soon...

VeChain is working on higher highs $VET recovered about 13% since Sunday and continues its uptrend. A higher low was formed on Monday and currently a higher high is being worked on. Breakout above $0.27 would activate the next short-term target at $0.32.
#VETUSD #VeChain
SHA starting EW 3$SHA
Had to go back and look at some old charts...
I'm excited for the coming weeks 🚀😍
-Micro EW (Green)✅
-Retrace to 0.618 (Macro EW 1) ✅
-EW Correction (Macro EW 2) ✅
-We are on our 3rd wave now, generally the biggest wave...
Thoughts? 😉
$VET $BNB #BSC $ETH $BTC

VETUSDT Triangle formationVETUSDT (1H Chart) Technical Analysis Update
Waiting for the Triangle Breakout
VET/USDT currently trading at $0.2543
Buy-level: 0.2650 (only buy if 1h candle closes above the resistance line)
Stop loss: $0.230
Target 1: $0.2780
Target 2: $0.300
Target 3: $0.350
Max Leverage: 3X
ALWAYS KEEP STOP LOSS...
Follow Our Tradingview Account for More Technical Analysis Updates, | Like, Share and Comment Your thoughts.

CRYPTOS ANALYSIS- What's next?Very interesting video after a very interesting day.
I had previously posted for longs on Binance coin (up +10%), SIA coin (up 7%), Bitcoin short and then Long and Ada also long.
Every post came with many questions and concerns/comments so please do 2 things:
- look below at previous ideas/charts
- watch this video for what's next
As you will see, Bitcoin will find resistance at 58k.. That will be CRUCIAL for what happens next.
Keep in touch- show you love
the FXPROFESSOR
