VET

VET - Technical review and analysisVET had a range trend during the last week and a downward trend in the last two weeks. The price of this currency has formed a new downward wave by completely breaking the support of the range of $0.017 to $0.020, and the support of the range of $0.014 to $0.015 and finally, the strong level of $0.010 can be good reaction areas for the current week and the coming weeks.
Of course, a short-term stop occurred in the $0.016 range, which increases the probability of the price entering a corrective wave in the 4-hour timeframe. Also, at the time of writing this analysis, the price has entered a trading range area in the 4-hour period, the first resistance of which is at the level of $0.0163 to $0.0165, and the second resistance can be considered in the range of $0.0170. Only if the second resistance is broken, we expect a trend change in this time frame. Otherwise, with a negative reaction to these resistances, we expect the continuation of the downward trend and a decrease in the specified support levels.

VETUSDT 1HVET has been accumulating since the 17th in the region between 0.01704 and 0.01624. As soon as it manages to pass through the reddish cloudiness of the Ichimoku Cloud, it will go in search of MM200, following the supports and resistances.
S: 0.01662 / 0.01626
R: 0.01699 / 0.01804

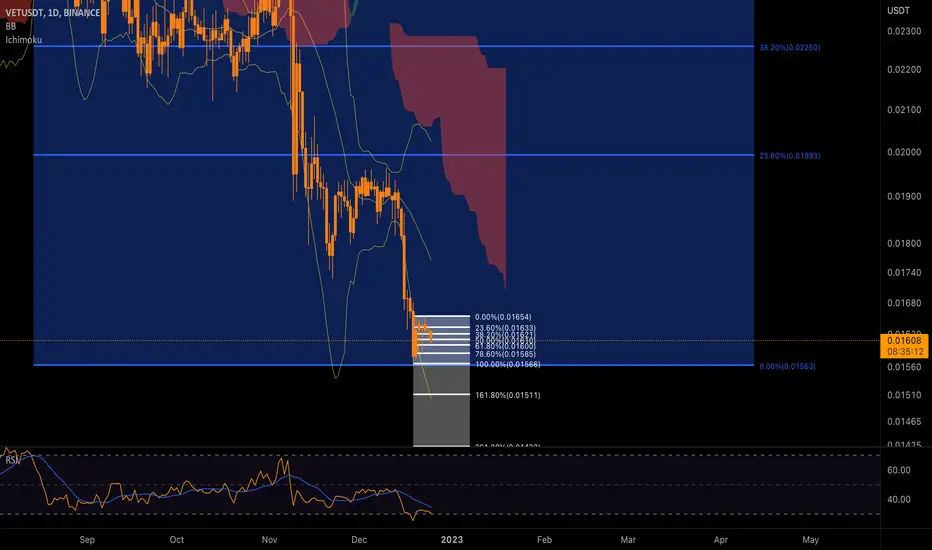
VETUSD may drop even 80 % in this bear marketVETUSD looks mega bearish.
The price got rejected from the resistance multiple times.
To be honest, there's nothing bullish now on this chart. It looks like it can drop even 80 %, however there are multiple support levels that may hold.
In case of playing short position , we recommend taking profits at support levels (red lines).
Probably many persons will think that it's crazy to predict 80 % drop for VET, but remember, this is crypto and altcoins may go parabolic down in a bear market . Alts can reach crazy low levels before finding the bottom.
BTC.D looks like it wants to rise which is another reason why we expect altcoins to dump a lot.

VeChain longVeChain bounced off the lower boundary of horizontal channel. Bullish movement to resistance level at 0.01924 is possible.

VeChain shortVeChain broke trough the support level. Asset broke trough the ascending trendline. Bearish movement to support level at 0.0173 is possible.

VET Technical analysisPrice is respecting demand zones perfectly and it is currently close to retesting the resistance at $0.0196. I expect price to reach the 4h supply around $0.0199 before potentially moving down again.

VET SHORT SETUPHello, dear traders. how are you ? Today we have a setup to SELL/SHORT the VET symbol.
For risk management, please don't forget stop loss and capital management
When we reach the first target, save some profit and then change the stop to entry
Comment if you have any questions
Thank You

$VET This Looks Very Bullish to Me ! @vechain$VET It's time to Pump !
Huge Pump Coming in my Opinion !

VET IDEA HELLO GUYS THIS MY IDEA 💡ABOUT VETUSDT is nice to see strong volume area....
Where is lot of contract accumulated..
I thing that the buyers from this area will be defend this LONG position..
and when the price come back to this area, strong buyers will be push up the market again..
UP TREND + Resistance from the past + Strong volume area is my mainly reason for this long trade..
IF you like my work please like and follow thanks

VeChain by Request (Easy Target 27% & More | 80%+)Here we have VeChain (VETUSDT) but this time a closer look compared to the previous analysis.
We have early signals of recovery as most of the cryptocurrency market is showing.
We have the 3 drops pattern or Inverse Head & Shoulders as well as a lower volume lower low, which all indicates the bears losing strength.
As the bears lose strength the bulls can enter the game.
The easy target is set around 25-28% in a range between the 0.618 Fib. and MA200.
Between 0.02400 - 0.02500.
Higher targets are possible depending how this upcoming bullish move develops.
I see 80%+ around 0.3531 reachable as well.
I hope that helps and thank you for your support, it is appreciated.
Namaste.

Are you ready VET? The market is probably ready for a pull back - but at the same time VET is (soon?) ready to break the long weekly downtrend. I think the risk reward "Long VET" right now is fantastic. See where the pull back take VET, set a stop loss and then ride. Hopefully you can use the trend line in the triangle as a support. Weekly close for VET could be a nice starting point for a long ride.

BTC, PYR, LINK, VET time to DCA?!Market can still capitulate and altcoins will in that case drop 40-50% or so. But lets assume that the market will recover fast. If the short time downside is 40-50% and the longtime upside is multiples...I don't think "waiting for the perfect entry" is the best choice. Don't wait to long to DCA into your favourite altcoins that you believe will survive the bear market. If the market suddenly turn bullish, you will quickly lose that big X-factor, upside (multiples to all time high) that the market offers you right now. Here are three of my favourite coins to DCA into - VET/PYR/LINK.

Not predicting, but preparing: VET/USDTNS 1.35.5.10
Shall I make this post public?
I ponder... well, dear {reader/trader/man/woman}, you will find out when you read these words, and the only one that ever may read them is me; if indeed, I do not publish them. So ponder that, and the dimensional illusions of the simulacram with which we control and surround ourselves. Indeed, ponder this for it is how we become the masters of domain and jurisdiction... in other words, if you are reading these words: Welcome fellow Wizard!
Here we have VET. The other day this chart for some reason came up as I was playing with Renko Bars, and put in a foolish(ly) leveraged trade which accordingly went bad, but fortunately with grit and patience, and through all the current, torrid, sky-is-falling bullshit, I saved it... a minimal loss. Of course, if my full wizard faculties would have been honed, I could've profited as I am writing these beautiful words of fate. As all better traders know, woulda-coulda-shmouda... be here now, project the future based on a past, which can be counted on to be dependable, occasionally.
Upon looking at the chart, I finally traveled timelines and expanded my cosmic view to larger horizons within the cube of 9.
I shall prepare my coordinates accordingly, and will be ready for blast-off. We shall see what occurs. Powerful wizards, the good ones, are ALWAYS prepared!
At this moment, as I gaze upon a sunny meadow, on a late autumn evening, in a quiet town of living men and women of the soil... I ponder... and I ponder... and I have pondered enough; so, since you are not only me reading these words anymore...
I shall bid adieu, and look forward to meeting you again. I bless you with peace, love, and abundance.

VeChain | Not Ready, Not Yet (Wait For Me)What you see here is a strong downtrend.
The chart looks just like Bitcoin.
We have a weekly rejection at EMA10.
The bias is bearish so VETUSDT is looking for a new support.
CHANGE
Only after prices move and close weekly above EMA10 can we consider the bullish bias, right now it aims lower.
Wait for my timing.
Wait for my signal.
We are waiting for the bottom to settle.
Once the bottom is settled marketwide, there will be countless opportunities, many good long-term bullish charts will develop.
I will share these charts with great numbers for you.
Patiend is key.
Thanks for your enthusiam and support.
Namaste.

VetusdtVetusdt
Broken hourly channel resistance
Npoc marked if rejected will go back for retest if flipped can test key levels
Ob is order block possible area to retest and gain bullish momentum

VET / BTC 1Day IntervalAs you can see, VET in comparison to BTC is moving above the support zone, which has already defended the price against further declines.
We are currently moving in a local sideways trend channel, which can be used for short-term plays.
If the price starts to rise, it has a strong resistance zone from 181 to 237 satoshi on its way.

VeChain VET price are holding up well, what are growth prospect?VeChain (VET) is a blockchain platform for logistics management.
The idea behind VeChain is to increase the efficiency, traceability, and transparency of supply chains while reducing costs and putting more control in the hands of individual users.
Maximally logistics optimization is very important in the current difficult times.
Launched in June 2016, VeChain is now one of the oldest specialized blockchain-based logistics platforms.
VET is a token used for transactions and other activities, while VTHO provides commission payment, similar to how Gas works for Ethereum (ETH) transactions.
If we look at the chart with weekly candlesticks, we can see that for the last six months the price of VETUSDT has been trading above a strongly mirrored level.
The liquidity zone of $0.02-0.022 in 2018, 2020-2021 and now skillfully played the role of resistance and support alternately for a long period of time.
In case of a positive phase in the cryptocurrency market, $0.039 per VET should be an easy target in the coming weeks.
The medium-term target is $0.06 according to the blue scenario.
If the negative background and "wars" behind the scenes of the crypto market will continue (in particular, we described them in yesterday's FTTUSDT idea)
Then the development of the white scenario can also be considered positive)
The main thing is that buyers of VETUSD keep the price above the liquidity zone of $0.02-0.022 and then everything will be fine for VET in the medium and long term.
_____________________
Did you like our analysis? Leave a comment, like, and follow to get more

VETUSDTanalysis was shared yesterday and flying today even in bear market
hold it tightly until we hits our targets

VET (extreme uptrend is possible)VET / USDT
One of my favorite coins which never disappointed me before
Price is breaking out the 1 year descending channel Which make this coin Looks promising in midterm
If BTC didn’t spoil the party .. extreme uptrend is possible

VET Bullish Long!VET is going to finish the cup on a bullish trend and then go on to inverse head and shoulders! I see this heading to the first black line drawn on the chart in early December and the head and shoulders inverse completed in early January. After the new all time highs will be established!
#VET is #bullish in every way in my opinion.
This is my opinion and not financial advice.
Happy #CryptoTrading!

VET SWING TRADE (SPOT)VET broke out above 0.023 key level and it's now the same key level zone that should be retested.
Invalidation would be daily close below .02170
SPOT or LOW LEVERAGE only.
