💡Don't miss the great buy opportunity inVETUSD @vechainofficialTrading suggestion:
". There is a possibility of temporary retracement to the suggested support line (0.04916).
. if so, traders can set orders based on Price Action and expect to reach short-term targets."
Technical analysis:
. VETUSD is in a range bound, and the beginning of an uptrend is expected.
. The price is below the 21-Day WEMA, which acts as a dynamic resistance.
. The RSI is at 67.
Take Profits:
TP1= @ 0.05453
TP2= @ 0.06193
TP3= @ 0.06855
TP4= @ 0.07495
TP5= @ 0.08007
SL= Break below S2
❤️ If you find this helpful and want more FREE forecasts in TradingView
. . . . . Please show your support back,
. . . . . . . . Hit the 👍 LIKE button,
. . . . . . . . . . Drop some feedback below in the comment!
❤️ Your support is very much 🙏 appreciated! ❤️
💎 Want us to help you become a better Forex / Crypto trader ?
Now, It's your turn !
Be sure to leave a comment; let us know how you see this opportunity and forecast.
Trade well, ❤️
ForecastCity English Support Team ❤️
VET

Inverted H&SWho else is ready for this? Looks like an Inverted Head and Shoulders is in play for VETUSD, however, it needs to cool off a bit on the LTFs before continuing imo.
Thoughts?

Falling wedge on the Weekly VECHAINWe have this beautiful falling wedge on the weekly chart.
As we all know Vechain has great fundamentals but the price is falling like rain, but i think we are at the bottom, because of this falling wedge on the weekly.
I have missed the train and bull run for vechain and now i am happy to have this opportunity to buy that great project so cheap.
The price target should be at the top of the wedge which is 25 cents but i think we can go way above that if the bitcoin goes up which i think it will.
What do you think about this falling wedge?
Feel free to leave a comment.
If you like my ideas please follow me and like the post because i am posting every day and you can find always something interesting on my profile, i am new to Treadingview but i have 6 years expirience in trading.
VET TO THE MOON!

INVERSE:head & shoulderCould this be a potential inverse head and shoulders on the breakout of the short-term downtrend? Maybe time for a swing play or two?

🆓VeChain (VET) Feb-26 #VET $VET
VET is still holding the $0.045 zone in the past few days, if it doesn't lose this zone, in the near future VET can rebound strongly to the $0.065 zone.
📈RED PLAN
♻️Condition : If 1-Day closes ABOVE 0.045$ zone
🔴Buy : 0.045
🔴Sell : 0.055 - 0.065
📉BLUE PLAN
♻️Condition : If 1-Day closes BELOW 0.045$ zone
🔵Sell : 0.045
🔵Buy : 0.04 - 0.035
❓Details
🚫Stoploss for Long : 10%
🚫Stoploss for Short : 5%
📈Red Arrow : Main Direction as RED PLAN
📉Blue Arrow : Back-Up Direction as BLUE PLAN
🟩Green zone : Support zone as BUY section
🟥Red zone : Resistance zone as SELL section

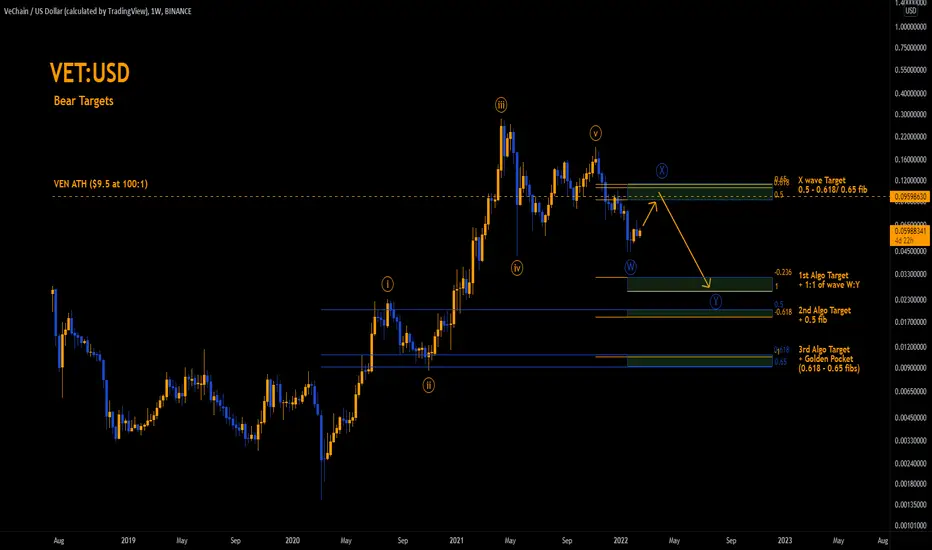
VET:USD Bear Targets $0.009 - $0.03I thought this was going to be a quick and easy analysis but it's latterly taken days! I got bogged way down in the Elliott count and in the end had to strip the chart bare and start again. What you see here is as simple as I could make it. I still prefer the bull count but it's always good to have a roadmap for when you're wrong. But there are a couple of reasons to lean into this bear count over the bullish one; the 144, 169 & 244 EMAs have now crossed bearish on the Daily. Combine that with the amount of time this correction has taken and now the case for this bear count is starting to stack up.
Key Points:
1st full impulse potentially complete
looking for a rally to put in the X wave before continuing lower
There are 3 high probability zones for the Y wave in this bear count
If the X wave only makes it to the 0.5 fib, the target for the 1:1 of X:Y moves lower and becomes part of the 2nd cluster near the 0.5 fib
If this count is correct I would love it to stop at the first target! But keep in mind if this is a completed 1 wave and we are now looking for a 2nd wave low on the higher degree; the high probability zone is between the 0.5 - 0.618 fibs.
The Trade: Short:
Entry 1: $0.0911
Stop 1: $0.0969 -6.3%
Entry 2: $.1083
Stop 2: $0.1149 -6%
Cluster 1
Target 1: $0.0312 1st algo -0.236
Target 2a: $0.0253 1:1 wave X:Y (projected from the 0.618)
Cluster 2
Target 2b: $0.0253 1:1 wave X:Y (projected from the 0.5)
Target 3: $0.0203 0.5 fib
Target 4: $0.0178 0.618 2nd algo -0.618
Cluster 3
Target 5 $0.0109 0.618 fib
Target 6: $0.0102 3rd algo -1
D.Y.O.R. DO NOT BLINDLY TAKE THESE TRADES.
Never Trust. Verify. DO NOT TRUST THIS ANALYSIS.
This is not financial advice. These are just my observations.
Technical Analysis is not about being right, it's about increasing your odds.
Be prepared to be wrong. Risk management is key . Capital preservation above all else.
These analysis take a considerable amount of time, consequently, I'm not taking any analysis requests.
Please respect my time and don't ask; because I dislike having to reject you
VECHAINHello mates, Vechain price analysis shows a strong uptrend in the last 24 hours. The price is approaching the resistance of $ 0.061 with its upward movement. Although the market direction is declining, this coin is growing. Today, the price has decreased slightly, and its trading volume has exceeded $ 243599616. This digital currency is in the 41st position among the top 100 coins, and its market value is 3861240184 dollars.
In daily timeframes, the market is squeezing as volatility has decreased. This means that the probability of price change is directly related to the direction of fluctuation. Less volatility means a lower probability of price change in either direction.
The Bollinger Bands are at $ 0.067 as the strongest resistance, and the Bottom Bands are at $ 0.048 as the strongest support.
The price of Vichin has reached below the moving average, which shows a downward trend. In addition, the price is moving upwards, which indicates the possibility of a bullish momentum recovery.
The RSI is at level 47, which indicates market stability. The downward movement of this indicator indicates a gradual decline in the market and the oversupply of sales activities over the number of purchases.
Conclusion:
Price analysis shows that this digital currency has momentum downtrends and uptrends. Although the bears have gained relative control, buyers have shown positive signs, and the situation is likely to change.

VETVET broke below yhe support and trendline too but ended being pushed up as #BTC plays it move. Now price reached the good resistance zone around $0.061 - $0.062 where price may reject or start a new range between these zones.


VET will give us 35% soonfollow us to get best profit of the market.💎🔥
VET will give us 35% profit soon.🤩😇

VETUSDT_Daily_2.11.22The photo says it all, please check and give your opinion.....
👤Mohamadhjz : @Mohamadhjz
📅11.Feb.22
⚠️(DYOR)
❤️ If you apperciate my work , Please like and comment , It Keeps me motivated to do better friend, I hope you are well

VET: Cup and HandleVET/USD (4Hour)
Bullish case:
- Has found previous support and broke through resistance lines.
- Cup and Handle looks to be in play with it possibly hitting old support which should serve as resistance at the $0.08 range
- Golden Cross looking to form in the upcoming candles
Bearish Case:
- Could get rejected at the peak of the handle at $0.07.
Thoughts?

VeChain Weekly ChartVet Weekly Chart
Vet Chain is , as most of Crypto coins are, trending down since the ATH April 2021.
The last two weeks the price bounced off the major S/R around the 0.050 area, and is approaching another resistance at 0.06750
To make it to 0.075 (also 78.6% Fibo Ret of the last swing from 0.18755)
Vet price need to stay consistently above 0.06750.
Weekly trend reversal will be in place above 0.1000 and by the time would be nice to breakout the diagonal trendline
0.10 is also a 61.8% Fibo Ret of the last swing down from 0.18755
Below 0.050 the next stop may be the 0.040 area , with the nightmare scenario as to go to 0.030.
My focus will be on any candles pattern to confirm the 0.06750 support.
Also, at H4 Timeframe MA200 is now support.
This is only my personal view, Not Financial Advice here.

VET : USD New Bull Targets $0.64c - $0.71 Like almost everything else in the crypto space, the proposed wave 4 for Vechain is deeper and has taken longer than I would like to see. Worth noting is that wave 3 didn't hit the full 1.618 extension either. Above is the bullish case but I also have a bearish case in mind that I will post early next week.
Key Points:
Wave 2: Hit high probability zone (0.618 fib)
Wave 3: Hit 2nd most likely extension (1.272 fib)
Wave 4: Retraced deep (0.5 fib)
Wave 5: Target $0.64 - $0.71
Wave C of the 4th wave correction only extended to 0.786 of A wave projected from the end of wave B.
Median line trade in play
The Trade:
Entry 1: Retest of the 1h 244 EMA
Entry 2: Breakout and retest of the 4h EMA once it had crossed bullish
Target 1: Median line ~$0.20 (80% probability trade as long as wave 4 pivot holds)
Target 2: 0.236 fib of wave 3 $0.64
Target 3: 1:1 of wave 1 projected from end of wave 4 $0.71
Stop 1: Break and close below 1h 244 EMA (Can re enter on any bullish break above the EMAs or any retrace to significant fib zones, but a break below the wave 4 low had me out of this trade to re assess)
Stop 2: Once the 4h 244, 169, 144 EMAs have crossed bullish and price is above, Exit position on the break close and test from below the 4h 244 EMA
*Note:
After looking at this again I realize the 4th wave correction should be labeled as a WXY correction instead of ABC- I also realize labeling as an WXY without putting it on the chart itself might confuse new traders and either way it doesn't change the outcome of the projections so I'll leave it as is for now!
Never Trust. Verify.
D.Y.O.R. Not Financial Advice Just an Observation.
Technical Analysis is not about being right, it's about increasing your odds.
Be prepared to be wrong. Risk management is key . Capital preservation above all else.
Please be aware: these analysis take a considerable amount of time, consequently, I'm not taking any analysis requests.
Please respect my time and don't ask; because I feel bad when I have to reject you!

Insane VeChain Bull Flag in Formation!Hey Traders,
This may be my most important trade yet! According to the Weekly chart of VETUSD, the price action has formed a bull flag (attached image URL). The breakout target out of this pattern is approximately 1.1-1.2 USD. In the rare case this does break down the target would be 0.007 USD (In this case we could open a short).
VeChain (VET) is a very revolutionary blockchain product, its utility is very unique compared to other Cryptocurrency Projects. The various amounts of things VeChain could be used to track for supply are infinite, not to mention it could also partner up with things like oracles AKA Chainlink to make it more efficient and data rich.
I hope this helped,
-Pulkanator

VETUSDT, LONG, 1D, BOUNCING FROM STRONG BOTTOM SUPPORT!!VETUSDT is bouncing back from strong support zone, my TP 1 will be at 0.07746 which is 0.236 Fib & previous support too.
And if the momentum continues my TP 2 will be 0.09844 which is at 0.382 Fib.
Good Luck ;)

VETUSDT TECHNICAL ANALYSISThe candles break out down trendline and one candle open-close above to down trendline. Also, MA changed to direction as well. Not only that, we have received multiple buy signals from @EngineeringRobo as well and Candle is staying above to support line as well. If market not get any correction in short time, we may earn approximately 46%. Let's follow our analysis together and do not forget the follow me.
"NFA"

VET/USDT 4 HOURS UPDATE Welcome to this quick Update, everyone.
If you are reading my updates for the first time do follow me to get more complex charts in a very simplified way.
I also post altcoin setups on Spot, Margin, and Futures.
I have tried my best to bring the best possible outcome in this chart.
VET/USDT breaks out this channel and already retested it and lying on 200MA.
Entry: CMP
Targets: 30%TO 40%
Stop Loss: $0.0612
What's your thought on this?
Do hit the like button if you like this update and share your views in the comment section.
Thank you
#PEACE

VET/USDT 4 HOURS UPDATE Welcome to this quick Update, everyone.
If you are reading my updates for the first time do follow me to get more complex charts in a very simplified way.
I also post altcoin setups on Spot, Margin, and Futures.
I have tried my best to bring the best possible outcome in this chart.
VET/USDT is making a bullish symmetrical triangle pattern.
Entry: CMP
Targets: 20%TO 28%
Stop Loss: $0.0497
What's your thought on this?
Do hit the like button if you like this update and share your views in the comment section.
Thank you
#PEACE

VeChain shortVeChain bounced off the resistance level. Asset bounced down off the bearish trendline. Decline to support level at 0.044 is expected to happen.

VET - investment idea💡💡#INVEST 💡💡
VET / USDT
▶️ Buy in two Block
1Block (40%) 0.0567 - 0.0676
2Block (50%) 0.0325 - 0.0397
3Block (10%) 0.0219 - 0.0254 (In case things get really bad, but I don't believe the price will fall here...)
SPOT ONLY!!!
#VETUSDT_INVEST_030122

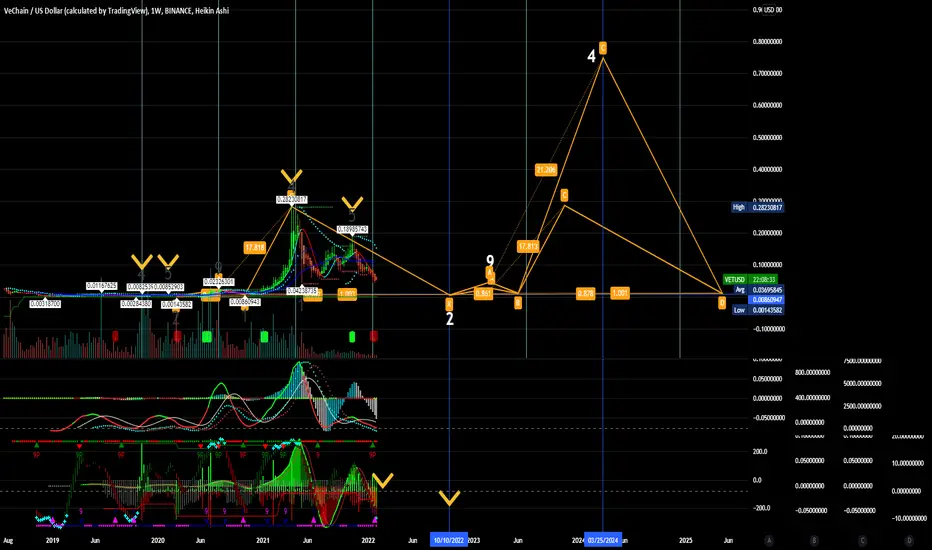
$VETUSD DBL Bottom$VETUSD entry PTs .001435-.008609 Target PTs .7628-1 and higher (Buy on 10/10/2022)
Possibly .00143582 to .75 Returns 522X Possible returns +19,561% to +52,134%
Prior run .00143582 to .2823 Returns was 196X +19,561%
Sequence 5; 1 bar .00541018 X 6
Sequence 9; 6 bars .00541018 X 6 = .032
Sequence 4; 8 bars .032 X 8 = .2596
VeChain Coin Price & Market Data
VeChain price today is $0.060368 with a 24-hour trading volume of $271,235,528. VET price is up 3.2% in the last 24 hours. It has a circulating supply of 67 Billion VET coins and a total supply of 86.7 Billion. If you are looking to buy or sell VeChain, HitBTC is currently the most active exchange.
What is Vechain?
VeChain is a blockchain-enabled platform that is designed to enhance supply chain management processes. By utilizing tamper-proof and distributed ledger technology, VeChain provides retailers and consumers with the ability to determine the quality and authenticity of products that are bought. From product source materials, to servicing history, and spare part replacements, every single piece of information about the supply chain movement of a product can be recorded and verified to bring about a supply chain management ecosystem that is secure for all participants. VeChain plans to achieve this secure supply chain management ecosystem via the method of asset digitization. VeChain enables manufactures to assign products with unique identities to the platform. This will allow manufacturers, supply chain partners, and even consumers, to track the movement of products through their supply chain.
Vechain Foundation
There is also the VeChain Foundation. The Vechain Foundation is a non - profit entity established in Singapore in July 2017 and is responsible for the construction of the network, and technological research and development. The Foundation also plays an important role in business development. The Foundation encourages and supports partnerships with enterprises that may be interested in utilizing blockchain technology as a service. This includes payment services, private key management, smart contract development, and wallet development. There is no doubt that blockchain technology can be an important innovation to supply chain management. With a growing list of business partnerships and technological developments, VeChain is positioning itself to be THE disruptive, and innovative force that reshapes the way we think about supply chain management.
VeChain team
Sunny Lu is the CEO of the VeChain Foundation and has already become an important figure in the blockchain space. Before he established VeChain, he co-founded the Chinese Internet start-up which developed Qtum, a very important digital asset in the crypto space. He was previously the CIO and COO of Louis Vuitton China.The team behind VeChain consists of over 90+ employees, most of them being developers. Chief Technology Officer, Gu Jianliang, has over 18 years of experience in areas such as mobile devices and the IoT field, and has created over a 100 patents in several technological fields. Kevin Feng serves as the Chief Operations Officer of the VeChain Foundation. Feng has been actively involved in many technology projects in his 12 years working for VeChain’s partner, PWC, as a consultant and assurance advisor.
VET/USDT channel strategy potential longAnalysis:
1. Weekly indicates a strong support/resistance area for VET right now
2. Zooming in on the daily the support/resistance zone is also clearly visible with a consolidating price action the last few days
3. Zooming in on the 4H and using the Bollinger Bands we can see a squeeze and a narrower Bollinger band. (an indication that price will become more volatile in the future)
4. Zooming in on the 1H we can draw a nice range in which the price has been moving the last 13 days, with one visible fake-out below the channel
5. right now 4th of Feb volume increased drastically on the 1h and price touched the resistance area.
6. I am drawing a FIB resistance on the current move and looking for an entry between the 0,5 and 0,618 levels as this seems like a fair price
7. There is a significant risk in this trade since the prices moves in a channel for the last couple of days therefore scaling in is recommended
Approach:
> for ease let's say we want to invest $100 in total
> If the price reaches the FIb levels as mentioned in step 6, place a buy order of $50 (SL below the 0,236 FIB level)
> If the price breaks out of the channel on the upside wait for a retest on resistance and buy-in with the other $50.
> SL below previous high after breakout channel
> TP 1 0,058
> TP 2 0,063
*as always DIY and not financial advice :)
