Whether it can rise above 0.02914 is keyHello?
Traders, welcome.
If you "Follow", you can always get new information quickly.
Please also click "Boost".
Have a good day.
** Analysis of the BTC chart publishes new ideas once a week.
** However, we publish new ideas when volatility occurs or when we show signs of diverging from our expectations.
** Excluding the above situation, BTC analysis is listed as a daily update.
-------------------------------------
(VETUSDT chart)
From a long-term perspective, a full-fledged uptrend is expected to begin when the price moves above 0.04757.
To do so, the key is whether it can be supported in the 0.02236-0.02519 section and rise above 0.02914.
If not, you should check for support around 0.01875.
Therefore, the possibility of a trend forming away from the current zone, the 0.02236-0.02519 zone, is increasing.
-------------------------------------------------- -------------------------------------------
** All descriptions are for reference only and do not guarantee profit or loss in investment.
** Even if you know other people's know-how, it takes a considerable period of time to make it your own.
** This is a chart created with my know-how.
---------------------------------
Vetbtc

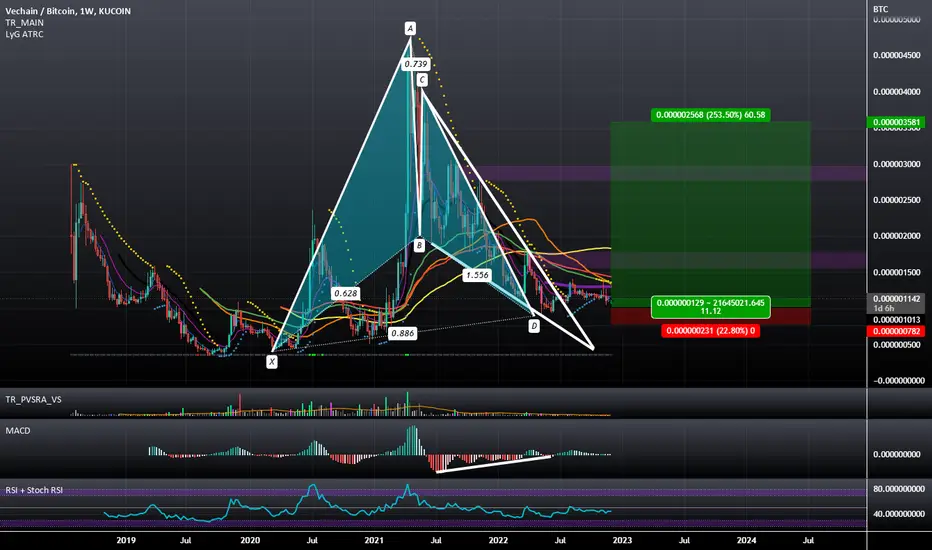
VET/BTC: Bullish Gartley Falling Wedge Breakout on the WeeklyThere is a weekly Bullish Gartley with Bullish Divergence and a Falling Wedge Breakout on the VETBTC pair.
VET long - earn BTCI think VET from now will start to outperform BTC. VET It's now touching support on BTC pair chart...and I think it could be a great time to switch some BTC to VET to earn BTC :) - Non financial advice.


VETCHAIN: $VET UPSIDE DISTRIBUTION? 🔔$VET has been trading in this range since weeks, there was some upside momentum because of partnership announcements but not enough for a breakout of this box.
I personally prefer these accumulation phases because it helps me get in with an accurate calculated risk, my SL is few % below the box and TP is partially set at every 20% rise.
This is my risk management method and everyone has his own way.
I will keep updating this in here, make sure you follow me to get price movement alerts!

VET is still very bullish!Hey guys, if you followed my previous TA you made a lot of profits. Congrats with that. So whats next for VET?
- VET is still on a higher timeframes in a uptrend. Remember that the trend is your friend.
- We finally managed to break the 200 EMA.
- Plus were moving in my Brown box with decent volume.
- We didnt break out of the Brown box. But eventually we will…
- After that we could move to the next resistance at 0,03385.
Greet times and profit ahead! Leave me a like and follow me to keep updated!

VET VeChain Crazy Cup & Handle Pattern FractalI think this one's out there but so interesting...
A cup and handle that's proved to have happened inside a much bigger cup & handle that's setting out to happen in the next bull run. Time-wise the PA must reach close to ATH this year and then it's game on.
There's so much going in the chart. The target for the cup & handle falls on the backwards 0.618 fib level, which is one more strong confluence. I could go on about all the confluences but I need the crazy side of me tamed this fine monday morning.
This is not financial advice. I'm a monkey with a TV membership.

VET LONG SETUPHi, dear traders. how are you ? Today we have a viewpoint to BUY/LONG the VET symbol.
For risk management, please don't forget stop loss and capital management
When we reach the first target, save some profit and then change the stop to entry
Comment if you have any questions
Thank You

Crypto , Cryptocurrency Is VetBtc trying to change the downtrend?
Once it breaks the 108 resistance, it can quickly try the 140 level.

Vetusdt Formed Falling Wedge In Daily Timeframe
Incase Of Breakout Expecting 200 to 220% Bulish Move
Entry Would Be Only Valid After Breakout (Keep In mind Vet will Remain Bearish Until Its Breaks Falling Wedge)
Safe Stoploss Area Would Be Below Falling Wedge

VETBTC Double BottomLooks like a double bottom on the VETBTC chart, expecting upside movement in the next few weeks.

VETUSD may drop even 80 % in this bear marketVETUSD looks mega bearish.
The price got rejected from the resistance multiple times.
To be honest, there's nothing bullish now on this chart. It looks like it can drop even 80 %, however there are multiple support levels that may hold.
In case of playing short position , we recommend taking profits at support levels (red lines).
Probably many persons will think that it's crazy to predict 80 % drop for VET, but remember, this is crypto and altcoins may go parabolic down in a bear market . Alts can reach crazy low levels before finding the bottom.
BTC.D looks like it wants to rise which is another reason why we expect altcoins to dump a lot.

VETBTC LONG IDEASame thing happened twice before. There is a possibility that it will happen a third time. made an upward attack on every trend break. It is educational work. It does not contain any investment advice. just my own thoughts.

VET SHORT SETUPHello, dear traders. how are you ? Today we have a setup to SELL/SHORT the VET symbol.
For risk management, please don't forget stop loss and capital management
When we reach the first target, save some profit and then change the stop to entry
Comment if you have any questions
Thank You

VET / BTC 1Day IntervalAs you can see, VET in comparison to BTC is moving above the support zone, which has already defended the price against further declines.
We are currently moving in a local sideways trend channel, which can be used for short-term plays.
If the price starts to rise, it has a strong resistance zone from 181 to 237 satoshi on its way.

VETUSDTanalysis was shared yesterday and flying today even in bear market
hold it tightly until we hits our targets

VET SWING TRADE (SPOT)VET broke out above 0.023 key level and it's now the same key level zone that should be retested.
Invalidation would be daily close below .02170
SPOT or LOW LEVERAGE only.

VETUSDT 2020's resistnace act as a good support.VETUSDT Technical analysis update
VETUSDT price reversing from its major support.
Buy zone: $0.0235 - $0.025
Stop loss: $0.020
TP 1: $0.0290
TP 2: $0.0335
TP 3: $0.0385
TP 4: $0.050
Always keep stop loss
Thanks
Hexa

VET/BTC Expanding Triangle Clamping the price before the impulseLocal trend. Time frame 1 day. Expanding triangle.
Coinmarketcap: VeChain
Price squeeze during “market doubt”.
A zone of price squeezing in a narrow range at the moment of uncertainty (doubt) of the market in general.
Clamped by large orders in the required buy/sell range on liquid exchanges. The range is spammed with orders, basically a bot is triggered to make the trades visible and to “protect” the large orders (so as not to “grizzly”, but if they gnaw—"go down steam"). Small exchanges themselves will “pull up” in price over time.
It works the same way (first of all) in pairs also to dollar, but the step is bigger (it is more difficult to hold a range). In pairs to bitcoin, it's easier to do due to smaller % of step (crypto price). The lower the price in satoshi, the more effective step clamping (range holding) is done.
Unfortunately, here on the site it is impossible to show the order stack, it would be more obvious, the chart is a consequence, not the root cause.
The meaning of the action—before a strong impulse up/down price movement, does not matter. You, unlike hamsters (those who are constantly losing money) cannot know exactly in which direction the market will locally go. The impulse (exit) is made under the general market trend (direction of movement). There are exceptions, but it is more about low liquid altcoins during the so-called “market window” (it is now). It helps a lot to move the price impulsively at such moments (decoupling):
1) stops (“market fuel”)
2) scalpers of course
3) oppositely tuned (in most cases, but not always) crowd (the main market participants) at the moment, that is the cloned behavior of people.
This is what the expanding triangle area looks like on a line chart.
This is what this "price squeeze" looks like locally.
On a linear to understand the without the "market noise".
The graph is a consequence of the sense of action in the glass.

Pretty clear possibility for VETPossible reverse H&S pattern forming on the VET/BTC chart. BINANCE:VETBTC

Future price prediction!???It's amazing how Vechain price charts line up! It appears that these indicators may be telling us a $3 Vechain price by New Year 2023.. and a possible $12 Vechain mid-year 2023!!! Let's wait and see 👀
Don't forget to BUY!!!!


Vechain 40% pump incomingHi traders vechain has broken out of this trendline that it dod not before so make sure you check the retest.
