Great time to buy $VETVeChain, IMHO, is on the top 5 project out right now. It's disrupting supply chain technology is a big way and is extremely undervalued. This is a long term hold for me but I also like to play the channel swings.
Vetlong

1$ VET - Lets go!Please don't go by the title, to go to 1$ there is a lot of time and VET has to burn down their tokens. But still it is very bullish, actually very very bullish token and it should be bought and put in a cold storage. check their website to see there partners and work they are doing. With respect to BTC price also VET has reversed the trend bullish.


Vechain(VET) Explosive Move New ATHs 30% Gain to $0.10*Update Vechain Outlook 15/03/21*
Road to $0.10 is clear, 30% Gain from current price level to the 161.80% Fibonacci level. Buy the dips, be patient!
*13/03/21*
Vechain's price soared to a new ATH on 12/02/21 reaching $0.606 on the Binance exchange. Following the new ATH there was a small retracement before trying to push past the resistance set at ATH , but this failed to break on 19/02/21 and was met with huge selling pressure at these price levels, retracing down further, quite sharply after 4 days on 23/02/21 touching the 50 SMA on the daily chart with a low of $ 0.0341. The downward pressure was met with a sharp bounce on the 50 SMA recovering in a day 24/02/21 back to the 38.20% Fib retracement level showing strong signs of Bulls still in the market. As of the past 3 days the price has been consolidating between a small range between the 38.20% Fibonacci retracement levels and 23.60%. Further to note the price on 2 occasions has tested to break below the 50 SMA failing twice signalling strong bullish pressure and signs of the Bulls to continue driving the current price to test the ATH yet again whilst also setting the sentiment of a possible new ATH at the 127.20% Fibonacci retracement level @ $0.0702.
Furthermore the 200 SMA has been tested at 3 occasions on the 4H Chart, failing to break past this level. Vechain is in a perfect zone for Buys back towards the ATH . Stochastics on the Daily chart signal an extremely oversold market so expect Vet to push back 55% back to ATH levels and Further 74% to 127.20% Fibonacci with the potential to set a new ATH in the coming days to weeks in March.
The Fundamentals are great for this project and we are very bullish and can see EOY price target between $2 to $5. Buy Zone 1 @ 23.60% Fibonacci retracement level for the perfect sniper entry. Be patient, wait for confirmation before entering any buy. Happy Trading :)

Vet is booming Vechain pushing towards ATH, broke heavy downward resistance, our EMA ribbons are starting to point even higher up and the stoch RSI exploded off of the top of the oversold zone, looking for a break of the ATH in the coming days if we keep this up! Not financial advice, just my opinion

VET: ATH after ATH // the start of the parabola!Vechain hasnt gained that much yet compared to other altcoins. This is because VET has been around for a while and there isnt that much hype around it.
However this is all about to change, VET has one of the best fundamentals and will be one of the biggest players in the Chinese block chain empire.
And yes; China is the empire for block chain, not Europe or USA; China will be the first to launch their CBDC and create mass consumer adoption for blokchain.
If you dont know what im talking about; do your research and find out what and why.
VET has many many partnerships in China with corporations and the government, this means that they will be one of the (if not the) first block chain with MASS consumer adoption.
Dont think because you hold some coins you are adopted on the block chain, youre just in it for the win; which is fine but block chain will be mass adopted for multiple use cases.
When this happens in the next years; VET, LINK, DOT, ETH, KSM, UNI, MUSE and many more will be the winners and shitcoins will disappear. VET will be the first to get that adoption.
Long story short, VET is mega bullish on TA and fundamentals, check the chart for short term targets and yes I believe this the start of the parabola!
We are in full price discovery so we can snap parabolic anytime, make sure to ride the wave!
This is not financial advice, you invest with your own research and based on your own opinion and at your own risk.

VET/USDT - Bullish W pattern approvedHello traders and community, today we will tell ourselves shortly about the situation of VET/USDT
Trend analysis
- As you can see from the VET/USDT daily chart , the price of VeChain is going upward cause of double bottom formation (white line) and already tested resistance level (first red line), that's why we can expect bullish movement in the following days with 70 % probability. I recommend to put long positions (possible scenario on the chart), but only when you see correct signal for this movement. Today's resistance level is on 0,072683 price level, support level is on 0.059543 price level and global trend stays bullish. Wish you good luck with VeChain!
Chart pattern
- Double Bottom pattern (processing)
Technical indicators
- RSI: market is still in boarders and is located near 69 level (not overheated, Neutral signal)
- MACD: MAs are prepared for upward movement + they get away from each other (Bull signal)
- BB: Volatility of the market started increasing after range movement accomplished (Bull signal)
- MA (10,20): MA10 is higher than the level of MA20 and going upward (Bull signal)
= Overall bullish signal movement
Dear friends, please push the like button, write comments below, follow me for more technical analysis and share this post with other traders - that would be the best support, Thank you for your attention!
Tell us about your opinion for making better decisions :)
P.S.: Information provided is only educational and should not be used to take action in the market.

Vet UPDATE 13 Ema about to cross up 50 SMA March 02 2021 Update
Vechain's price soared to a new ATH on 12/02/21 reaching $0.606 on the Binance exchange. Following the new ATH there was a small retracement before trying to push past the resistance set at ATH , but this failed to break on 19/02/21 and was met with huge selling pressure at these price levels, retracing down further, quite sharply after 4 days on 23/02/21 touching the 50 SMA on the daily chart with a low of $ 0.0341. The downward pressure was met with a sharp bounce on the 50 SMA recovering in a day 24/02/21 back to the 38.20% Fib retracement level showing strong signs of Bulls still in the market. As of the past 3 days the price has been consolidating between a small range between the 38.20% Fibonacci retracement levels and 23.60%. Further to note the price on 2 occasions has tested to break below the 50 SMA failing twice signalling strong bullish pressure and signs of the Bulls to continue driving the current price to test the ATH yet again whilst also setting the sentiment of a possible new ATH at the 127.20% Fibonacci retracement level @ $0.0702.
Furthermore the 200 SMA has been tested at 3 occasions on the 4H Chart, failing to break past this level. Vechain is in a perfect zone for Buys back towards the ATH . Stochastics on the Daily chart signal an extremely oversold market so expect Vet to push back 55% back to ATH levels and Further 74% to 127.20% Fibonacci with the potential to set a new ATH in the coming days to weeks in March.
The Fundamentals are great for this project and we are very bullish and can see EOY price target between $2 to $5. Buy Zone 1 @ 23.60% Fibonacci retracement level for the perfect sniper entry. Be patient, wait for confirmation before entering any buy. Happy Trading :)

Super bullish on vechainVechain is continuing to push higher highs and creating new ATHS, we are pushing the 1.2 Fib level and imo I believe we will see a breakthrough soon and continue to our next FIB level, vechain is in price discovery mode and theres no sign of any bearish movement, the MACD is looking extremely bullish and almost pointing straight up! If we see any dips or little corrections i imagine the bulls will buy it up in a heartbeat and keep pushing price up! NFA just my
Opinion!

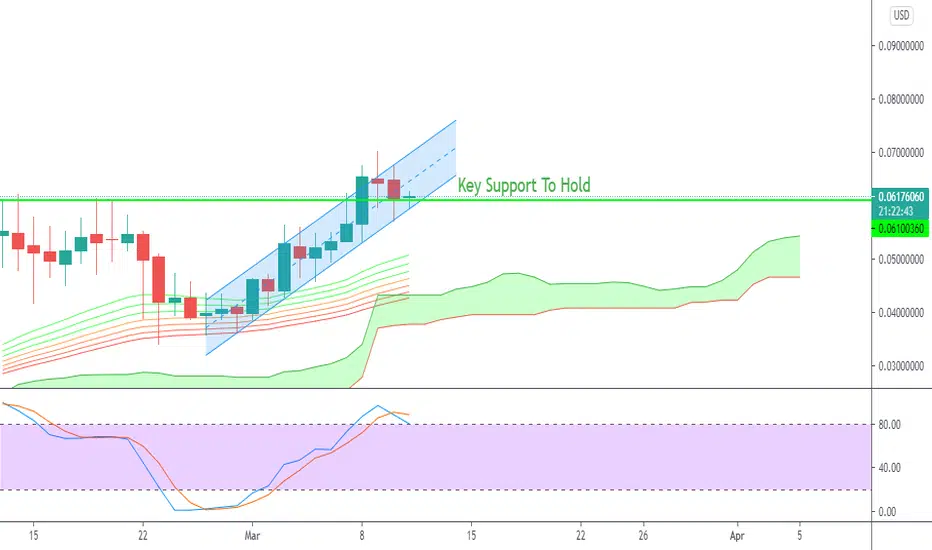
VET must hold support!The bulls are coming in strong and buying up this dip and holding our previous ATH support. Looking like a bit of a cool off after our big recent run, we could see a little bit of accumulation on the support line and slightly above but believe we are going to see another strong move up in the near future! we have got very strong support all around with Ichi Cloud and EMA ribbons point up! Our stoch RSI is coming back down from overbought and like i said possible accumulation but ultimately to go back up! Not financial advice just my opinion.
VET SMASHED THROUGH KEY RESISTANCE LEVEL Vechain has absolutely smashed through this key resistance and flipped it to support, Ichimoku cloud still printing support pointing slightly up and the EMA ribbons are really starting open up and point up with Bullish momentum! The Stoch RSI is in overbought territory so what we could see is a little dip down in both price and RSI but i believe it will get bought up pretty quick and we have a good chance of holding our new support, in that scenario afterwards we will start to see price rise again creating new levels of support! Not financial advice just my opinion.

$VET: All levels to watch!I made a simple cheat sheet for you, look to levels.
look nice to me, be patient.
BTC: 1Gro97DoABk7BMegn5TKopmMXLKQefej9r
XRP: rw7wnYPy8ZR542piPUNcz8fzmkNZY27WXS
BNB: bnb1r2r3rzad7v0lkmhr4kn6wp5stsr7ur8gknvqp2
UNI: 0x112F395E94a7084Ca6dAa9Ba1462192Ac56570F5
USDT: 0x112F395E94a7084Ca6dAa9Ba1462192Ac56570F5

vet usdt ready for next LEG , By Daniyal Daraeihello everyone
please like it before reading
vechain (VET) have e good resistance on 0.060 and after breaking that it will reach the targets that marked on analyze.
Have a Green week fellas :D ;)


Vet Update 13 Ema about to cross up 50 SMA Buy ConfirmationVechain's price soared to a new ATH on 12/02/21 reaching $0.606 on the Binance exchange. Following the new ATH there was a small retracement before trying to push past the resistance set at ATH , but this failed to break on 19/02/21 and was met with huge selling pressure at these price levels, retracing down further, quite sharply after 4 days on 23/02/21 touching the 50 SMA on the daily chart with a low of $ 0.0341. The downward pressure was met with a sharp bounce on the 50 SMA recovering in a day 24/02/21 back to the 38.20% Fib retracement level showing strong signs of Bulls still in the market. As of the past 3 days the price has been consolidating between a small range between the 38.20% Fibonacci retracement levels and 23.60%. Further to note the price on 2 occasions has tested to break below the 50 SMA failing twice signalling strong bullish pressure and signs of the Bulls to continue driving the current price to test the ATH yet again whilst also setting the sentiment of a possible new ATH at the 127.20% Fibonacci retracement level @ $0.0702.
Furthermore the 200 SMA has been tested at 3 occasions on the 4H Chart, failing to break past this level. Vechain is in a perfect zone for Buys back towards the ATH . Stochastics on the Daily chart signal an extremely oversold market so expect Vet to push back 55% back to ATH levels and Further 74% to 127.20% Fibonacci with the potential to set a new ATH in the coming days to weeks in March.
The Fundamentals are great for this project and we are very bullish and can see EOY price target between $2 to $5. Buy Zone 1 @ 23.60% Fibonacci retracement level for the perfect sniper entry. Be patient, wait for confirmation before entering any buy. Happy Trading :)

Vechain(VET) Explosive Move Back To ATH & Beyond 55% to 74% GainVechain's price soared to a new ATH on 12/02/21 reaching $0.606 on the Binance exchange. Following the new ATH there was a small retracement before trying to push past the resistance set at ATH, but this failed to break on 19/02/21 and was met with huge selling pressure at these price levels, retracing down further, quite sharply after 4 days on 23/02/21 touching the 50 SMA on the daily chart with a low of $ 0.0341. The downward pressure was met with a sharp bounce on the 50 SMA recovering in a day 24/02/21 back to the 38.20% Fib retracement level showing strong signs of Bulls still in the market. As of the past 3 days the price has been consolidating between a small range between the 38.20% Fibonacci retracement levels and 23.60%. Further to note the price on 2 occasions has tested to break below the 50 SMA failing twice signalling strong bullish pressure and signs of the Bulls to continue driving the current price to test the ATH yet again whilst also setting the sentiment of a possible new ATH at the 127.20% Fibonacci retracement level @ $0.0702.
Furthermore the 200 SMA has been tested at 3 occasions on the 4H Chart, failing to break past this level. Vechain is in a perfect zone for Buys back towards the ATH. Stochastics on the Daily chart signal an extremely oversold market so expect Vet to push back 55% back to ATH levels and Further 74% to 127.20% Fibonacci with the potential to set a new ATH in the coming days to weeks in March.
The Fundamentals are great for this project and we are very bullish and can see EOY price target between $2 to $5. Buy Zone 1 @ 23.60% Fibonacci retracement level for the perfect sniper entry. Be patient, wait for confirmation before entering any buy. Happy Trading :)

VET is likely ready to soar...VET/BTC is going to break MA200 and in case of happening, this could be a great buying opportunity...
Watch out...

#vetusdt #vechain #4h #vechainHi guys..its the latest analyze chart of VETUSDT in 4H timeframe(folowers Requested analysis) .if you are interested any crypto that you want analyze with me and any questions please do not hesitate and comment below the chart!
if u like it press like-comment and folow me.thx

VETUSDT(Falling wedge breakout)VETUSDT (4H CHART) Technical Analysis Update
Falling Wedge Breakout
VET/USDT currently trading at $0.0280
Buy-level: Above $0.269 - $0.0282 (Wait for the small retracement)
Stop loss: Below $0.0241
Resistance l;evel 1 (Target 1): $0.0352
Resistance level 1 (Target 2): $0.0400
Max Leverage: 3X
ALWAYS KEEP STOP LOSS...
Follow our Tradingview Account for more Technical Analysis Update, | Like, Share and comment your thoughts.


VeChain LONGBreakout compleate. If Bitcoin continues rally, 60% or 140% potential profit, Good luck!

VET LONGVechain has been performing very well recently. It seems to have broken out of the triangle structure. I would be waiting for the retest that is mapped out around the 0.0300-0.0303 region. Targets are mapped.
Please do not take this as financial advice. I am a noob who likes math.
