VETUSDT can breakout the next resistanceHi friends, hope you are well and welcome to the new update on Vechain.
More than 74% rally:
In my previous article, I said that the VET has completed the bullish setup for the breakout and I was expecting up to 60% rally. Finally, the pricelline of VET broke out the resistance of wedge and rallied more than 74%.
Different support and resistance levels:
After the breakout the price action of Vechain also broke out the $0.013, $0.015, and $0.018 and at the moment it is trying to breakout the next resistance at $0.021. In the meanwhile, the priceline of VET has also broken out the simple moving averages with the time period of 25, 50, 100 and 200 as well.
Exponential moving averages:
On the long-term weekly chart the price action has also broken out the exponential moving averages with the time period of 10 and 21 and using them as support very well before starting the next rally to the upside.
Ichimoku cloud:
On the long-term weekly chart the price action of Vechain has already crossed up the bearish cloud and now it has good support of conversion line and baseline and bullish cloud as well.
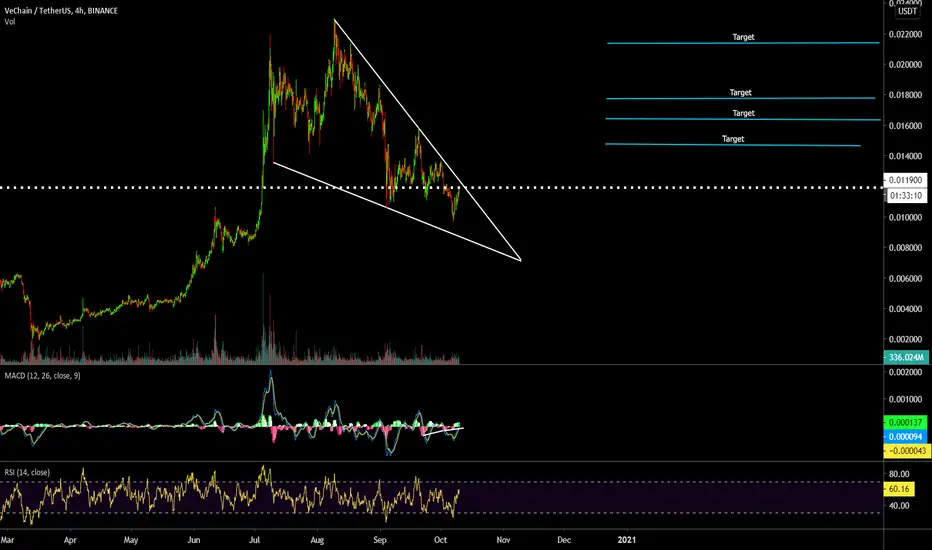
Priceline has broken out the resistance of new wedge:
On a small time period 4-hour chart, the price action of Vechain formed a falling wedge and now broken out the resistance therefore, it can make another attempt to break out the next price level resistance at $0.021.
Conclusion:
After breakout from the new wedge, the price action can even breakout the $0.021 and can make a new high at $0.03.
Vetlong

VETUSDT (Resistance Zone Breakout )#VETUSDT Technical Analysis Update
Resistance Zone Breakout
VET/USDT currently trading at $0.0192
LONG ENTRY level: $0.0183 to 0.0193
STOP LOSS: below $0.0173
Resistance level 1( Target 1): $0.0213
Resistance level 2 ( Target 2): $0.0240
Resistance level 3 (Target 3): $0.0270
Max leverage: 4X
ALWAYS KEEP STOP LOSS...
Follow our Tradingview Account for more Technical Analysis Update, | Like, Share and Comment your thoughts.

Vet/usdtVET reached its target I had analyzed it on December 18th ✅
Good luck ...✌
.friends please follow me 🙏

VET on the show again !!VET / BTC
Nice bullish move today
breakout of ascending traingle
The target short term is 85 sat
Invalidation = close below 60 sat
The 1D TF chart
Not a buy signal from this point just reading chart
Good luck


Vet/btc very bullish!So here’s what I’m seeing for vet/btc pair (Note: I also love the vet usd pair and I think .0220 is coming soon). Two reasons why: Double bottom/rising RSI on falling price (bull div). I’ve marked my target areas on the chart and how I think we get there. Also, I want to point out this is short term. VET/USD and VET/BTC has a lot of room to run, especially above the .0220 (usd pair) I spoke of.
Good luck y’all!!!!

VETUSDT (Waiting for the resistance zone Breakout)#VETUSDT Technical Analysis Update
Waiting for the Resistance zone Breakout
VET/USDT currently trading at $0.1580
LONG ENTRY level: above 0.01600 (only enter long after the resistance zone breakout in 1-hour chart)
STOP LOSS: Below 0.0151
Resistance level 1( Target 1): $0.01660
Resistance level 2 (Target 2) : $0.0178
Max Leverage: 4X
ALWAYS KEEP STOP LOSS...
Follow our Tradingview Account for more Technical Analysis Update, | Like, Share and Comment your thoughts.

VETUSD 70% short term profitVechain forming a perfect break out zone on the 4HR chart.
ALTS are in bullish territory including perfect build up for VECHAIN with higher lows and upward buying pressure.
The rest of the info is in the chart... good luck ;)

VET/BTC (Vechain) the buyers still on show VET / BTC
🌟 Techincal Analysis 🌟
I still very bullish long term on this satoshi coin along with some few others
The buyers show strength since 2 weeks after breaking 5 months gaint falling wedge and we can see bullflag also on daily frame
On weekly frame chart is more impressive
I Remind you that we already bought VET(Vechain) early around 7x sat see here my previous idea :
🚨 Invalidation :
As you know this market is wild and we can change our view based on price action Change
If VET closed by weekly candel below 85 sat (0.786 fib level )then the bears can start to enter strong again
🌟 This is not financial advice
Please have a plan before trading and use stoploss
Good luck and happy trading 🌹

Long term Vet predictionHello,
As you can see VET broke out of a downtrend.
It will take some time to go up again to levels where he was before.
First of all I want to show the uptrend that is going on.
Trendline straight up.
ALso the EMA is showing some positive sings.
A: most likely it will go this path (no financial advice).
B: if A doesn't work out immediately and it receives some resistance it will bounce a little in this area and then break out.
C: total rejection and it will go to lower resistance lines again
D: bullrun scenario when BTC goes down and Altcoins will boom.
All indicators show VET will rise long term.
But besides that there are many other reasons.
VET has a lot of big plans going on in 2021 and 2020 was also a beautiful year for them.
My personal outcome for VET in bullrun after BTC dominance goes down:
it will get to 0.4$, possible to max 1$.
Why not +1$?
calculate yourself, supply x price = market cap from +1T, is impossible.
Feel free to comment, add or question.
These are also my first releases on tradingview and I'm still learning a lot.
Thanks for reading
and please leave a comment/your view about VET!

VeChain VETUSD - Key Levels to watch for Buy opportunityKey zones to buy VETUSD or VeChain.
0.0085-0.0095 has been historic resistance on many occasions. Expect this level to be respected as a support going forward for the next leg up.
Also, break of the descending channel will confirm the setup and will resume the bull run that started around Apr 2020.

vechain can be tried. Vetbtc VeChainBtcrshs occurred. first station 95 sat. can be. this is not investment advice. just my amateur work. good luck for everyone.

VET best eatery point! I do believe this is the real bottom of v chain . Don’t ever miss it .
If you like this idea give me a thumb up!

VET Bullish Long termBullish divergence on weekly time frame. Long term buy signal. Daily and shorter time frames are also solid. Extremely bullish on Vechain, Mainnet transactions have seen huge growth recently.


Vet/usdt the breakout is very soonBuy the break or retest
Stoploss daily close below 0.00999$
Targets in chart (red)
Good luck

Vet/btc Vechain consolidation in the demand zoneI posted a few days later my idea when vechain is
119-120 sat
I expected it to drop in the demand zone shown in chart between 95-108sat
That what happened as i expected
See here my previous idea
Now it shows consolidation in that area
Which is a good potential for next move
But we will entry after break and close above the trendline resistance for more confirmation

Vetusdt time to move bullishVetusdt time to move vet set up lovely, bullish divergence on Macd targets posted
VETBTC - Flickering green light ?It seems that we will see a price increase..
RSI and STOCH are risen from the bottom.. ROUND 100 satoshi number + static support on this zone
I opened a small long position.. waiting for confirmation to re-entry or close position,
Set SL on 98
Risk/Reward ~ 1/3


Vet/btc long very bullishBuy area 95-108sats
Or better wait and buy the break of trendline
TP1 = 139
TP2= 175

VET/BTC- ATS SCALP BACKTESTScript settings for 2H timeframe:
· Signal calculation type - "open"
-TP for Long - 4%
-SL for Long - none
-TP for Short - 3%
-SL for Short - none

VETBTCVETBTC is forming W bottom on 200 DMA , its listed in Aug 2018, current ranking on CMC 25, Expecting to hit on top 10 .
