VET/USDT – Golden Pocket Retest After Breakout!🧠 Overview: Is VeChain About to Flip Bullish?
The 2D VET/USDT chart (KuCoin) is presenting a high-potential setup. After months of downward pressure, VET has finally broken above a long-standing descending trendline, which has been intact since early 2025.
Now, price is retesting a major support zone—which also happens to be the Golden Pocket of the Fibonacci retracement (0.5–0.618). This area is crucial for confirming whether this is a real trend reversal or just another fakeout.
---
🧩 Technical Structure & Key Levels
📍 Descending Trendline (Broken)
A clear breakout from the downtrend that started in February 2025.
First signal of a potential trend reversal.
📍 Critical Support Zone – Golden Pocket
Range: 0.02258 – 0.02390 USDT
Aligns with Fibonacci 0.5–0.618 retracement from recent swing low to high.
Acts as a historically strong horizontal support — now being retested after the breakout.
📍 Fibonacci Resistance Levels (Upside Targets)
Level Price (USDT)
Resistance 1 0.02840
Resistance 2 0.03235
Resistance 3 0.03745
Resistance 4 0.04265
Resistance 5 0.05185
Extended High 0.07786 – 0.08006
📍 Major Support (Last Line of Defense)
0.01772 USDT, the lowest level seen since late 2023.
---
✅ Bullish Scenario – Valid Retest & Reversal
If the Golden Pocket zone holds, we could see:
Continuation of bullish momentum
Gradual move toward:
🎯 0.02840 as the first resistance
🎯 0.03235 – 0.03745 as mid-term targets
🎯 0.04265 – 0.05185 if momentum strengthens
Potential formation of an Inverse Head & Shoulders pattern, signaling a strong reversal base
---
❌ Bearish Scenario – Failed Retest
If price fails to hold the 0.02258–0.02390 support zone:
We may see a move back down toward 0.01772 USDT
This would invalidate the bullish breakout (false breakout scenario)
The longer-term downtrend could resume
> ⚠️ Beware of a potential bull trap around 0.025–0.026 — price rejection here could signal a failed breakout.
---
🧠 Current Price Action Pattern
✅ Descending Trendline Breakout → early bullish signal
🔁 Golden Pocket Retest → now in progress, critical for direction confirmation
📈 Reversal Potential → watching for Inverse Head & Shoulders formation
---
💡 Conclusion
VET/USDT is at a make-or-break level. The breakout above the descending trendline is promising, but the current retest of the Golden Pocket zone is the real test for bulls. If this level holds, we could be witnessing the early stages of a trend reversal with multiple upside targets in play.
#VETUSDT #VeChain #CryptoBreakout #FibonacciLevels #GoldenPocket #AltcoinAnalysis #InverseHeadAndShoulders #TrendReversal #CryptoTechnicalAnalysis #SupportResistance #CryptoSignals
Vetusd

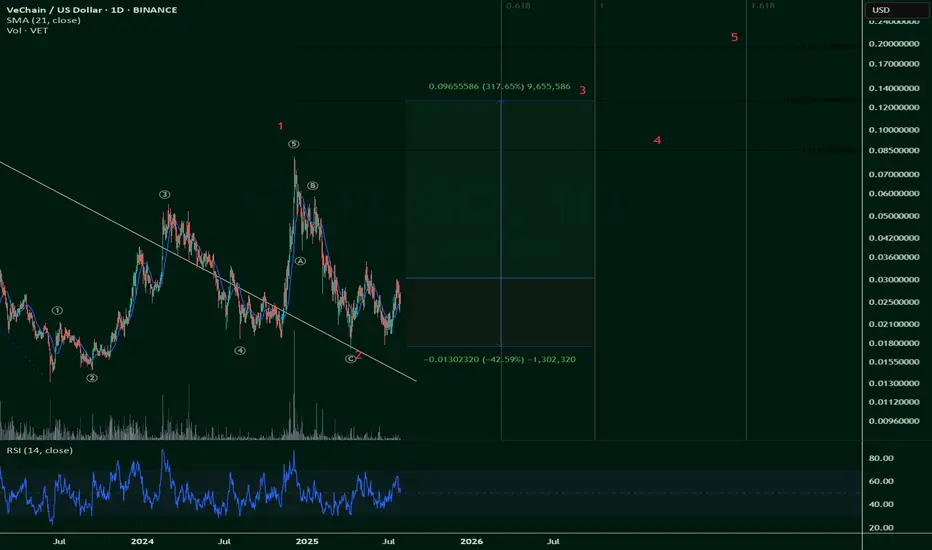
$VET Vetchain - A very generous Bullish scenario (ShortTerm)NOT FINANCIAL ADVICE
This is a very generous idea that considers the bullish scenario for $VET.
The risk/reward ratio is 7.5 (317% upside vs42.5% downside).
However, this is only due to the really high beta that NYSE:VET posits.
It's a risky trade, sure, but the rewards are sweet -- if this plays out.
#VET/USDT – Falling Wedge Breakout?#VET
The price is moving within a descending channel on the 1-hour frame and is expected to break and continue upward.
We have a trend to stabilize above the 100 moving average once again.
We have a downtrend on the RSI indicator that supports the upward break.
We have a support area at the lower boundary of the channel at 0.02310, acting as strong support from which the price can rebound.
We have a major support area in green that pushed the price upward at 0.02360.
Entry price: 0.02545
First target: 0.02613
Second target: 0.02739
Third target: 0.02889
To manage risk, don't forget stop loss and capital management.
When you reach the first target, save some profits and then change the stop order to an entry order.
For inquiries, please comment.
Thank you.

#VET/USDT#VET
The price is moving within a descending channel on the 1-hour frame, adhering well to it, and is heading towards a strong breakout and retest.
We are experiencing a rebound from the lower boundary of the descending channel. This support is at 0.02086.
We are experiencing a downtrend on the RSI indicator, which is about to break and retest, supporting the upward trend.
We are heading towards stability above the 100 Moving Average.
Entry price: 0.02160
First target: 0.02226
Second target: 0.02274
Third target: 0.02344

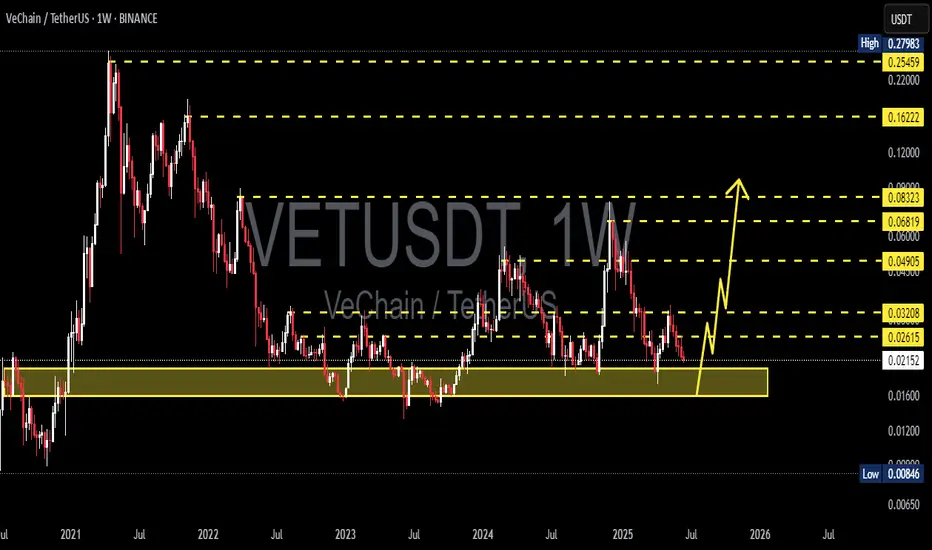
VETUSDT 1W AnalysisVET ~ 1W Analysis
#VET Buy back gradually from here if you still have confidence in this coin with a short term target of at least 20%+ from here.
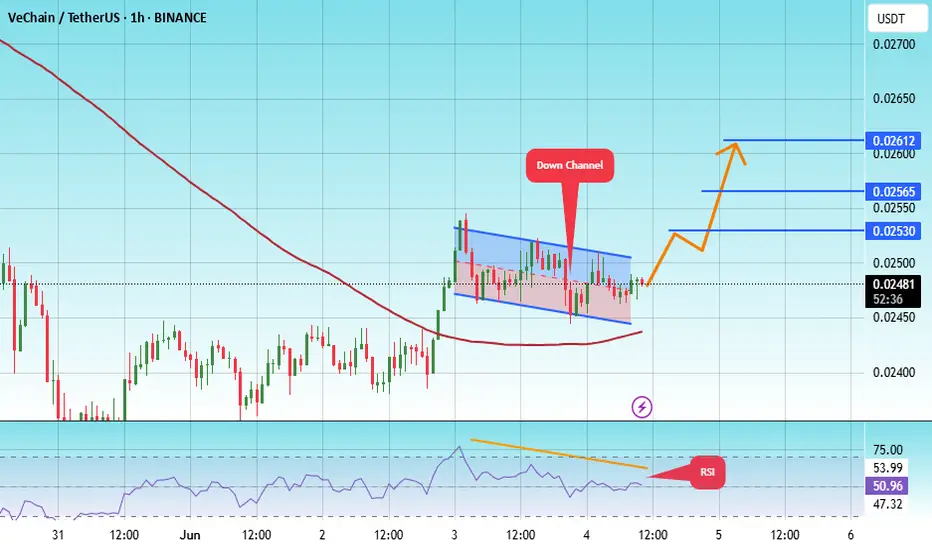
#VET/USDT#VET
The price is moving within a descending channel on the 1-hour frame, adhering well to it, and is heading towards a strong breakout and retest.
We are experiencing a rebound from the lower boundary of the descending channel. This support is at 0.02456.
We are experiencing a downtrend on the RSI indicator, which is about to break and retest, supporting the upward trend.
We are heading towards stability above the 100 Moving Average.
Entry price: 0.02480
First target: 0.02530
Second target: 0.02565
Third target: 0.02612
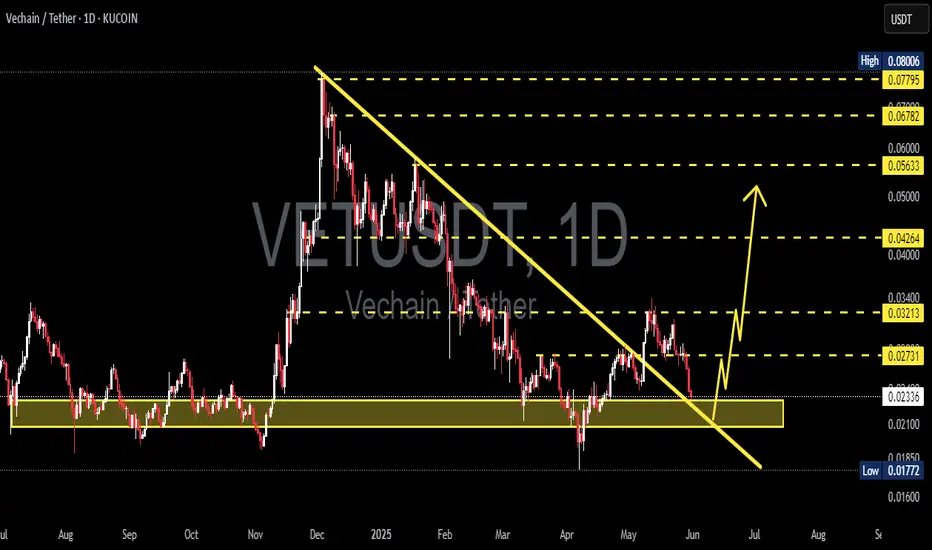
VETUSDT 1D Analysis VET ~ 1D Analysis
#VET This support block might be something you can start considering to start buying back from here with a short-term target of at least 10%++
#VET/USDT#VET
The price is moving within a descending channel on the 1-hour frame and is expected to break and continue upward.
We have a trend to stabilize above the 100 moving average once again.
We have a downtrend on the RSI indicator that supports the upward move with a breakout.
We have a support area at the lower boundary of the channel at 0.02750, which acts as strong support from which the price can rebound.
Entry price: 0.02936
First target: 0.03070
Second target: 0.03200
Third target: 0.03391

Check if it can break through 0.03779-0.04757 at once
Hello, traders.
If you "Follow", you can always get new information quickly.
Have a nice day today.
-------------------------------------
(VETUSDT 1W chart)
Support zone: 0.00440-0.101741
Resistance zone: 0.03779-0.04757
If it breaks through the resistance zone upward and maintains the price, it is expected that a step-by-step uptrend will begin.
Therefore, it is important to check whether there is support around 0.03779-0.04757.
-
(1D chart)
The key is whether it can maintain the price by receiving support near the M-Signal indicator on the 1M chart and rising to around 0.03779.
If it fails to rise, you should check for support near 0.02778.
If it falls below the 0.01741-0.2135 range, you should stop trading and watch the situation.
Therefore, the 0.01741-0.2135 range is an important support range from a short-term perspective.
-
The 0.03779, 0.04757, and 0.06603 points are important points as HA-High indicator points on the 1W, 1M, and 1D charts.
It is expected that a breakout trade will be possible when it breaks through the 0.03779 point, but since an important point is located before it rises much, the point to watch is whether it can maintain the price by rising above 0.04757 at once.
Therefore, when making a breakout trade, check if it rises above 0.04757, and if not, respond.
-
Thank you for reading to the end.
I hope you have a successful trade.
--------------------------------------------------
- This is an explanation of the big picture.
I used TradingView's INDEX chart to check the entire range of BTC.
I rewrote the previous chart to update it by touching the Fibonacci ratio range of 1.902 (101875.70) ~ 2 (106275.10).
(Previous BTCUSD 12M chart)
Looking at the big picture, it seems to have been following a pattern since 2015.
In other words, it is a pattern that maintains a 3-year bull market and faces a 1-year bear market.
Accordingly, the bull market is expected to continue until 2025.
-
(Current BTCUSD 12M chart)
Based on the currently written Fibonacci ratio, it is displayed up to 3.618 (178910.15).
It is expected that it will not fall again below the Fibonacci ratio of 0.618 (44234.54).
(BTCUSDT 12M chart)
I think it is around 42283.58 when looking at the BTCUSDT chart.
-
I will explain it again with the BTCUSD chart.
The Fibonacci ratio ranges marked in the light green boxes, 1.902 (101875.70) ~ 2 (106275.10) and 3 (151166.97) ~ 3.14 (157451.83), are expected to be important support and resistance ranges.
In other words, it seems likely to act as a volume profile range.
Therefore, in order to break through this section upward, I think the point to watch is whether it can rise with support near the Fibonacci ratios of 1.618 (89126.41) and 2.618 (134018.28).
Therefore, the maximum rising section in 2025 is expected to be the 3 (151166.97) ~ 3.14 (157451.83) section.
To do that, we need to look at whether it can rise with support near 2.618 (134018.28).
If it falls after the bull market in 2025, we don't know how far it will fall, but considering the previous decline, we expect it to fall by about -60% to -70%.
So, if the decline starts near the Fibonacci ratio 3.14 (157451.83), it seems likely that it will fall to around Fibonacci 0.618 (44234.54).
I will explain more details when the downtrend starts.
------------------------------------------------------

#VET/USDT#VET
The price is moving within a descending channel on the 1-hour frame, adhering well to it, and is on its way to breaking it strongly upwards and retesting it.
We are seeing a bounce from the lower boundary of the descending channel, which is support at 0.02600.
We have a downtrend on the RSI indicator that is about to break and retest, supporting the upward trend.
We are looking for stability above the 100 moving average.
Entry price: 0.02750
First target: 0.02838
Second target: 0.02908
Third target: 0.03000

VETUSDT 1D AnalysisVET ~ 1D Analysis
#VET Buy after successfully penetrating this resistant line with a short -term target of at least 10%+ from here.

VETUSDT 1WVET ~ 1W Analysis
#VET Buy gradually from here if you still have a Conviction on this coin with a short -term target of at least 20%+.

#VET/USDT#VET
The price is moving within a descending channel on the 1-hour frame, adhering well to it, and is on its way to breaking it strongly upwards and retesting it.
We are seeing a bounce from the lower boundary of the descending channel, this support at 0.02460.
We have a downtrend on the RSI indicator that is about to break and retest, supporting the upward trend.
We are looking for stability above the 100 moving average.
Entry price: 0.02620
First target: 0.02700
Second target: 0.02765
Third target: 0.02853

VeChain: Struggling…VeChain is struggling to stay above the key support at $0.018, but the anticipated low of the orange corrective wave ii should form above this red line – or may have already done so. Once the bottom is indeed settled, we expect the orange wave iii to break out impulsively, pushing well beyond the $0.08 resistance, where the entire orange five-wave move should ultimately complete the blue wave (iii). However, if VET falls below $0.018, the broader green wave alt. will reach a new bear market low (probability: 38%). Primarily, we consider wave as already finished.

VET/USDT BUY Hello friends
Due to the price correction, we have identified important supports for you that are likely to reverse the price, and you can buy steps according to the two specified ranges.
We have also identified price targets for you.
*Trade safely with us*

#VET/USDT#VET
The price is moving in a descending channel on the 1-hour frame and is expected to continue upwards
We have a trend to stabilize above the moving average 100 again
We have a descending trend on the RSI indicator that supports the rise by breaking it upwards
We have a support area at the lower limit of the channel at a price of 0.02666
Entry price 0.02950
First target 0.03080
Second target 0.03200
Third target 0.03300

#VET/USDT#VET
The price is moving in a descending channel on the 1-hour frame and is adhering to it well and is heading to break it strongly upwards and retest it
We have a bounce from the lower limit of the descending channel, this support is at a price of 0.02630
We have a downtrend on the RSI indicator that is about to break and retest, which supports the rise
We have a trend to stabilize above the moving average 100
Entry price 0.2700
First target 0.02810
Second target 0.02920
Third target 0.03064

VETUSDT 1WVET ~ 1W Analysis
#VET Buy gradually from here if you still have a Conviction on this coin with a short -term target of at least 20%+.

VET buy/long setup (4H)VET appears to be bullish.
We are seeing higher lows within the RANGE.
It can move from the demand zone toward the targets on the chart.
A liquidity pool is also visible on the chart, which we have marked.
A daily candle closing below the invalidation level will invalidate this analysis.
Do not enter the position without capital management and stop setting
Comment if you have any questions
thank you

VeChain: Down AgainAfter a brief recovery, VeChain is trending lower once more. The low of the orange wave ii from early February is approaching but shouldn’t be undercut for the structure of the orange impulse wave iii to remain intact. Soon, we expect a decisive and sustained breakout of this wave iii above the resistance at $0.08. As a mid-term target, the entire orange five-wave sequence should ultimately complete the blue wave (iii).

#VET/USDT#VET
The price is moving in a descending channel on the 1-hour frame and is adhering to it well and is heading to break it strongly upwards and retest it
We have a bounce from the lower limit of the descending channel, this support is at a price of 0.03165
We have a downtrend on the RSI indicator that is about to break and retest, which supports the rise
We have a trend to stabilize above the moving average 100
Entry price 0.03342
First target 0.03500
Second target 0.03712
Third target 0.03979

VTHO could spike 150% VTHO spike roughly 400% last Tuesday because of new token list to Korean exchange which catch my attention. I watched this chart for week and I believe this could spike another 150% if Big whales step in the buy zone or announcements.
I believe .007 is heavy resistance zone worst case if reject at, fail to reach, or BTC/ETH dump occur then I'll cut position and move on from this token.
VTHO must hold at around .005.
Just sharing my ideas. I do not provide financial advice and I am not a qualified licensed investment advisor. I'm just trading here as my side hustle.

#VET/USDT lONG Ready to go higher#VET
The price is moving in a descending channel on the 1-hour frame and sticking to it well
We have a bounce from the lower limit of the descending channel, this support is at 0.04570
We have a downtrend on the RSI indicator that is about to break, which supports the rise
We have a trend to stabilize above the moving average 100
Entry price 0.04670
First target 0.04860
Second target 0.05180
Third target 0.05546
