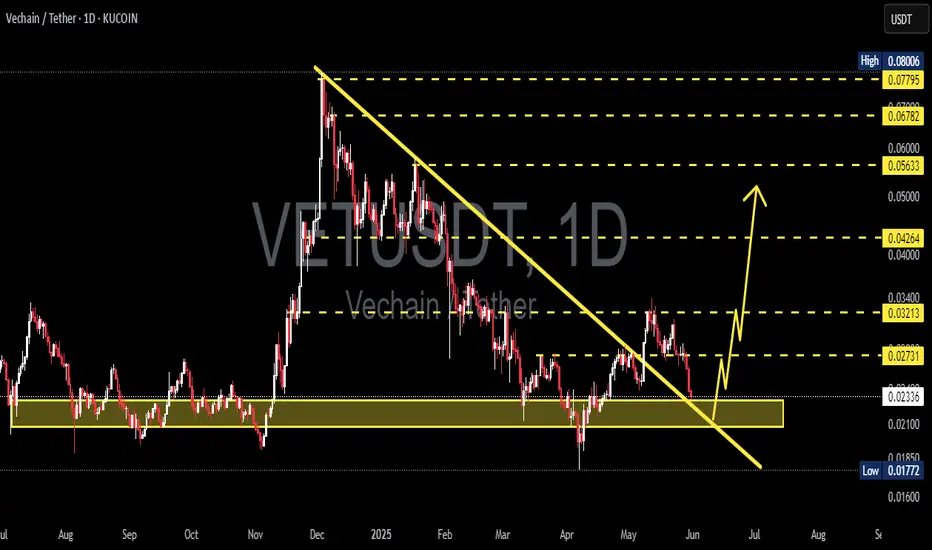
VET/USDT – Golden Pocket Retest After Breakout!🧠 Overview: Is VeChain About to Flip Bullish?
The 2D VET/USDT chart (KuCoin) is presenting a high-potential setup. After months of downward pressure, VET has finally broken above a long-standing descending trendline, which has been intact since early 2025.
Now, price is retesting a major support zone—which also happens to be the Golden Pocket of the Fibonacci retracement (0.5–0.618). This area is crucial for confirming whether this is a real trend reversal or just another fakeout.
---
🧩 Technical Structure & Key Levels
📍 Descending Trendline (Broken)
A clear breakout from the downtrend that started in February 2025.
First signal of a potential trend reversal.
📍 Critical Support Zone – Golden Pocket
Range: 0.02258 – 0.02390 USDT
Aligns with Fibonacci 0.5–0.618 retracement from recent swing low to high.
Acts as a historically strong horizontal support — now being retested after the breakout.
📍 Fibonacci Resistance Levels (Upside Targets)
Level Price (USDT)
Resistance 1 0.02840
Resistance 2 0.03235
Resistance 3 0.03745
Resistance 4 0.04265
Resistance 5 0.05185
Extended High 0.07786 – 0.08006
📍 Major Support (Last Line of Defense)
0.01772 USDT, the lowest level seen since late 2023.
---
✅ Bullish Scenario – Valid Retest & Reversal
If the Golden Pocket zone holds, we could see:
Continuation of bullish momentum
Gradual move toward:
🎯 0.02840 as the first resistance
🎯 0.03235 – 0.03745 as mid-term targets
🎯 0.04265 – 0.05185 if momentum strengthens
Potential formation of an Inverse Head & Shoulders pattern, signaling a strong reversal base
---
❌ Bearish Scenario – Failed Retest
If price fails to hold the 0.02258–0.02390 support zone:
We may see a move back down toward 0.01772 USDT
This would invalidate the bullish breakout (false breakout scenario)
The longer-term downtrend could resume
> ⚠️ Beware of a potential bull trap around 0.025–0.026 — price rejection here could signal a failed breakout.
---
🧠 Current Price Action Pattern
✅ Descending Trendline Breakout → early bullish signal
🔁 Golden Pocket Retest → now in progress, critical for direction confirmation
📈 Reversal Potential → watching for Inverse Head & Shoulders formation
---
💡 Conclusion
VET/USDT is at a make-or-break level. The breakout above the descending trendline is promising, but the current retest of the Golden Pocket zone is the real test for bulls. If this level holds, we could be witnessing the early stages of a trend reversal with multiple upside targets in play.
#VETUSDT #VeChain #CryptoBreakout #FibonacciLevels #GoldenPocket #AltcoinAnalysis #InverseHeadAndShoulders #TrendReversal #CryptoTechnicalAnalysis #SupportResistance #CryptoSignals
Vetusdtlong

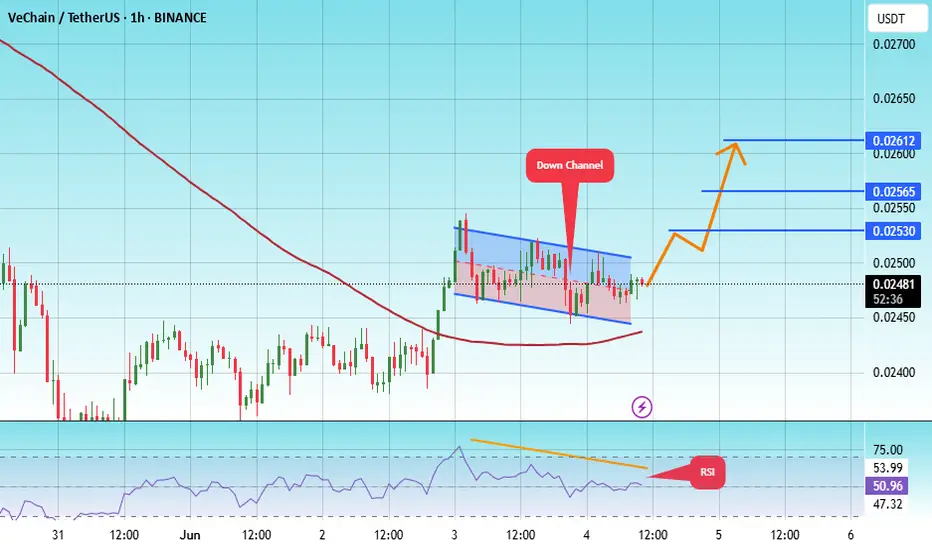
#VET/USDT – Falling Wedge Breakout?#VET
The price is moving within a descending channel on the 1-hour frame and is expected to break and continue upward.
We have a trend to stabilize above the 100 moving average once again.
We have a downtrend on the RSI indicator that supports the upward break.
We have a support area at the lower boundary of the channel at 0.02310, acting as strong support from which the price can rebound.
We have a major support area in green that pushed the price upward at 0.02360.
Entry price: 0.02545
First target: 0.02613
Second target: 0.02739
Third target: 0.02889
To manage risk, don't forget stop loss and capital management.
When you reach the first target, save some profits and then change the stop order to an entry order.
For inquiries, please comment.
Thank you.

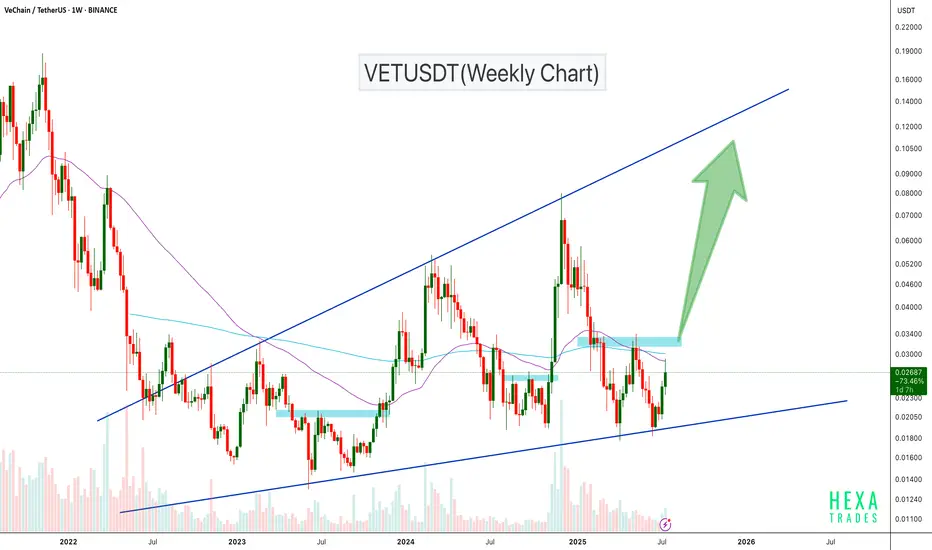
VETUSDT Ascending Broadening WedgeVETUSDT is trading inside a long-term ascending broadening wedge on the weekly chart, with price currently bouncing off major trendline support. After holding this support zone, VET is showing strength and approaching a critical resistance area around $0.033–$0.035.
A breakout above this zone could trigger a strong bullish rally, with potential upside targets in the $0.06–$0.10 range, and even higher toward the wedge top.
Cheers
Hexa
BINANCE:VETUSD NYSE:VET
#VET/USDT#VET
The price is moving within a descending channel on the 1-hour frame, adhering well to it, and is heading towards a strong breakout and retest.
We are experiencing a rebound from the lower boundary of the descending channel. This support is at 0.02086.
We are experiencing a downtrend on the RSI indicator, which is about to break and retest, supporting the upward trend.
We are heading towards stability above the 100 Moving Average.
Entry price: 0.02160
First target: 0.02226
Second target: 0.02274
Third target: 0.02344

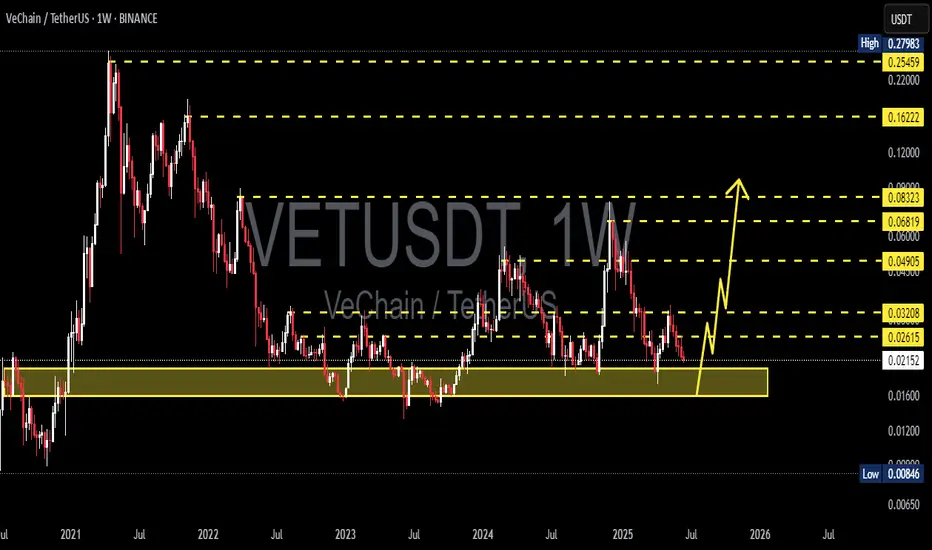
VETUSDT 1W AnalysisVET ~ 1W Analysis
#VET Buy back gradually from here if you still have confidence in this coin with a short term target of at least 20%+ from here.
#VET/USDT#VET
The price is moving within a descending channel on the 1-hour frame, adhering well to it, and is heading towards a strong breakout and retest.
We are experiencing a rebound from the lower boundary of the descending channel. This support is at 0.02456.
We are experiencing a downtrend on the RSI indicator, which is about to break and retest, supporting the upward trend.
We are heading towards stability above the 100 Moving Average.
Entry price: 0.02480
First target: 0.02530
Second target: 0.02565
Third target: 0.02612
VETUSDT 1D Analysis VET ~ 1D Analysis
#VET This support block might be something you can start considering to start buying back from here with a short-term target of at least 10%++
#VET/USDT#VET
The price is moving within a descending channel on the 1-hour frame and is expected to break and continue upward.
We have a trend to stabilize above the 100 moving average once again.
We have a downtrend on the RSI indicator that supports the upward move with a breakout.
We have a support area at the lower boundary of the channel at 0.02750, which acts as strong support from which the price can rebound.
Entry price: 0.02936
First target: 0.03070
Second target: 0.03200
Third target: 0.03391

#VET/USDT#VET
The price is moving within a descending channel on the 1-hour frame, adhering well to it, and is on its way to breaking it strongly upwards and retesting it.
We are seeing a bounce from the lower boundary of the descending channel, which is support at 0.02600.
We have a downtrend on the RSI indicator that is about to break and retest, supporting the upward trend.
We are looking for stability above the 100 moving average.
Entry price: 0.02750
First target: 0.02838
Second target: 0.02908
Third target: 0.03000

VETUSDT 1D AnalysisVET ~ 1D Analysis
#VET Buy after successfully penetrating this resistant line with a short -term target of at least 10%+ from here.

VETUSDT 1WVET ~ 1W Analysis
#VET Buy gradually from here if you still have a Conviction on this coin with a short -term target of at least 20%+.

#VET/USDT#VET
The price is moving within a descending channel on the 1-hour frame, adhering well to it, and is on its way to breaking it strongly upwards and retesting it.
We are seeing a bounce from the lower boundary of the descending channel, this support at 0.02460.
We have a downtrend on the RSI indicator that is about to break and retest, supporting the upward trend.
We are looking for stability above the 100 moving average.
Entry price: 0.02620
First target: 0.02700
Second target: 0.02765
Third target: 0.02853

VET/USDT BUY Hello friends
Due to the price correction, we have identified important supports for you that are likely to reverse the price, and you can buy steps according to the two specified ranges.
We have also identified price targets for you.
*Trade safely with us*

#VET/USDT#VET
The price is moving in a descending channel on the 1-hour frame and is expected to continue upwards
We have a trend to stabilize above the moving average 100 again
We have a descending trend on the RSI indicator that supports the rise by breaking it upwards
We have a support area at the lower limit of the channel at a price of 0.02666
Entry price 0.02950
First target 0.03080
Second target 0.03200
Third target 0.03300

#VET/USDT#VET
The price is moving in a descending channel on the 1-hour frame and is adhering to it well and is heading to break it strongly upwards and retest it
We have a bounce from the lower limit of the descending channel, this support is at a price of 0.02630
We have a downtrend on the RSI indicator that is about to break and retest, which supports the rise
We have a trend to stabilize above the moving average 100
Entry price 0.2700
First target 0.02810
Second target 0.02920
Third target 0.03064

VETUSDT 1WVET ~ 1W Analysis
#VET Buy gradually from here if you still have a Conviction on this coin with a short -term target of at least 20%+.

#VET/USDT#VET
The price is moving in a descending channel on the 1-hour frame and is adhering to it well and is heading to break it strongly upwards and retest it
We have a bounce from the lower limit of the descending channel, this support is at a price of 0.03165
We have a downtrend on the RSI indicator that is about to break and retest, which supports the rise
We have a trend to stabilize above the moving average 100
Entry price 0.03342
First target 0.03500
Second target 0.03712
Third target 0.03979

#VET/USDT lONG Ready to go higher#VET
The price is moving in a descending channel on the 1-hour frame and sticking to it well
We have a bounce from the lower limit of the descending channel, this support is at 0.04570
We have a downtrend on the RSI indicator that is about to break, which supports the rise
We have a trend to stabilize above the moving average 100
Entry price 0.04670
First target 0.04860
Second target 0.05180
Third target 0.05546

#VET/USDT #VET
The price is moving in a descending channel on the 1-hour frame and is expected to continue upwards
We have a trend to stabilize above the moving average 100 again
We have a descending trend on the RSI indicator that supports the rise by breaking it upwards
We have a support area at the lower limit of the channel at a price of 0.04111
Entry price 0.04407
First target 0.04640
Second target 0.04860
Third target 0.05090

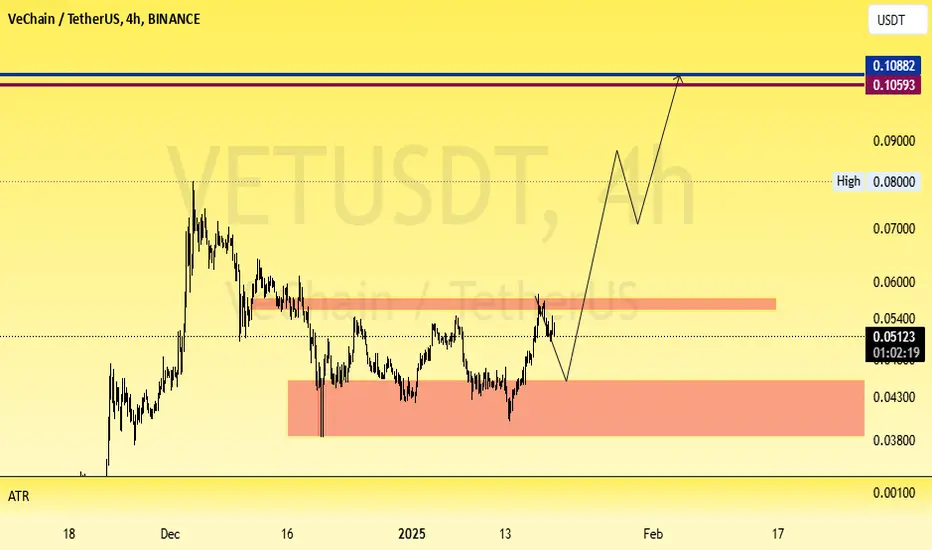
VETUSDT Wave AnalysisHello Friendes. According the chart of VETUSDT I expected to this movement and 0.105$ . This Way possible by cottrction but see that price.
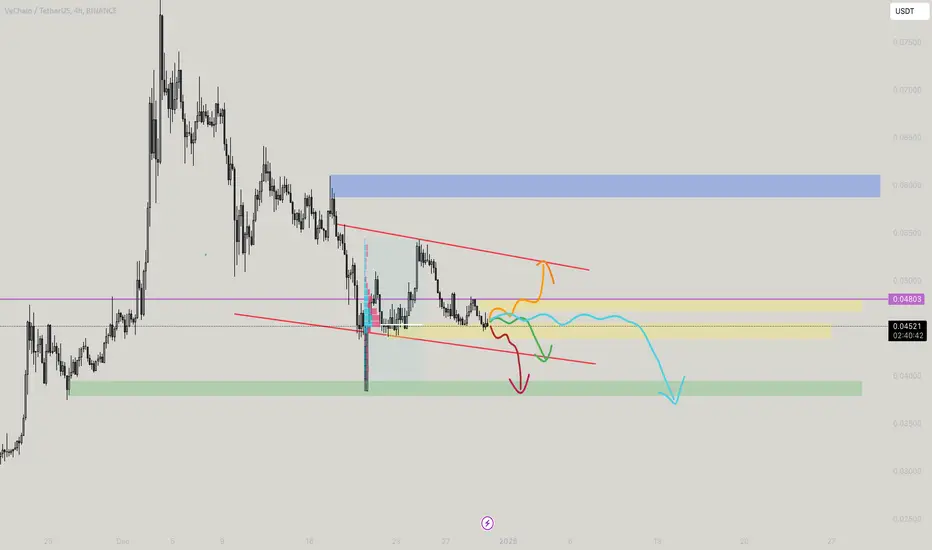
VETUSDT - Only Veterans Trade Please!VETUSDT - SO there are four possible scenarios of VET as there are tight squeeze of the yellow boxes. For TL;DR - Wait for the green box in action for clear path, For daredevils, Orange marked the scalps end to the path of the channel marked, The red marked (horizontal line) is fib pockets and would play a good role here. The cyan line marked shows if tight buyers and sellers in action, expect strong attraction to 0.4534. and eventually bleed, Green shows normal fall till the red line to retest if following channels, and my most loved green box is what i wait because DOM is stacked for the orders to filled. The blue box is a point if green line gets bonked aim for the targets on it.
#VET/USDT Ready to go up#VET
The price is moving in a descending channel on the 1-hour frame and sticking to it well
We have a bounce from the lower limit of the descending channel, this support is at 0.04900
We have a downtrend on the RSI indicator that is about to be broken, which supports the rise
We have a trend to stabilize above the moving average 100
Entry price 0.05160
First target 0.05317
Second target 0.05633
Third target 0.06000

VETUSDT 1WVET Update ~ 1W
#VET If you still have Conviction on this coin,. Buy gradually within this support block,. This coin is still in a very bullish trend.
