$via Viacoin entry signal. 4x potential. The technicals of this chart are amazing; one of the best set ups I've seen in this entire space, and this coin has great fundamentals making it a very profitable time to enter. There is a hidden bullish divergence indicated by the stochastic indicator which gives me confidence that this support at 15400 level is very strong. The momentum indicator indicates a breakout from this humongous descending wedge around 12/14/2017, once we breakout of this wedge we will see a dramatic increase in price and volume. The risk reward ratio is very good, I highly recommend a long entry at these levels.
Viacoin

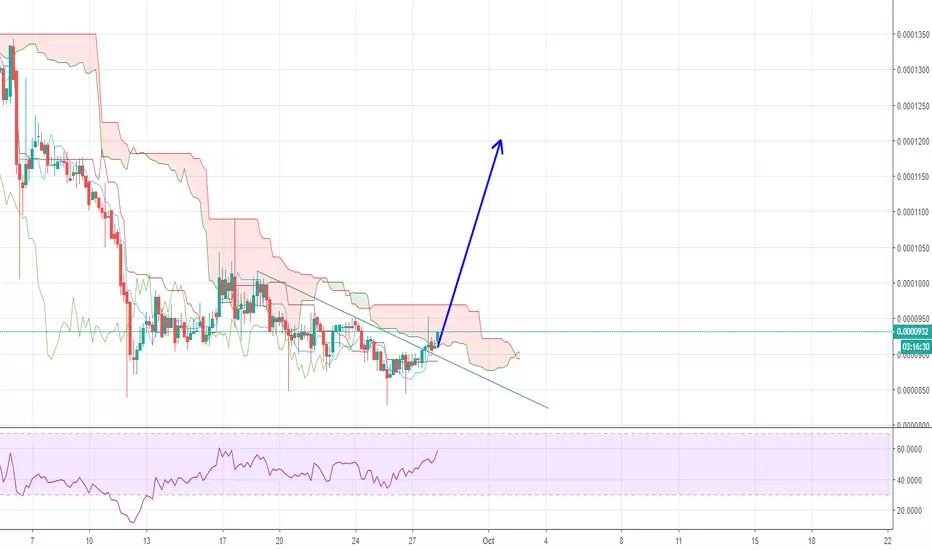
VIA - Viacoin small Ascending TriangleSee the 4h chart, possible quick pump to Target 1 and Target 2.

VIA/BNB cup and handle Bullish reversal pattern with the cup formed and now the handle is forming.
I don't know anything fundamentaly but if it breaks bellow 0.618 support it fill form a head and shoulder pattern and will invalidate this pattern.
So keep an eye on this coin it can go boom in the next months.

Viacoin next week forecastVIA weekly scenario:
Accumulate between 1290-1330
Targets: 1450; 1600; 1770
Stop loss: 1115

$VIA #VIABTC Extensive Technical Analysis - Day Trader ExplainsHello Lads and Ladies,
Welcome back to the TJs Daily TA Session, today requested by the traders of the Elite Trading Group, we will be taking a look into the pretty amazing and hardly to analyse chart of VIA/BTC.
This chart has been shared even around twitter and people mostly simply make fun of it. My goal is definitely to make crypto understandable and to teach TA, even on pretty harsh charts like these.
I would say, if you first did not know what to do and at the end you know, you have to leave me a like :D
Alright, lets begin.
First, we had a pretty strong downtrend since the month of September. We have seen multiple touches in the green rectangle which symbolises our pretty string "buy-zone" and a strong support. Here I see a common mistake most people would do. The very first market structure looks like a head and shoulders at support and people would short it. I would give a normal head and shoulders formation a chance of 15% for a successful shorting position AT THE BOTTOM and AT SUPPORT. Please, keep in mind, HnS and iHnS are REVERSAL patterns and not continuation patterns.
The next most eye-catching event after the failed HnS pump, is a huge wick upwards and this a so-called fake-out. This is not the first time something like this has happened, yet this time we have a very strong price increase as the continuation after it. This continuation is seen where the price consolidates with a channel, indicated in bright blue. in this channel it is taking a multiple ups and downs, yet strongly respecting the uptrend and its angle, even by having multiple tries to breakout. Inside of this channel we can see the "triple-valley" continuation pattern. Even at the end we had a very nice breakout..
Lets take a look a deeper look at the breakout after the triple valley continuation and what has followed. The interesting things start happening around here.
This breakout had a beautiful increase of double digits, YET re-tested the previous resistance as a form of support. this support was holding and after this confirmation, it had its third push and continued rising.
This retracement went to exactly the 78.6% line, which is not a very common, nor string number on and for cryptos. Anyhow, this does not matter for us because it pumped, so it successfully tested 78.6% and the previous resistance as support.
Continuing with the second big push and the situation we have right now. We have had the next beautiful increase, YET need a retracement for being able to increase more. Therefore, we are using the fibonacci tool to see possible areas of retracement. Here normally the 61.8% play a major role AND would be at the previous very big support from where it has been broken down in September. The price point we are at right now is the price of the 50% retracement, which is as well a strong point for a bounce. ANYHOW, we have seen already that VIA/BTC is not very much respecting the 50 and 61.8% lines, rather bounced from 78.6%. This might be the case once again and it would basically mean for us a further safe stagger point.
But TJ, why stagger there? And how much?
we are using Fibs to see potential retracements without breaking the trend. Adding to it, we like having these points at some kind of support or resistance lines or trend lines from previous structures.
Our 50% order is simply to have an entry. The 61.8% is strong previous support and would be touching the uptrend channel resistance. The 78.6% is possible, likely, maybe even expected because it would confirm the uptrend support of that channel once again, which has happened many time before and then simply continue rising more and more up. The LAST stagger would be at the orange line, which is has been a strong resistance while the triple valley has been forming and then it got confirmed as support. We MIGHT head down to test that support again, would double bottom there, have a perfect entry and make heaps of profits afterwards.
Indicators are for me all pretty high, pretty overbought, pretty much calling a retrace. Now.. these are still so much up even with already a 50% retracement.. therefore 61.8% might not hold again and we will either re-test the channel OR the orange support.
This is how I will make my trade
VIA/BTC Binance
BUY "x"1300 - 2"x" 1257 - 6"x"1197 - 18"x"1119
Targets (previous staggers) - 1370 - 1475 - 1570 - 1700 - 1850
Stop Loss CLOSE below 1099 (4h, Heikin Ashi)
Like and Follow me and you will find this page interesting because I am a TA expert and professional day trader in crypto since 2012 that does daily updates and new posts about the hottest and most discussed coins.
This is as always a delayed post, if you are interested in first hand news, feel free to join our group,
Cheers, TJ


$VIA Might Get's Real Violent, but How High?VIA is rangked #259 on coinmarketcap and having 23.1 mill coin supply and 23.09 is on circulating. Via is SECURE MICROPAYMENTS and has a 24 second block time, low transaction fees and a strong network hashrate. This makes Viacoin perfect for making fast and secure (micro)transactions.
Interesting concept of VIA actually attracted to trader which they successfully gaining demand and right now has listed on Upbit, Bittrex, Poloniex and Binance. Chance to get bigger exposure is quite possible.
At the moment I see fractal on VIA chart which make sense that we can bounce anytime from here.
As RSI is below 50 level, is quite a lot of room to grow but skeptically is not really enough to gain momentum. Even so, i'm looking to accumulate the price all the way down, minus evey 500 sats. And looking to put my sell order at least around my 0.382 fib level, it's 25945 sats. The possibility is still huge as you can see the recent cycles.
Due to volatility, I really encourage you guys to DYOR and Trade safe!

VIA Coin Trading AdviceBuy Price: Yellow Line
TP: Green Lines
Invest Suggestion: 5-10 Percent
Profit Expectations: 5, 10 or >20 Percent
Just hold and watch. All targets will be reached within 24 to 72 hours as my prediction. But it's recommended to hold it for 6-7 days if any target not reached. Sell when you got some profit. I am sure, you will be get nice profit. Good Luck!
Looks Good? Leave a like, share and tell me in comments if my trading advices are working for you or I am just wasting my time and effort.
Thanks for visiting.

Daily Bullish Signal #VIA #VIABTC (28-09)#VIA (VIA/BTC)
Buy : 925
Flash Sell : 950
Short Sell : 975
Long Sell : 1000-1050-1100-1150-1200
Stop : 850
Follow me for more signals daily
PM me if you need more services
Viacoin is good at pumping from low MFIViacoin MAN uses MFI instead of RSI because it also takes into account volume and can be a little more reliable
As you can see, Viacoin enters uptrends after it dips in MFI, in a lot of cases, it doesn't even have to hit low ranges, a dip is enough to add fuel to the fire.
Something really big is coming.

The Bottom is inThe Viacoin Bottom is in.
Viacoin Is showing ironclad support on the US Dollar. Bitcoins bottom is also in at 6k.
Buy $VIA now before 40k comes.
Scalp trading isn't really worth it, just buy VIA and watch it pump


Buy the dip sir.Now is a great chance to get $VIA at not only under $1 but for $0.62
Now is a great time to get a discount on $VIA, for example, this is a chance to buy additional coin for 45% less, and for most investors who bought in when RNR fulfilled the prophecy it is a 30% discount.
The dip is noise, you can see DOGE holding.
Get in now if you are not already
Be a man.

And here you are selling your last coins$DOGE is doing fine and people are panicking.
A sea of green will flood the world soon.

Viacoin MAN has had your backThere is strong Viacoin "V" support on bitcoin, as you can see in the V shaped angles.
Support is everywhere

$VIA Long The dev announced a new wallet release twitter.com
Also, there was some positive news lately twitter.com
And, of course, the dev's memes bring more awareness to the coin.
Viacoin is trading in the range around 0.000125-0.000138
On a higher time frame, it's on Dec 2017 levels, which makes the risks lower
After the release, it can break the range high levels and go a bit higher

VIA profit targetsVIA isn't really trending now and got stuck in a channel between 1250 and 1380. Knowing that already gives plenty of opportunities for swing trading. But what we should be aware of it that once it breaks 1380 resistance it may go up by ~10% pretty fast. The next target at 1735 (25% profit) is also pretty real but should be the last one as it has a lot of vlume in resistance. So I suggest putting an alram for that price and be ready to jump in. Just be aware of a possibility for a bull trap like it happened on 29th of August.
Day chart shows SR lines.
I am not a financal adviser. Trade on your own risk.


The prophecy has been fulfilledRomano did it. He at the ass and is more than likely loving it. The moment he arrived in Vegas BTC pumped. This is not bullshit you can time stamp it. The minute his tongue slapped Brenna sparks chocolate starfish $VIA market buys flooded this is the omen that was spoken. $VIA will lead the pack of the new alt season. Alt season will lead to the real BTC bullrun, one that will dwarf an ETF run.
The Viacoin chart is so easy to do. Just buy it and let it pass all those bars.
This same chart applies to BTC
If you want you can get aroused and watch it. It's fun to watch yourself and your profits grow.

This angus is puckered tightDoesn't look like its likely(or even possible) that the legendary buy wall will fall and with alts and BTC prepping for big moves, do you really think that $Viacoin will stay on this floor? Also keep in mind the prophecy is being fulfilled by our savior in Vegas as this is being posted


This chart looks really nicePretty much sharing this for the aesthetics of this #Viacoin Chart for is 4th Birthday. $BTC performed very well today. We finally went bullish. This is a pretty good day. Happy Birthday #Viacoin! $VIA

$1k to $100k Challenge - Day 2 Trade 2 - VIAHello all! Thanks for following my personal challenge. Here we go Day 2! I am attempting to turn $1000 into $100,000 by the end of the year by day trading altcoins.
Day 1 was a success:
Day 2 and here is my trade #2
Starting Bankroll Day 1: 0.16 BTC
Starting bankroll Day 2: 0.0168
I invested half of my bankroll into VIA on Binance.
Bought 499.10 at 1671 satoshi
Total BTC invested: 0.0833996
Sell target is: 1755 for 5% profit
Your comments, agrees and disagrees are always welcome and appreciated.
Thanks for stopping by and have a great day!
