VIA coin buy opportunity, 2 profit targetsI expect quick projecion to 0.00053 in 3 days.
For those with cohones 0.001 in 2 weeks.
Buy now or try hunt 0.00026
Stop loss: 0.00025
If nothing happens in 3 days w8 for stop loss or any profit
Viacoin

VIABTC Long Position (100% profit potential)ViaCoin is looking to go upwards according to the daily channel.
It bounced off a strong support level at 00017000 and both daily and weekly candle chart show an upward trend.
The 24 hour volume while making this analysis is 244.67 BTC, this and the other indicators tell me that there is room for GROWTH.
So I am opening a LONG position with a stop loss 20% under my buy in.
Trade Active:
00038000
Target (Based on my own view):
00043000

Viacoin 31 December 2017$VIA So, I've been posting about this one lately and it made some nice profits for us already, as we see in the chart and if you joined us on the journey!
It's fighting a pretty big resistance right now, so there are some scenario's in play here.
Scenario 1: Drop down due to the red arrow to the earlier support trend line, making the ascending triangle before we move on.
Scenario 2: First line we'll see as support and jump up from there.
Scenario 3: Can't hold either of these lines and we'll fall back to around 28-30K.
My guess is that it's not over yet and we'll face the 40-41K zone pretty soon. Still some nice profits to be made.

waiting for flythere is a big support area and here is a the resistant on 22k if it break that resistant it will fly to 32k area

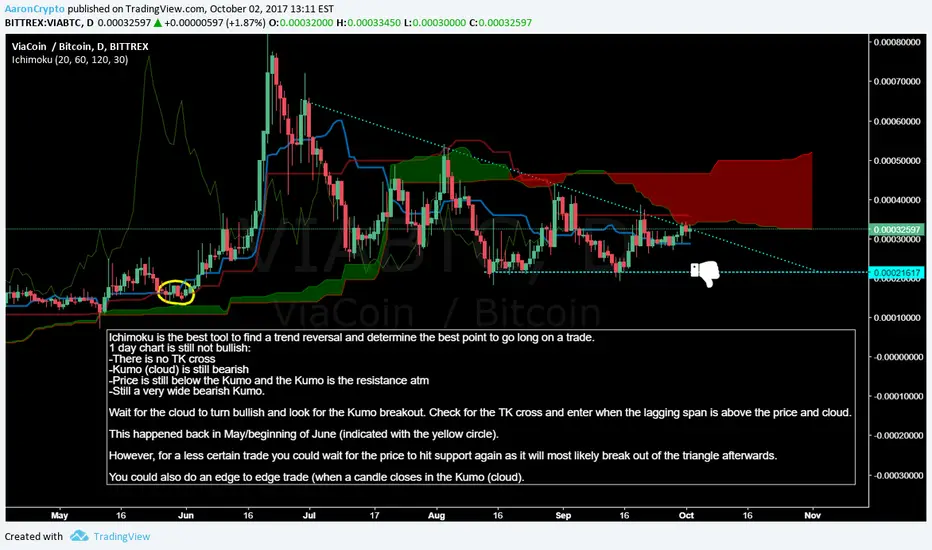
via is gearing upVia indicators look like on July. After 6 months finally trend is upper side on the ichimoku cloud .


VIA for the next couple of weeksVIA has been consolidating for good 160 days and is on my watch list. There are two scenarios what might happen with the coin which also depends on the current market situation, if we will continue being bullish or if the bubble will burst. Definitely keeping this coin on my watch list.

VIA/BTC Update Hi hi hi ! This is just a quick update seeing as we reached the accumulation zone !
SKKKRRRRR BOM !
If you set buys in that area , congratulations !
Via has started a small uptrend , if it continues I can see it following the green arrows , if not , it will fall back into the accumulation zone bouncing off support . Manage your R/W accordingly , good luck !
My next target is the blue box ( .00025 - .00026 )
Happy trading !


VIAcoin. Ready to explose?VIA coin is like the Grandson of bitcoin, Son of Litecoin and brother of Vertcoin, Grostleslaklkndslaknccoin and other similar coin. All this siblings coin have had huge pump in the last times. This is why the technologies developed on top of these are experiments that could be adopted by the grandfather Bitcoin if they works.
Via Coin developers seems to be hardworkers, they follow the roadmaps and make interesting implementation. Next one that will be adopted is the anon implementation (end of december if I remember well). That mean that you can do what you want with your VIA without that anybody knows it (also bad things ... ooohhhh). Nothing revolutionary but significative for this type of cryptos.
You can check the characteristics of VIA with the other siblings and parents and you can see that there are other advantages.
Look at the charts.
we have some featuring that make me wet.
The deeps are gradually less deep. I consider the deep as the "real value" of the coin. "real" why we are speculating. The high are phase of overspeculation.
Now the deep are always less deep and the high are blocked by the resistance line.
If the deep continue to follow this trend it means that they are growing exponential. That mean that for each quantity of time the real price of the coin is growing always faster. Actually the price follow the lines that you can drow passing through all the deep = growing without overspeculation)
Stoch show us that the deep are less oversold (or better the coin stay in a oversold phase less and lesser time). RSI confirm that we are waiting less and less that VIA drop to buy it again and in the last time we are buying more VIA and is slowly increasing in the last month. but we are far away from the overbought phase.
MACD is crossing the line.
Finally i can just see bullish signals. I think he is ready to explose and this time can break the resistance with the next bull run. Maybe we have not so much time to buy some other VIA a reasonable price.
Intuitive Trading (I m not a professional).
Reduce risks of big loss with a portfolio diversification always.
BIO

Viacoin pusing on upper resistance band here!Been keeping my eye on VIA coin for some time now and there are some new developments coming from the Dev this week. It looks really strong and there has been solid buying activity on Polo all day. if this breaks here in the next couple of hours i expect a similar rise to that which we have seen with VTC and GRS. Watch this space.
Buy signal $1.85
Stop loss $1.61
Take Profit $2.50 +


Via Trade Idea #VIA looking in Massive #ConsolidationZone.
Price strugling to break the #AscendingChannel.
we Have over 150% profit oppurtunity for an #MidTermTrade.
Below #18K is a #SafeEntry.
#FundamentalAnalysis
#Via New #RoadMap Releasing Soon. Also #LightningNetworkDeamon Coming from #DevolpersTeam.
#VIA will also feature a reworked #P2PNetworkCode to enhance to #Bandwith #BlockValidation as well as #ProcessingSpeed


$VIA is going for it again.Viacoin looks good for short term profits.
You can follow me on twitter if you want more charts and insights: twitter.com/taproofficial
Disclaimer: My posts are just personal thoughts and not advises. I dont suggest you to do or not do anything. Do your own research. Trade responsible.
