VaderAI by Virtuals Explodes, 1,379% Profits Since Its 7-AprilBoom! Crazy growth it seems is not only ultra bullish but truly bullish confirmed. VADERUSDT already grew an astonishing 1,379% in a little over two months and the chart shows potential for additional growth.
This is what I am talking about but of course this pair exceeded all expectations, this is only the start, many altcoins will be doing the same in the coming months. This type of growth will be normal mark my words.
Some pairs always move ahead. On the left side of the chart we have the bear market. March marks the end of the bearish trend. April marks the start of the bullish phase.
The bullish phase will continue and can go for many months. There is no limit to how far up prices can go. Truly, there is no limit. Once the market enters the price discovery phase, the only choice we will have is to watch and be amazed. Many lives can change forever with what we are about to experience. Position yourself in the best possible way you can.
This is truly the opportunity of a decade, maybe a lifetime. Yes, there will be many bull markets in the future but the cryptocurrency market will be more mature, we don't know exactly how these opportunities will develop but we do know that now, what we are seeing now is the change of an era; money going from tightly controlled, to being free and accessible to all.
Money used to be owned by a few banks. Now money is owned by the people. With people owning the new money supply, the world will enter a period of abundance and growth. While money in the past was being suppressed and inflated on purpose, money will now be shared and made available on purpose.
While the previous system was designed to create scarcity for the majority, power and control for the few; the new system is intended to work for you. Whatever you want you can achieve, you can create your own money now. Nobody can stop you. That's what Cryptocurrency can do.
Bitcoin is the evolution of money.
Crypto is the evolution of finance.
It is already here and it is here to stay.
Trade Crypto, buy Crypto and hold Crypto long-term, you will be happy with the results.
Namaste.
Virtualsprotocol

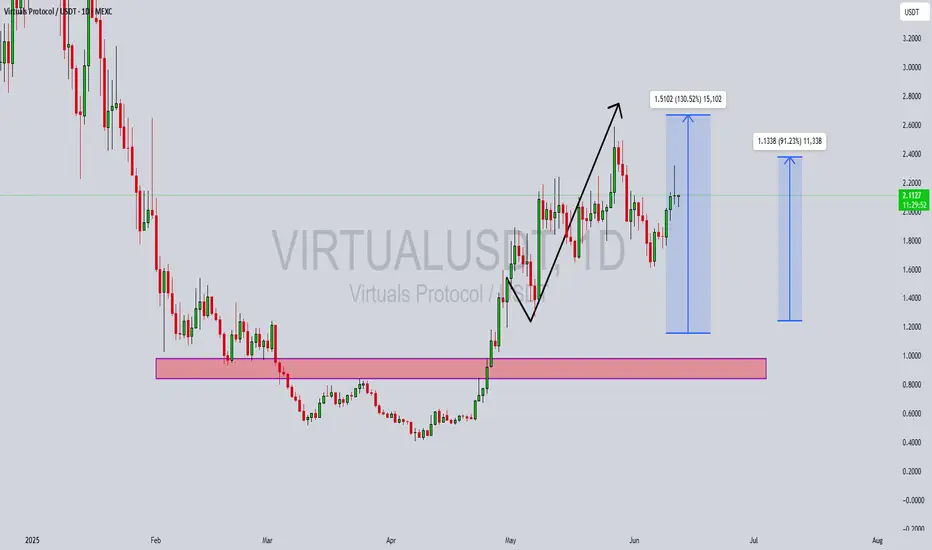
VIRTUALUSDT Forming BullishVIRTUALUSDT is showcasing a powerful bullish structure after a prolonged accumulation phase near the $0.80 to $1.00 support zone. The breakout from this accumulation base has resulted in a parabolic move, confirming a strong shift in trend. Currently, the pair is forming a bullish continuation pattern, with high volume inflows suggesting increasing investor confidence. The recent consolidation above previous resistance is a positive signal for trend continuation, and technical targets show potential for a 120% to 130% upside in the coming sessions.
The setup aligns with classic market psychology, where a strong move is often followed by a period of profit-taking before the next leg higher. The technical projection zones around $2.60 to $3.00 are realistic based on the depth of the prior impulse move. Furthermore, VIRTUALUSDT is gaining traction in the DeFi and virtual asset space, with its protocol generating buzz in 2025's altcoin resurgence. This combination of narrative and chart structure makes it a potential top mover.
From a risk-reward perspective, this pair presents a favorable long entry with minimal downside if stop losses are positioned just below recent swing lows. As the broader market recovers, strong technicals like these could deliver amplified gains compared to average tokens. It's worth noting that smart money often positions itself before explosive runs—and this chart suggests accumulation has already occurred.
Investors and swing traders should keep this pair on their radar as it continues to carve higher highs and higher lows. If momentum persists, VIRTUALUSDT could become one of the standout performers in the altcoin space this quarter.
✅ Show your support by hitting the like button and
✅ Leaving a comment below! (What is You opinion about this Coin)
Your feedback and engagement keep me inspired to share more insightful market analysis with you!
$VIRTUAL Breakout Alert!!A clean inverse head and shoulders pattern has just triggered, and we’ve already seen a strong breakout above the neckline!
This is a classic bullish reversal signal, and the chart is screaming momentum
🟢 Key Levels:
• Entry around the neckline breakout
• Targets lined up: $2.36, $2.59, and $2.89
• SL below right shoulder: $1.91 for risk control
The 200 EMA is now sloping upward — further confirmation of trend shift!

VIRTUAL TA Masterclass — Elliott Wave Meets Gartley HarmonicVIRTUAL has been on fire! Printing a clean 5-wave Elliott impulse with a +431% run in just 33 days. But after every strong trend comes a healthy correction, and that’s where we likely are now. Trading below key resistance and showing signs of exhaustion. The question: Where is the next high probability trade setup?
Let’s break down what the chart is telling us.
🧠 Structure Overview
Wave 5 peaked at $2.2169
Wave A dropped -25%
Wave B bounced +30%
Currently: VIRTUAL's trading under the $2 psychological level and weekly open ($2.0358) → signs of momentum cooling
A corrective Wave C is likely underway, and all signs point toward a very specific zone.
⚠️ Liquidity Dynamics
The longer VIRTUAL grinds sideways near $2.00 without showing real momentum, the more vulnerable late long positions become:
Retail traders are buying resistance
SLs are likely clustered just below Wave A’s low
This creates a liquidity pocket waiting to be swept — perfect fuel for Wave C
🔍 The $1.58–$1.47 Support Cluster: 14 Layers of Confluence
This zone isn’t guesswork — it’s loaded with technical overlap:
1️⃣ 1:1 Trend-Based Fib Extension of Wave A → $1.573
2️⃣ Monthly Open → $1.5354
3️⃣ 0.382 Fib Retracement of the entire rally → $1.5295
4️⃣ Bullish Fair Value Gap → $1.57–$1.53
5️⃣ Anchored VWAP from ATH → ~$1.46
6️⃣ Anchored VWAP from Wave 3 → ~$1.46
7️⃣ 0.618 Fib Speed Fan Support (~end of May timing)
8️⃣ 4H 233 SMA → ~$1.52
9️⃣ 4H 200 EMA → ~$1.52
🔟 Daily 200 SMA → $1.5251
1️⃣1️⃣ Weekly 21 SMA → $1.462 (reinforces the VWAP zone)
1️⃣2️⃣ Declining Daily Volume → momentum weakening
1️⃣3️⃣ Liquidity Pool below Wave A → likely to be swept
1️⃣4️⃣ $2 = Golden Pocket Resistance + Psychological Barrier
🔴 Short Trade Setup (Active as Long as SFP Holds)
For those favouring downside continuation toward the Wave C target, a short setup is in play:
Entry: Weekly open retest around $2.0358
Stop-loss: Above SFP high at $2.143
Target: 1:1 Trend-Based Fib Extension of Wave A → $1.573 or the Swing Low of Wave A at $1.647
R:R ≈ 1:4 — a solid, well-structured short opportunity
As long as price remains below the SFP and the $2.00 golden pocket resistance, bears maintain control.
🟢 Long Trade Setup
Entry: Ladder between $1.58–$1.47
Avg. Entry: ~$1.53
SL: Below $1.40
TP1: $1.88 (local resistance) → R:R ≈ 1:2.5
TP2: $3.33 (0.618 Fib of entire bear market) → R:R ≈ 1:12
👉 Bonus TP for Harmonic Setup: 0.618 Fib of CD leg
✨ Bonus Confluence: Potential bullish Gartley Harmonic in Play
VIRTUAL is also forming a valid Gartley harmonic pattern — one of the most reliable reversal setups in classical trading theory.
🔸 XA: B retraced to 0.602 → ✅ (criterion: ~0.618)
🔸 AB: C retraced 0.87 → ✅ (valid range: 0.382–0.886)
🔸 CD: Projected to complete at 0.786 of XA → ~$1.474
• CD is a 1.356 expansion of BC
• AB ≈ CD symmetry is valid
• TP = 0.618 retracement of CD leg
This adds even more weight to the $1.47–$1.53 buy zone.
📘 Educational Takeaway
The best setups don’t rely on one method — they align multiple disciplines. Here, we have Elliott Waves, Fibonacci retracements, anchored VWAPs, volume structure, moving averages, time symmetry, and now a harmonic pattern — all pointing to the same opportunity. Most traders never wait for alignment. That’s why most lose.
💬 Final Words
✍️ Smart trading isn’t about always being in a trade — it’s about being in the right one at the right time.
While others FOMO at $2, you wait for the right opportunity to come to you — where structure, liquidity, and probability all shake hands.
The patient are rewarded. Always.
___________________________________
If you found this helpful, leave a like and comment below! Got requests for the next technical analysis? Let me know.

Phemex Analysis #81: Pro Tips for Trading VIRTUAL In the rapidly evolving landscape of cryptocurrency, Virtuals Protocol ( PHEMEX:VIRTUALUSDT.P ) has emerged as a notable player, particularly within the AI and metaverse sectors. As of May 16, 2025, VIRTUAL is trading at approximately $1.85, with a 24-hour trading volume of around $280 million and a market capitalization of $1.21 billion. This positions VIRTUAL as a significant asset within the crypto market, reflecting growing investor interest.
Recent developments have further bolstered VIRTUAL's prominence. The introduction of veVIRTUAL, a vote-escrowed token system launched on May 13, 2025, incentivizes long-term staking and governance participation. Additionally, expansion to the Solana blockchain and partnerships with initiatives such as the AI Hackathon highlight Virtuals Protocol's commitment to cross-chain development and community engagement.
Given these dynamics, traders are keen to understand potential trajectories for VIRTUAL's price movement. Let's explore several possible scenarios to guide your trading strategies.
Possible Scenarios
1. Bullish Continuation
VIRTUAL has demonstrated impressive growth, achieving a 234% increase over the past month. If this momentum continues, reinforced by ongoing developments and increased adoption, VIRTUAL may test critical resistance levels around $2.50 and potentially approach its all-time high of $5.07.
Pro Tips:
Entry Strategy: Consider entering positions on confirmed breakouts above key resistance levels such as $2.16, particularly if accompanied by high trading volume.
Risk Management: Implement stop-loss orders near recent swing lows, such as $1.76, to protect your positions from sudden market reversals.
2. Consolidation Phase
After significant price movements, VIRTUAL may enter a consolidation phase, trading within a defined range as the market absorbs recent gains. Such periods can provide opportunities for range-bound trading strategies or accumulation for long-term growth.
Pro Tips:
Identify Key Levels: Monitor key support and resistance zones, notably $1.27 (support) and $2.16 (resistance), to effectively execute buy and sell orders within the trading range.
Patience: Avoid overtrading during consolidation phases. Wait for clear breakout signals before making significant trading decisions.
3. Bearish Reversal
Despite recent successes, external factors such as broader market downturns or unforeseen negative news could trigger a bearish reversal. If VIRTUAL falls below critical support levels, notably $1.50, further declines could follow.
Pro Tips:
Short Positions: Experienced traders might consider short-selling strategies to profit from potential declines, ensuring they maintain a clear exit plan.
Long-Term Accumulation: For long-term investors, significant price dips could represent buying opportunities. Watch key support levels such as $1.27, $1.00, and $0.67 for potential entry points to accumulate VIRTUAL at lower valuations.
Conclusion
Virtuals Protocol's innovative approach to integrating AI within the blockchain ecosystem positions it as a compelling asset in the crypto market. While recent developments and price movements suggest potential for continued growth, traders must remain vigilant. Employing sound risk management and staying informed about ongoing developments is essential. By considering the scenarios outlined above, traders can navigate VIRTUAL's market dynamics with greater confidence and strategic insight.
Pro Tips:
Armed Your Trading Arsenal with advanced tools like multiple watchlists, basket orders, and real-time strategy adjustments at Phemex. Our USDT-based scaled orders give you precise control over your risk, while iceberg orders provide stealthy execution.
Disclaimer: This is NOT financial or investment advice. Please conduct your own research (DYOR). Phemex is not responsible, directly or indirectly, for any damage or loss incurred or claimed to be caused by or in association with the use of or reliance on any content, goods, or services mentioned in this article.

Virtuals Protocol VIRTUAL price analysisThe price of #Virtual is approaching $1.60, the price at which trading began almost six months ago.
It will be harder and harder to push the price of OKX:VIRTUALUSDT.P upward, because just look at the chart and see how much it was bought earlier and at what trading vol it is now growing.
And what will happen to the #Virtual price if it starts selling off "to zero", those who believed in the "marketing prospects" of #VirtualsProtocol at the time - and as it turned out - bought at highs... ?
The levels shown on the chart are working quite well and can serve as a good guide for making trading decisions.
_____________________
Did you like our analysis? Leave a comment, like, and follow to get more

Breaking: Virtual Protocol ($VIRTUAL) Spike 29% Today Built on the Ethereum chain, Virtual protocol's native token ( SPARKS:VIRTUAL ) saw a noteworthy uptick of 29% today albeit the crypto market growth was modest today.
With the RSI at 75 and momentum growing, SPARKS:VIRTUAL seems poised to break the pass the $1.60 resistant zone and reclaim the $1 Billion market cap eventually.
On a bearish tone, failure to break pass the 1-month high pivot could resort to a consolidatory move to the 38.2% Fibonnaci retracement point a level technically seen as the support point.
What is Virtuals Protocol?
Virtuals Protocol (VIRTUAL) is an innovative cryptocurrency that aims to revolutionize virtual interactions through its AI and Metaverse protocol. Serving as the infrastructure layer for co-owned, human-curated, plug-and-play gaming AIs, Virtuals Protocol is at the forefront of integrating artificial intelligence with immersive virtual environments.
Virtuals Protocol Price Data
The Virtuals Protocol price today is $1.36 USD with a 24-hour trading volume of $410,193,840 USD. Virtuals Protocol is up 32% in the last 24 hours. The current CoinMarketCap ranking is #73, with a market cap of $886,828,030 USD. It has a circulating supply of 652,196,092 VIRTUAL coins and a max. supply of 1,000,000,000 VIRTUAL coins.

#VIRTUAL Ready For Another Leg Down Before Bullish Reversal Yello, Paradisers! Is #VIRTUAL gearing up for a full-blown collapse, or will the bulls fight back at critical support? Let’s break down #VirtualsProtocol:
💎#VIRTUALUSDT has already broken below the falling wedge, confirming that sellers remain in full control. The breakdown from this pattern signals that the expected bullish reversal has failed, and the trend remains decisively bearish. The price action is also clear—momentum is heavily bearish, and unless something shifts fast, we could see much lower levels ahead.
💎The previous major support zone at $0.60 - $0.65 has flipped into resistance, making it a crucial level to watch. Any short-term bounce into this area is likely to face strong selling pressure from sellers of #VIRTUALUSD. Only a break above $0.935 would invalidate this bearish outlook and signal a shift in momentum.
💎If the rejection plays out, the next downside target sits at $0.40, with a high probability of further decline toward the major support zone at $0.31 - $0.07. This is where buyers must step in—otherwise, a much deeper drop could follow.
💎RSI remains weak, and volume is declining, confirming the lack of strong buying interest. As long as this continues, the bearish pressure is likely to persist.
The market rewards discipline and patience—trade smart, Paradisers!
MyCryptoParadise
iFeel the success 🌴

$AIUS best potential AI token$AIUS (Arbius) Is an crypto project that wants to decentralize AI model hosting.\
They want to achieve this by using the POUW method (Proof of usefull work) Where miners will have to solve AI tasks to receive rewards. Mechamisms are in place to slash bad actors and it already had it proof of concept stage.
Next stage is V5 where mining will resume and investors can use their AIUS tokens to subsidize AI Models, Investors also earn rewards from staking, This includes emissions that are 50/50 split between miners and investors, Stakers also receive rewards from AI model fees.
I expect a huge move up when V5 gets launched, I believe this is much bigger than anything created atm and the potential is huge.

$AIXBT – AI-Powered Crypto Analysis Tool with Real Market Utilit💡 What is $AIXBT?
$AIXBT is an AI-driven analytics platform under Virtuals Protocol, integrating blockchain, AI, and big data for advanced market insights.
📊 Key Features:
AI-driven market analytics – Monitors Crypto Twitter & CoinGecko.
Trending narrative detection – Finds key narratives influencing market moves.
Alpha-generating insights – Uses AI to provide data-driven trade signals.
On-chain & sentiment analysis – Tracks 400+ Key Opinion Leaders (KOLs).
🔹 Built on: Base L2 (Ethereum) – Low fees, fast transactions.
🔹 Listed on: Gate.io, gaining liquidity & visibility.
🔹 Growing user base: 100K Twitter followers in 2 months.
🛠 Key levels to watch:
Sweep of $0.167 expected soon – setting up a potential long trade.
Downside risk: $0.08
Upside targets:
$0.3 - $0.43 = conservative/local peaks.
$0.75 - $1.00+ = possible in 2025 if market euphoria kicks in.
🤔 Is $AIXBT Worth Watching?
AI + crypto is a major 2025 trend.
Not a meme coin – real utility for traders.
Unique AI-powered sentiment & narrative tracking.
High volatility.
🚀 Bottom Line:
$AIXBT has a strong AI-driven concept but needs to prove itself in the competitive AI crypto sector. If market enthusiasm for AI tokens continues, this could be a major breakout play.
📌 Key trade idea:
Watch for liquidity sweep at $0.167 → long if price bounces back up immediately.

$VIRTUAL to $5Virtual has a good long term set up. I'm accumulating under $1.
The VIRTUAL token has a total supply of 1 billion tokens, with approximately 648 million currently in circulation. The distribution includes:
Public Distribution: 600 million tokens
Liquidity Pool: 50 million tokens
Ecosystem Treasury: 350 million tokens, released over time with a cap of 10% per year for the next 3 years.
VIRTUAL is used for creating new AI agents, staking for governance, and purchasing agent tokens, which are paired with VIRTUAL in liquidity pools. This structure creates deflationary pressure as more VIRTUAL is locked, potentially supporting its value.
Based on the platform's growth potential and market trends, the price forecasts for VIRTUAL are:
1 Year: $2.00, reflecting expected growth in agent adoption.
2 Years: $3.00, as the ecosystem matures and revenue increases.
5 Years: $5.00, considering long-term expansion in the AI and gaming sectors.
A surprising detail is the rapid growth from a $50 million market cap in March 2024 to over $1.6 billion, indicating strong market interest but also highlighting the speculative nature of its future value.

VIRTUAL at Bottom? Time to Buy?SPARKS:VIRTUAL www.tradingview.com has double bottomed at around 1.85 after rocketing to $5. Is it time.to buy the dip or is it a pump and dump?
Well on top of a couple bullish signals, just recently, Virtuals Protocol has expanded to Solana, leveraging its speed, scalability, and community to enhance its platform. They've introduced the Meteora Pool with new trading pairs and opportunities and established a Strategic SOL Reserve (SSR), allocating 1% of transaction fees in SOL to reward creators and agents. Aligning with their mission to drive AI innovation in decentralized platforms, Virtuals Protocol continues to grow. Additionally, Upbit has listed VIRTUAL with KRW, BTC, and USDT trading pairs, further increasing accessibility. Not to mention other channels are now starting to cover VIRTUAL! It's about time!
If Virtuals Protocol can continue to move forward, innovate and scale at this momentum, bullish price action is inevitable. Is it time to buy the dip? There may be better buying opportunities still to come but as long as no black swans crap in the pond, we may be pretty close to a bottom.

VIRTUAL - A Long Opportunity or More Pain Ahead?VIRTUAL has dropped over 50% from its all-time high of $5.14, now trading around $2.50. A head and shoulders pattern has formed, with price currently testing the neckline, a bearish sign that could signal further downside. Let’s break down potential targets and trade setups.
Key Levels and Support Zone:
1.) POC from December 2024 Range:
Located at $1.67, a significant level from previous trading activity
2.) Anchored VWAP:
Taken from the lows, currently around $1.62, reinforcing the $1.66 zone as strong support
3.) Fibonacci Retracement (Log Scale):
The 0.382 Fib from the recent wave sits at $1.77, providing additional confluence for the support area
4.) Trend-Based Fibonacci Extension:
The 0.786 Fib aligns at $1.71, further strengthening the $1.70–$1.80 range as a reliable support zone
Trade Setups:
Short Setup:
Entry: $2.836 (Fib retracement 0.618 from the current downtrend)
Target: around $1.80
Stop Loss: Above $3
Risk-to-Reward: 5:1
Potential Drop: 30–40% from the entry level
Long Setup:
Entry: $1.70–$1.80 range
Target: Depends on confirmation and take profit areas. A realistic initial target could be around $2-$2.30
Stop Loss: Below $1.52
Risk-to-Reward: 2:1 or better depending on take profit strategy

CONVO AI AGENT CAN return to its BULL trend.The Prefrontal Cortex Convo agent represents a cutting-edge AI designed for engaging and dynamic dialogues. It combines perception, long-term memory, and decision-making capabilities to provide tailored, context-sensitive replies. In contrast to conventional agents, it thoughtfully determines its responses, facilitating in-depth discussions, remembering details from previous interactions, and making independent choices.
At present, it supports over 200 agents and has successfully handled more than 1,000,000 requests within just the first two months.

Invest in AI agents, Virtuals Protocol!Hi fellow traders, VIRTUALUSDT is ready to make a move higher after completing the ABC correction. Target the 5.4670 level. Good luck and trade safe!

Bullish! The price pulled backed to Fib level 0.618 and EMA21 and retested the previous higher high. Now it moved above the previous month/the previous week's mid level. All daily momentum indicators have crossed and are starting to move upwards in the bull zone.
It is a very bullish set up.

Not the time to buy the dip! Wait to buy the strength!!! I just published my article on ai16z and my thoughts on Virtual is very similar to ai16z.
The current chart set up for Virtual is pretty ominous, however, I am still bullish on Virtual.
The new US president just came into the office and also his (and the rest of his family) meme sucked all the liquidity out of the rest of the crypto market. The market is very volatile and it is hard to do technical analysis at the moment.
The one thing I can say is that it is not the time to be hopeful and keep buying every dip to add to your position. I haven’t sold any of my Virtual because I don’t trade with leverage. And my allocation for this asset is small. However, once Trump meme mania settles and the liquidity starts to flow back to the rest of the crypto market, I will start to look for an opportunity to buy more. However, I will not buy the dip: I will buy the strength!!
What I mean by buying the strength is I will only buy when the momentum for the bull clearly comes back. I won't try to buy just because the price is cheap.
I usually use two time frames - daily and 4h. I will wait until the daily stochastic resets and start to roll back to 50 and the 4H MACD lines properly cross and enter the bull zone (above 0).
Also, I am waiting to see if 4H candle can move and close above $2.92 area at Fib 0.236, which gives me an idea if the momentum is strong enough to start to move up.

BUY - take off after consolidation? Virtual protocol completed a strong correction from $5.1 to $2.2. The price fell to the key Fib zone (Blue Fib line in the chart) bounced up with a strong bullish candle formation in the 4H chart.
The price broke and closed above the descending parallel channel as well as Fib 0.236 (orange Fib line in the chart). As I mentioned in my last article, when the price breaks above Fib 0.236, there is a good probability it continues to move to Fib 0.5-0.618 area. If it only reaches 0.382 and retraced back down, it usually means that it is a continuation of the bear trend (at least in my past observation.)
In this case, the price shot up to Fib 0.618 but now it is pulling back. Given that there are two layers of sell blocks sitting above the Fib 0.618 area, there is no surprise the price is coming now.
All momentum indicators in the 4H chart have reached the overbought territory and are moving downwards. However, both Daily and 4H MACD are way above 0, so I interpret it as the dominant trend is bullish but it is a correction phase.
If the price is going to move in the classic style, I anticipate it is likely to oscillate between $3-$4 range. And once the 4H momentum indicators reset and start to move upwards, it is going to start another leg up to and beyond the previous ATH.
There are many "IF". It all depends on when Bitcoin decides its decisive move. But my overall bias for Virtual and crypto market in general is very bullish.
I have been holding Virtual last year (purchase price is about $0.50) and I haven't sold any. I might start taking profit in stages when the daily MACD or RSI starts to form a clear negative divergence.

BUYGAME is an AI agent infrastructure project in the Virtual protocol ecosystem. A small market crypto project is extremely volatile and can be unpredictable, but I enjoy trading a project like this based on technical analysis.
Technical analysis can be very subjective. Depending on which time frames you are trading and how you are seeing patterns, you can draw support/resistance/trend lines in so many different ways for more mature assets like Bitcoin, FX, and indices. But a young asset like GAME, doesn't have much price action history, therefore, it can be easy to see where the price moves and retraces according to Fibonacci level in 4H and Daily charts. There are no prior historical patterns and price levels so we have to go with textbook style moves. I am not sure if that is the case, but I feel like that's what is happening in many new crypto projects.
The price started to move up on the 5th Dec and peaked on the 3rd Jan. It is the very first time in this asset's history that the momentum indicators travelled from the bottom to the top in the daily chart. So I drew the Fib retracement line there. The price dropped right at Fib 0.786 (the last line of defence for the bull), formed tweezer bottom, and strongly bounced up in the 4H chart.
Daily MACD is remaining in the bull territory. Daily Stochastics have reset and entered the bull zone. When you go to 4H chart, MACD lines have crossed and are entering to the bull territory. The price is travelling inside the sell block in the 4H chart, but once it clears, it has not much pressure to move to the last month high at $0.36 zone and move up further.
I don't trade small projects like this with leverage. I pick projects with good fundamentals and buy with a small allocation of my capital. I bought GAME tokens at $0.25 area in late Dec. I intend to hold it for a while and when Daily momentum indicators start to form negative divergence, I might sell all or sell some.

GRIFFAIN - About to take off? GRIFFAIN is an AI agent project on Solana blockchain. The price has been consolidating since 13th Dec and the price has broke above the resistance line at $0.35. The current chart set up in Daily timeframe looks to me exactly the same as that of ai16z on 27th Dec when the price skyrocketed from $0.90 to the current price of $1.72. MACD crossed above 0 level and showed green histogram bar, and RSI and Stochastic both crossed and clearly pointed upwards in the bull territory. That all three momentum indicators show clear bull signal in Daily chart doesn't happen often. I invest in this project and do not intend to do short term trading wit this asset. I think another parabolic leg is coming just like ai16z. I might take small profit if momentum indicators start to show clear negative divergence in 4H or daily chart, but I intend to hold most of my position until it reaches 1 billion Market cap.

BUYWell, I was hoping the price would consolidate for a while when it broke above the trendline and Fib 0.236, but it blasted off to Fib 0.618, instead. Last nights CPI data must have been a major catalyst for this move.
I have bought Virtual at around $0.50 Nov last year and I haven't sold any yet. I am bullish on Virtual and I intend to invest and hold for a while, instead of trading.
I am looking for an entry to buy more. I personally don't think it matters too much to buy it for $4 , $3.80. or $3.50 IF you are to hold it for several months. However, currently the price is hovering around Fib 0.618 which is the area the price often corrects temporarily. Also, two sets of sell orders sitting right above it. The 4H Stochastics has already reached the overbought territory (although it doesn't mean much when the momentum is very strong. It can stay in the overbought territory for a long long time and the price keeps going up.)
What I am going to do is to wait and see how the price will settle during Asian and European a.m. sessions. If the price comes down to Fib 0.382-0.5 level, I will buy more.

Almost time to buy, not yet! ! Yesterday, I published my analysis on Virtual protocol and wrote that I would buy when a certain conditions are met.
These conditions are:
1) Daily stochastics (9,3,3) reset and start to move upwards
2) Daily MACD remains above 0 level (bull zone)
3) 4H MACD lines cross and enter the bull zone.
4) 4H stochastics are not overbought territory (it is okay if the conditions above are met but it might experience a few more pull backs if stochastics are overbought)
5) 4H candle breaks and closes above the top descending parallel channel and stays and also it is above Fib 0.236.
In the last few days, the bull is starting to show some signs of strength. Daily stochastic has reset and now is moving back up. Daily MACD remains in the bull territory. Therefore, the environment to open a long position is now present. The price has moved and closed above the descending parallel channel as well as Fib 0.236 in the 4H chart.
HOWEVER, the 4H stochastics has already reached the overbought territory and rolling down before 4H MACD made it to the bull territory. That means, the first attempt for the bull run has failed. The price might move sideways between key fib levels for a while until the stochastic is reset.

Long opportunity imminent? I am going to buy when the following conditions are met:
1) Daily stochastics (9,3,3) reset and start to move upwards
2) Daily MACD remains above 0 level (bull zone)
3) 4H MACD lines cross and enter the bull zone.
4) 4H stochastics are not overbought territory (it is okay if the conditions above are met but it might experience a few more pull backs if stochastics are overbought)
5) 4H candle breaks and closes above the top descending parallel channel and stays and also it is above Fib 0.236.
There are a lot of conditions to meet and it might take a while, but from my past experiences, when these conditions are met, the price start to move smoothly in the direction of my bias. I don't need to go through unnecessary emotional roller coaster.
