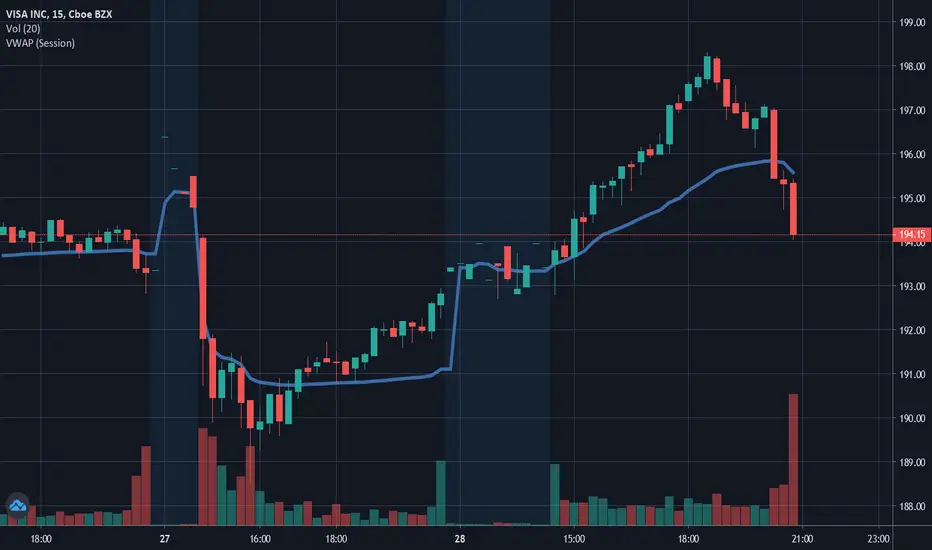
$VVisa looks interesting.
Above 200 EMA and 50 EMA
Stochastic RSI turning up.
Volume ok,and Volume falling down with price.
All require is brekaout above 200 volume and Green bar.
A 50$ trade possible.
Visa


Very possible movement for Visa Inc.Visa is inside a triangle and it formed a cup and handle pattern. Analysing its moviment we can see a strong resistance, so it might break the support. This idea is very similar to Bank of America (BAC).
Follow me for updates and more ideas!

VISA INC chart analysis:On one day chart price is forming new high on the peak.
Below 186.36 confirm bearish.
The price has Strong internal support 186.36 near this level.
The volume declining but though, it has more volume then normal.
As it has a support price can move up.
If the price cross the 202.34 level it can still further move up-to 208.54

V (Visa Long - but not now)Too much volume in the 140-142 areas. But you can definitely long at 140-142.


analysis and prediction for VISA INCthe vwap breaked by the trend range and we have a springbox followed by a high-down volume i suppose the trend range going short

Long MAKeep your trading simple
Bullish Long Term
T1 = minimum risk reward 1:1
I always leave 1/3 of my position for long term gains - moving my stop to my entry if I need to give room for the volatility or using trailing stop for maximum gains.
Not a financial advise - trade smart trade safe.
Follow me to support my work, Thanks!

Long MA - Second chance entry!Keep your trading simple
Bullish Long Term - After closing profits on the first trade on MA now we have anther trading opportunity!
Long term target $335 - Closing gap.
T1 = minimum risk reward 1:1
I always leave 1/3 of my position for long term gains - moving my stop to my entry if I need to give room for the volatility or using trailing stop for maximum gains.
Not a financial advise - trade smart trade safe.
Follow me to support my work, Thanks!

V Bullish Inverse Head and Shoulders + Support + Demand Zone + Bullish Momentum
Initial Price Target is 194.95
Secondary Price Target is 198.88

ETH double bottom with bullish potentialIf you followed my last review, which I posted on May 6th and kept on filling with new forecasts till yesterday, you could have made a fortune =) Predicted bottom almost 100% precise.
Now that the bottom is formed, time to consolidate and grow. And today I saw news, saying VISA filed an application to create digital currencies with the United States Patent and Trademark Office, citing #Ethereum as the possible network. So that is very bullish for ETH.
As I wrote yesterday, if ETH fail to grow above 22000, it may form a consolidation channel between ~20700 and 22000. In this case buy longs from 20700-21050 support zone. That is one of possible scenarios.
Another scenario is ultra bullish - ETH price bounce from 21800 support and continue growth. Not the safest long entries here, but its a bull flag until it proves the opposite, so with cautious approach not a sin =)
Some additional charts. Below is day chart with Ichimoku Cloud. As you can see, its not yet bullish. In fact, very dangerous. But that cloud above act like magnet, so price will be attracted to it until its form change. That also means that here we have a potential double bottom, but since we don't see higher low yet, its early to celebrate the bull run. So as I said, safer entries are from 207-210 zone. Anything above is a risky approach catching breakout that might not happen.


Visa inc one of the best stocks to buyIn our opinion Visa's stock should rise for 1-2 weeks 2.5-5% after a little correction continue rally and achieve 210.
For the full report connect us

Short zone arround 186-187The resistance in red 'd be difficult to pass, I propose to short the zone 186-187 for a retest on the 200MM +/- 180.

VISA NEXT DAYS/WEEKS ANALYSIS - Counter thrend-next breakoutDAILY CHART
As ween can see in the daily chart, the visa stock until the end of March was in a strong downtrend. Around 24 of March it has a double bottom and then began a new uptrend. We can say it is going for uptrend cause the Lower High around $168 was broken,and now as we can see the price is retesting that previous resistance that now is a new support.
We saw the price retrace at 0.382 fib level (indicates a strong trend ) and now its forming a descending triangle as consolidation phase. The price will consolidate for some days and then it will eventually breakout to the upside.
30min chart - not for analysis but we can see a more detailed description of the moves and the retracement.
Scenarios
It might happen that the price will consolidate for the next days in that triangle and then breakout and first target will be 1.27 fib extension and second target is 1.618 fib extension around $196. We also see in the market structure if we look left that also in that level of 196$ there is a resistance line so it probably go up and test it.
That is only my thoughts and not an advise.

Visa - Go long Idea
NYSE:V
NASDAQ:PYPL
Based on Fundamental and Technical Analysis seems that visa might go up.
PAYPAL had a jump before last week's market closure and perhaps visa might follow PayPal

VISA - will it keep going?This is just an update for myself - but i have put some opportunitys
in for you, where i see buy/sell signals.
Disclaimer: I have positions in VISA

Visa Shorts a potential bearish continuationI've been waiting for the top of this potential retracement from the initial virus bearish move. The candlesticks from the last 7 days, together with the decreasing volume seem to be good indicators of a bearish continuation.
Other factors would contribute:
- March 2020 US retails sales showed Discretionary sectors posting deep declines
- 15 April FT report "US banks detail dramatic fall in credit card spending" Citigroup reports that Card spending fell by 30% in the last week of March.
- Mortgage defaults are expected to be high and with 1/3 of Americans missing April rent payments. Credit cards or credit card cash loans might become a desperate short term solution but this will only spiral to bad debts
I would have prefered to buy put options but I feel at this point it is super overpriced due to the high implied volatility. Entered the trade with a good 1.53 risk-reward ratio

VISA MAINS - LONG on the cardsThis is probably one of my much riskier trade propositions. Visa has its earnings report published tomorrow morning. It's very easy to tell that, yes, VISA will report a loss. However, my proposition is that the earnings loss will not be nearly as substantially bad as first expected.
Alongside that, we have a clear divergence off of the trendline, now heading directly for the 200MA. This trade all depends on whether or not it can successfully break the 200MA. That's why it's one of my riskier ones. The volume looks healthy, but not necessarily pertinent enough to constitute the push. Personally, it's certainly viable; especially with the aforementioned earnings report.
The dotted line is a level I can see us hitting after an initial push upwards. It's possible that we never hit that level before a large shove up - it's equally possible that the market will turn against us bullish lot and shove us down.
I'm taking this trade with extreme caution - it's more of a long term hold than a scalp but we shall have to see how it plays out. Onwards!

SP500 Going UpWhen I said it would go down in DEC19 I had to be confident to stand on my analysis, and it played out.
Here I support why its going back up, you've gotta draw the line somewhere, if its as the media portrays the world would have ended 10 times over already!
TRUTH is concerning as this outbreak is, compared to our massive world population of 7.8 Billion (MAR20) the numbers of this virus outbreak are minuscule.
They've been selling fear and the masses have been buying, business as usual, before this they were fear mongering about something, after this they'll find another issue to cry about. If you ask me this may have very well been a snowball of media fear mongering compiled with the sensitivities of feeble minds.
Being a medical matter, most of us and politicians are not educated on the subject matter, so it becomes important to follow the leader, because nobody wants to be taking the blame for mishappenings.
Here I believe the uptrend has started, and slowly but surely will return to sync with the pre corona trend.
Here on the M chart I believe it can close above 2500, or at 2500 by month end in 2 days, meaning APR the uptrend to become evident.
Just my take, do your own due diligence.

