Visa to break higher?Visa - 30d expiry - We look to Buy a break of 236.11 (stop at 230.38)
The primary trend remains bullish.
This is currently an actively traded stock.
Trading volume is increasing.
235.57 has been pivotal.
A break of the recent high at 235.57 should result in a further move higher.
There is no clear indication that the upward move is coming to an end.
Our profit targets will be 249.78 and 252.78
Resistance: 230.00 / 235.57 / 240.00
Support: 223.00 / 220.00 / 216.14
Please be advised that the information presented on TradingView is provided to Vantage (‘Vantage Global Limited’, ‘we’) by a third-party provider (‘Signal Centre’). Please be reminded that you are solely responsible for the trading decisions on your account. There is a very high degree of risk involved in trading. Any information and/or content is intended entirely for research, educational and informational purposes only and does not constitute investment or consultation advice or investment strategy. The information is not tailored to the investment needs of any specific person and therefore does not involve a consideration of any of the investment objectives, financial situation or needs of any viewer that may receive it. Kindly also note that past performance is not a reliable indicator of future results. Actual results may differ materially from those anticipated in forward-looking or past performance statements. We assume no liability as to the accuracy or completeness of any of the information and/or content provided herein and the Company cannot be held responsible for any omission, mistake nor for any loss or damage including without limitation to any loss of profit which may arise from reliance on any information supplied by Signal Centre.
Visa

$V - VISA Wyckoff Distribution Visa showing signs of weakness... Here is what we're seeing with Wyckoff Distribution

Visa to break higher?Visa - 30d expiry
The primary trend remains bullish.
This is curremtly an actively traded stock.
Trading volume is increasing.
235.57 has been pivotal.
A break of the recent high at 235.57 should result in a further move higher.
There is no clear indication that the upward move is coming to an end.
We look to Buy a break of 236.11 (stop at 231.38)
Our profit targets will be 249.78 and 252.78
Resistance: 235.57 / 240 / 250
Support: 228 / 223.50 / 220
Please be advised that the information presented on TradingView is provided to Vantage (‘Vantage Global Limited’, ‘we’) by a third-party provider (‘Signal Centre’). Please be reminded that you are solely responsible for the trading decisions on your account. There is a very high degree of risk involved in trading. Any information and/or content is intended entirely for research, educational and informational purposes only and does not constitute investment or consultation advice or investment strategy. The information is not tailored to the investment needs of any specific person and therefore does not involve a consideration of any of the investment objectives, financial situation or needs of any viewer that may receive it. Kindly also note that past performance is not a reliable indicator of future results. Actual results may differ materially from those anticipated in forward-looking or past performance statements. We assume no liability as to the accuracy or completeness of any of the information and/or content provided herein and the Company cannot be held responsible for any omission, mistake nor for any loss or damage including without limitation to any loss of profit which may arise from reliance on any information supplied by Signal Centre.

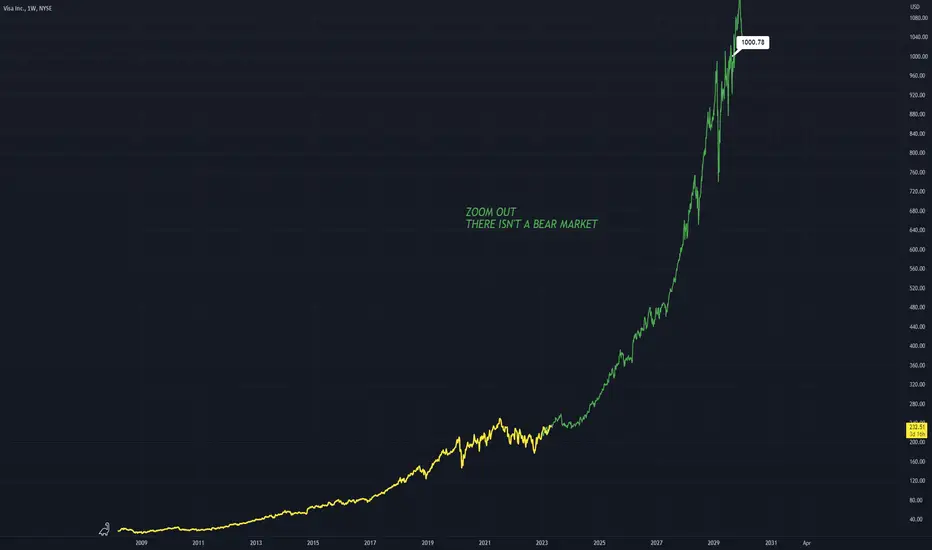
VISA - ZOOM OUTVisa is one of my favourite and most consistent stocks.
But these charts are everywhere on the stock market. Charts like this. Purely upwards.
I am just using Visa as an example.
Lacking a bear market these stocks are pure gems.
Ride the curve towards the stars.
If you want more proof check out GOOGL, MSFT even BTC
V Visa Options Ahead of EarningsIf you haven`t sold V Visa here, for a better reentry:
Then analyzing the options chain of V Visa prior to the earnings report this week,
I would consider buying the 230usd strike price Puts with
an expiration date of 2023-6-16
for a premium of approximately $5.65.
If these options prove to be profitable prior to the earnings release, I would sell at least half of them.
I am interested to hear your thoughts on this strategy.

Visa: Vis – à – vis 👀Visa is moving just under the resistance at $235.85 – vis-à -vis with this mark, so to speak. Soon, the share should climb above this level, though, to complete wave b in magenta. This done, it should return below $235.85 and continue the descent below the support at $208.76, dropping into the turquoise zone between $204.28 and $187.10. There, the stock should finish wave 2 in turquoise, whose low should then initiate fresh upwards movement. However, there is a 34% chance that this low could already be established in the form of wave alt.2 in turquoise. In that case, Visa would maintain the upwards momentum.

V - Rising Trend Channel [MID TERM]- V is in a rising trend channel in the medium long term.
- The stock has broken up through resistance at 231.
- The short term momentum of the stock is strongly positive, with RSI above 70.
- However, particularly for big stocks, high RSI may be a sign that the stock is overbought and that there is a chance of a reaction downwards.
- The stock is overall assessed as technically positive for the medium long term.
*EP: Enter Price, SL: Support, TP: Take Profit, CL: Cut Loss, TF: Time Frame, RST: Resistance, RTS: Resistance to be Support LT TP: Long Term Target Price
Verify it first and believe later.
WavePoint ❤️

Why You Might Want To Buy This Stock In 5 Steps [Watch This]First of all allow me to say thank you
to my mentor Matthew Kratter for teaching me This strategy
--
It was in 2018 when i got his book from amazon kindle
called "Rocket Stocks"
--
This is where i was first exposed to this strategy
--
Do you Remember How To Trade This Strategy?
--
Lets get into it with 5 Steps:
--
#1 - Weekly "Gap" On The Last Day Being Friday
--
#2 - The price has to be above the 50 EMA
--
#3 - The price has to be above the 200 EMA
--
#4 - The PAR has to be below the price if you are going "long"
--
#5 - The same rules apply if you decide to go " Short"
--
--
Allow me to get some credit and say am not an expert
please do your own research and dont take this
--
Advice to make your trading decisions
this is based upon my own personal research
--
If you want to learn more then you can
keep following me here
--
and watch this video for more information
--
Regards,
LubosiForex

NYSE - VISA - BREAK & RETEST - MOMENTUMBeginning testing phase using my system in the stock market!
Aiming for being able to use it for my own personal longer term investments, ideally to diversify and sow multiple income streams!
The strategy is simple but very systematic and well defined and it's taken me many years to really put together every part of successful trading down to the most intricate detail. If it can work in other markets as well as forex, then the proof will be in these public ideas that everyone has access to and that can't be deleted once posted so there will be no doubt of the authenticity and quality of the system. Which in turn, might open the door later on for potential educational material to diversify income streams which will in turn bring a higher quality of execution in the markets because there will be less financial pressure to perform.
Anyways before any of that takes place, I must see if the system can achieve a positive expectancy in stocks so be on the lookout for future stock posts as well.
Starting out with V using my bread and butter! The classic B&R play that appears throughout my ideas in forex. As far as timeframes, from pure observation in past instances with the stock market, I've found the 3 Day candle chart to be particularly clean in terms of price action so that will become my default timeframe for stocks for this first testing phase.
Lets see how this plays out over the next few weeks!

Visa (V): Recovering From a Recent DipVisa (V) is poised for strong double-digit earnings growth as the global trend of cashless transactions continues.
The stock is valued attractively based on multiple years of growth.
Visa's stock is likely to outperform over the long-term based on valuation, growth, and earnings upgrades.
Visa's daily chart above shows a positive upward trend. The stock recently dipped and looks like it may begin a new uptrend leg higher. This would be confirmed by the MACD indicator in the middle of the chart. The trend would be considered back to positive when the blue line crosses above the red signal line. The purple RSI line at the bottom of the chart is showing positive strength, indicating that the stock may continue upward.

V Visa Options Ahead of EarningsIf you haven`t sold V Visa here, to reenter on the buy area:
Then you should know that looking at the V Visa options chain ahead of earnings , I would buy the $222.50 strike price Puts with
2023-1-27 expiration date for about
$3.64 premium.
If the options turn out to be profitable Before the earnings release, i would sell at least 50%.
Looking forward to read your opinion about it.

$ACH is looking good! $ACH is looking to pop! This Real-world use of collateral coin is being trusted by VISA already. It's only a matter of time where merchants will be accepting crypto and they need a retail collateral token and ACH looks like a great candidate. Im in long-term LONG on this one.

Neutral V - Watching the levelsThe P&L is for the reference of entry, potential upside and cut loss point. The dates on it have no relevance.


Short Signals on Visa at 250$Double top with clear retest of breakdown of multi year channel as seen below. Confluence of these conditions makes Visa a great short candidate back to support zone in purple below.

VNot financial advice. The essence of investing & trading is the intelligent and patient preying on the greed, fear, impatience, addiction and ignorance of the majority. It's definitionally Darwinian.

Bullish Divergence Bullish Divergence on the annual time frame indicating Visa is setting up for a blow off top to make new all time highs. Only time will tell. But as the use of digital payments continue to rise. so will VISA stock price imo.

visa and bollinger band Bollinger band suggest the counter is ready to make a breakout
multiple times respected bollinger band earlier as shown in the chart.
the counter in past have seen support from mid or lower band
while resistance at the upper band along with retracements at mid band when in uptrend.
which sugest the counter is a good candidate to play via BB

$V has heavy resistance aheadNYSE:V failed to break above 218 in June, July and August of this year. It retreated, and is taking another run at it.
I'll probably buy some puts if it reaches 217.50 or so ... with a tight stop loss ... I'll cut my losses if V reaches up to 220.

Selling Visa at swing highs.Visa - 30d expiry - We look to Sell at 216.49 (stop at 223.41)
We are trading at overbought extremes.
Bearish divergence can be seen on the daily chart (the chart makes a higher high while the oscillator makes a lower high), often a signal of exhausted bullish momentum, or at least a correction lower.
Bearish divergence is expected to cap gains.
We look for a temporary move higher.
The previous swing high is located at 217.61. 218.07 has been pivotal.
Preferred trade is to sell into rallies.
Our profit targets will be 199.22 and 195.22
Resistance: 215 / 218 / 225
Support: 206 / 200 / 195
Disclaimer – Saxo Bank Group.
Please be reminded – you alone are responsible for your trading – both gains and losses. There is a very high degree of risk involved in trading. The technical analysis , like any and all indicators, strategies, columns, articles and other features accessible on/though this site (including those from Signal Centre) are for informational purposes only and should not be construed as investment advice by you. Such technical analysis are believed to be obtained from sources believed to be reliable, but not warrant their respective completeness or accuracy, or warrant any results from the use of the information. Your use of the technical analysis , as would also your use of any and all mentioned indicators, strategies, columns, articles and all other features, is entirely at your own risk and it is your sole responsibility to evaluate the accuracy, completeness and usefulness (including suitability) of the information. You should assess the risk of any trade with your financial adviser and make your own independent decision(s) regarding any tradable products which may be the subject matter of the technical analysis or any of the said indicators, strategies, columns, articles and all other features.
Please also be reminded that if despite the above, any of the said technical analysis (or any of the said indicators, strategies, columns, articles and other features accessible on/through this site) is found to be advisory or a recommendation; and not merely informational in nature, the same is in any event provided with the intention of being for general circulation and availability only. As such it is not intended to and does not form part of any offer or recommendation directed at you specifically, or have any regard to the investment objectives, financial situation or needs of yourself or any other specific person. Before committing to a trade or investment therefore, please seek advice from a financial or other professional adviser regarding the suitability of the product for you and (where available) read the relevant product offer/description documents, including the risk disclosures. If you do not wish to seek such financial advice, please still exercise your mind and consider carefully whether the product is suitable for you because you alone remain responsible for your trading – both gains and losses.

VISA SHORT TIMBERRRR!!!VISA formed a rising wedge on the 4hr time frame and broken its support. Secondly on the daily time frame VISA formed a descending channel which it broke out of and reentered due to a false break out. Current play is $200 puts out for Jan-Feb
:)

Visa - Weekly analysisIs this a fakeout or is this a breakout. Wondering why ex speaker would sell all of her shares? Not entering until I see price action, break above recent highs outside channel or a break back down below the channel. Will zoom in for entry.
Overall, We could see a green day tomorrow due to the fact we had 4 red selloff days in a row... so probability has it a 5th could go green. Waiting to see a bounce but ready to take some more puts tomorrow as I see price action happen real time.
Indicators are lagging, you want to see price action, market psychology, market structure, gaps, imbalances, and use all the tools available to make a good trade!
Trade safe have fun!!
Like and comment for more!

VISA About to start a historic Bull Cycle similar to post 2009This is Visa Inc. (V) on the 1W time-frame. The primary pattern since the July 26 2021 All Time High (ATH) has been a Channel Down with the price hitting yesterday the top of the pattern for the first time since August 15. The August 15 candle rejection was also made (after multiple attempts) on the 1W MA100 (green trend-line).
The pattern is similar to the one Visa has been trading in since mid 2019. This idea compares the two eras: 2019 - 2022 and 2008 - 2011. In 2011, the stock was trading within a similar Channel Down as the accumulation pattern, with its Lows contained around the 0.5 Fibonacci retracement level. Following the break above the 1W MA100, the price made one last Lower High, pulled-back and then broke above the pattern aggressively. If the same formation continues to be repeated then we can have a break above the Channel Up by mid December. See also how the RSI and MACD patterns are similar.
------------------------------------------------------------------------------
** Please LIKE 👍, SUBSCRIBE ✅, SHARE 🙌 and COMMENT ✍ if you enjoy this idea! Also share your ideas and charts in the comments section below! This is best way to keep it relevant, support me, keep the content here free and allow the idea to reach as many people as possible. **
-------------------------------------------------------------------------------
You may also TELL ME 🙋♀️🙋♂️ in the comments section which symbol you want me to analyze next and on which time-frame. The one with the most posts will be published tomorrow! 👏🎁
-------------------------------------------------------------------------------
👇 👇 👇 👇 👇 👇
💸💸💸💸💸💸
👇 👇 👇 👇 👇 👇
