V | LongVisa is looking pretty nice to bounce up and break the TL support level above. I guess V could break parallel channel next week
Visa

An easy way to lower the risk profile of your stock portfolioThe correlation between Visa and Mastercard creates an interesting investment trick.
I began this analysis not even looking for the correlation between these two companies' stock prices. But rather I was looking for some chart patterns using a stock screener. At the top of the list, these two companies emerged. As usual, I was going to go through the stock charts of all the companies in the list briefly to determine if they hold any chart pattern merit.
However, as I scanned over Visa, and then Mastercard, I noticed they looked extremely similar. Weird. I then opened up Tradingview and put these stocks in. Side by side they look the same.
These two companies have very similar price movements. No surprise, they are very similar companies. They are direct competitors. They are both big players in the global credit services market. Transacting trillions of dollars in total payments volumes per year. They’re both tech companies that connect the consumer and the merchant digitally for transactions. They have been seen as rivals for over a decade now. Neither Visa nor Mastercard are involved in extending credit or issuing cards. They work in a co-branded relationship with the card provider. That's why you will see their logos on your credit card but won’t see a full absolute Mastercard/Visa credit card.
Visa is generally larger in terms of the transaction, purchase volume and cards in circulation. However, Mastercard growth has been picking up and may see a catch-up.
Now let’s get back to the price movement analysis. I have split this up into three time periods and then done a Pearson Correlation Test. The first period is the matched IPO date to the current date. The next is the last 5 years and then the last 2 years.
The reason for the three time periods is simple. I want to do a full IPO to current date analysis to get the full picture and long-term perspective. A 5-year analysis because if you look at the charts above, that’s when the volatility in the stocks picks up. The last 2 years, because if you look again at the charts above, some crazy price movements have been occurring in the last two years that do not follow the past 14-year trend.
The closer to +1, the closer the correlation.
March 2008 - Nov 2022: 0.83
Nov 2017 - Nov 2022: 0.92
Nov 2020 - Nov 2022: 0.90
As you can see from the above stats both of these stocks have a close relationship with each other. A higher correlation in recent years. Of course, correlation doesn’t mean causation. However, the fact that these two companies are very similar and direct competitors means that one could form a reasonable conclusion. Not that one stock is affecting the other price. But rather than investors see these two companies as very similar. Such that when they exit one, they exit the other. Unless there is a big reason not to. But as you can see from the stats above. The stocks have a close correlation over the last 14 years such that even if one says that, let, for example, Visa is going to grow faster than Mastercard, the chances are - Mastercard wouldn’t be far behind.
Henceforth, this leads to an interesting investment tip:
Let’s say you want to diversify your portfolio by gaining some exposure to the credit services industry. Since Visa and Mastercard are the two leading companies, you chose them. However, you only have enough money to invest in one. But you also want to lower the risk profile of your portfolio. Is there a way both can be done?
The answer is yes, since Visa and Mastercard have such a close correlation and are very big established companies they will most likely follow each other in price movement. Also, since they are two different companies, you will be diversifying your investment and will be lowering your risk. So, you divide that last portion of your portfolio into two smaller portions and buy Visa and Mastercard 50:50. This will mean you get the exposure you are after, the returns as well since they have a close correlation, and the risk is lowered since they are two separate companies. Quite a cool trick is not it?
I created three different portfolios. Each beginning with $10,000. I invested the full out in two of them into Visa and Mastercard. The last portfolio had a 50:50 split. I then calculated the standard daily deviation and the annualized standard deviation. Here are the results:
Visa 100%:
Start value: $10,000
End value: $137,295.57
Annualized STD: 29.60%
Mastercard 100%:
Start value: $10,000
End value: $151,466.00
Annualized STD: 32.30%
Visa 50% Mastercard 50%:
Start value: $10,000
End value: $144,380.79
Annualized STD: 29.50%
As you can see from the above stats, once the two stocks have been combined the standard deviation drops by 8.67% and the standard deviation is lower than the two stocks individually. This means the risk is lower. However, yes, the final value isn’t as high as the Mastercard 100% the returns are higher than the sole Visa 100% portfolio by 5.10%. So, in other words, the risk has been lowered than if you had individual portfolios and the returns are higher as well. Of course, the returns aren’t as high as they are in the Mastercard 100% portfolio, but the risk is lower while still ensuring higher returns. This means the Visa 50% Mastercard 50% portfolio provides an effective way to reduce risk while increasing returns.
However, one thing to note is the maximum drawdown was the lowest in the Mastercard 100% portfolio. The second lowest is Visa 50% Mastercard 50%. Highest in Visa 50%. So, ensure that if you are going to follow this strategy, there is more research to be done and it is best worked in a long-term investment strategy possibly combined with dollar cost averaging.
To conclude, if you want to see a higher return while lowering the risk profile of your portfolio. It pays to diversify with similar correlating assets.

V:More pain in sight!Visa
Intraday - We look to Sell at 199.64 (stop at 210.66)
The medium term bias remains bearish. A sequence of weekly lower lows and highs has been posted. This is negative for sentiment and the downtrend has potential to return. Resistance is located at 200.00 and should cap gains to this area. Preferred trade is to sell into rallies.
Our profit targets will be 173.20 and 165.00
Resistance: 200.00 / 235.00 / 250.00
Support: 173.00 / 140.00 / 120.00
Please be advised that the information presented on TradingView is provided to Vantage (‘Vantage Global Limited’, ‘we’) by a third-party provider (‘Signal Centre’). Please be reminded that you are solely responsible for the trading decisions on your account. There is a very high degree of risk involved in trading. Any information and/or content is intended entirely for research, educational and informational purposes only and does not constitute investment or consultation advice or investment strategy. The information is not tailored to the investment needs of any specific person and therefore does not involve a consideration of any of the investment objectives, financial situation or needs of any viewer that may receive it. Kindly also note that past performance is not a reliable indicator of future results. Actual results may differ materially from those anticipated in forward-looking or past performance statements. We assume no liability as to the accuracy or completeness of any of the information and/or content provided herein and the Company cannot be held responsible for any omission, mistake nor for any loss or damage including without limitation to any loss of profit which may arise from reliance on any information supplied by Signal Centre

Visa $V Rejecting off top channel resistance -- BearishGiven FOMC is behind us now and the market is most likely following another leg down I'm expecting a top line rejection off of the large channel on the daily.
Rejected off the 200d MA of $218.11. Expect continuing rejection if we get a dead cat recovery at this point, but ultimately I see this impulse retracing back down. Notice the W pattern several bars before with a clear rejection off the top resistance with the large wick a few days prior.
MACD is making lower highs, RSI is coming back down and about to cross the signal to the bearish side. Stochastic is losing steam as well starting to fall from overbought territory. VI+ looks like its done making an engulfing void to the upside, which indicates that a reversal pattern with VI- is probably around the corner. TTM squeeze looks like its starting to apex as well.
Looking at the fib retrace from the previous low to high, and also following an extension downwards from previous high impulse to recent low and recent high we are looking at support levels of 0.236 at ~ $202.81 and 201.26 which is more or less where current price action is. Therefore expect the next couple of fib supports/resistances to be hit on both the retracement as well as the downward extension.
Retracement supports are as follow --
0.382 $194.42
0.5 $193.06
0.618 $188.70
Fib Extension resistances are as follow --
0.382 $194.91
0.5 $189.79
0.618 $184.66
Looking at the volume profile we see a good shelf of support up to the 0.5 fib extension.
Look for downward movement over the next 6 daily bars (10 days). Price action must clear the support shelf at $200 to continue downwards, otherwise expect sideways action between $200-203.
PT1: -6 pts -2.99% to the 0.382 extension ~ $194.91
PT2: -11.11 pts -5.33% to the 0.5 extension ~ $190 -- I think this is where $V will find support and probably start heading sideways.
Max PT: -16.11 pts -8.03% to the 0.618 fib extension ~ $185 -- Long shot, will have to continuously monitor to see how we move along with the macro and how the volume profile shapes up over the next few days.
Stop loss: ~$203.50 +1.53% from current action -- This would be the last stop on the volume profile upwards where the next would be a gap towards the upside.

Visa, Inc. (V)Founded in Foster City, California, by Dee Hock, this American multinational specialises in global payments technology. Its primary aim is to promote digital currencies among consumers, businesses, banks, and governments. Having built its network across 200 countries and territories worldwide, it is a global leader in digital payments. The company offers three different types of cards: Debit cards, Credit cards, and Prepaid cards. It also partnered with Apple in 2014 to introduce a wallet feature to iPhones. The company has various products, such as Visa Electron, Visa Cash, Visa Contactless, mVisa, and VisaCheckout.

visa sell opportunity visa stock is ready to go deep down all things are mentioned on the chart take it and enjoy :)

V Visa exposure to Russia and UkraineVisa and Mastercard restricted transactions in Russia as aggressive penalties on the country over the invasion of Ukraine.
Around $1.2 billion of Visa Inc.’s annual net revenue comes from Russia and Ukraine.
4% of Visa’s total net revenue comes from Russia and about 1% from Ukraine.
In this case, my price target for the stock is the $187 resistance, while the sell-off area could touch $174 - $183.

Visa Looking to Loose More Ground. A nice looking zigzag appears to be forming on this one, with what I believe is a completed B Wave triangle. The picture is supported by momentum reversal as well.
We are not in the business of getting every prediction right, no one ever does and that is not the aim of the game. The Fibonacci targets are highlighted in purple with invalidation in red. Confirmation level, where relevant, is a pink dotted, finite line. Fibonacci goals, it is prudent to suggest, are nothing more than mere fractally evident and therefore statistically likely levels that the market will go to. Having said that, the market will always do what it wants and always has a mind of its own. Therefore, none of this is financial advice, so do your own research and rely only on your own analysis. Trading is a true one man sport. Good luck out there and stay safe.

Visa Levelling Up. VFinal leg of upgoing zigzag. B wave confirms both end of B downtrend and a beginning of a final impulse up. Cleared 0.618 with no overbought, nor divergences, taking 1.0 as the next best level of potential resistance, after that a very common 1.2.
We are not in the business of getting every prediction right, no one ever does and that is not the aim of the game. The Fibonacci targets are highlighted in purple with invalidation in red. Confirmation level, where relevant, is a pink dotted, finite line. Fibonacci goals, it is prudent to suggest, are nothing more than mere fractally evident and therefore statistically likely levels that the market will go to. Having said that, the market will always do what it wants and always has a mind of its own. Therefore, none of this is financial advice, so do your own research and rely only on your own analysis. Trading is a true one man sport. Good luck out there and stay safe.

Visa (V) - When and where to long (or short!)V (Visa) is making corrective moves along with overall market. Assuming we "bounce" and don't go into a full blown recession this is a concrete trading idea for when to go long. While V could arguably correct from here at the 618, I believe we are in for further downside. Targeting the 786 retrace of the latest swing makes sense.
Why take it this? Excellent reversal idea with solid risk to reward. (1:3 TP1 and 1:4 TP2)
Entry: 192.45 - Long from longer term support zone and when market conditions look favorable for a bounce
Stop loss: 184.7 - Lower low (market structure continues with the LL LH path, idea is invalidated)
TP1: 217.6 - s/r level
TP2: 224 - s/r level
PS... Since I expect a reaction here at the 618 ($198), if you wish to short you can enter short off the psychological $200 level (0.5 fib) back down to the long entry target. I would argue this trades with current trend direction even better but I know how psychologically many have a hard time shorting.
Zoomed out view of setup

HOW HIGH WILL DOGE COIN REACH IN 2030? - DOGE Price PredictionThe DOGE is inferior to the inflation rate of the USD and has a limitless supply, albeit the inflation momentum does diminish over time due to a set distribution pace.
Although the circulating supply is fully unlocked, the total amount of DOGE is already high.
Dogecoin's one-minute block time is inferior to those of other payment processors like VISA.
In addition to the aforementioned, the whole cryptocurrency market is now struggling. As Bitcoin prices fell below their psychological level of $20,000, the sentiment in the cryptocurrency market appears to be gloomy. Because of this, the cost of Dogecoin is probably going to remain stable between $0.055 and $0.075 through the end of 2022.
Cryptocurrencies are anticipated to be widely used by 2030. Given that the internet is practically ubiquitous worldwide access to a person's preferred token is simple on earth. A meme token created to be a humorous representation on the internet is called Dogecoin. Today, most people choose to spend their time having fun online. Dogecoin can be used to tip content producers all over the world.
Dogecoin might experience a significant price growth from today, hitting prices between $2 and $4 and a market worth between $266 billion and $533 billion by 2030, if this scenario comes true.
LIKE, COMMENT AND SHARE.

VISA About to start a historic Bull Cycle similar to post 2009This is Visa Inc. (V) on the 1W time-frame. The primary pattern since the July 26 2021 All Time High (ATH) has been a Falling Wedge and the price continues to hold that formation after being rejected on the August 15 candle on the Lower Highs (top) trend-line. With the 1W MA50 (blue trend-line) crossing below the 1D MA100 (green trend-line), the first Bearish Cross since March 14 2011 has been formed!
In fact that Bearish Cross capped off a similar trading pattern to that Visa has been trading in since mid 2019. This idea compared the two eras: 2019 - 2022 and 2008 - 2011.
In 2011, the stock was trading within a Channel Down as the accumulation pattern instead of a Falling Wedge, with its Lows contained around the 0.5 Fibonacci retracement level. Following the Bearish Cross and the pull-back that came with it, the price made one last Lower High, pulled-back and then broke above the pattern aggressively. If the same formation continues to be repeated then we can have a break above the Falling Wedge by December/ January. See also how the RSI and MACD patterns are similar.
--------------------------------------------------------------------------------------------------------
** Please support this idea with your likes and comments, it is the best way to keep it relevant and support me. **
--------------------------------------------------------------------------------------------------------

V: Who is going to win, BULLS OR BEARS?? Ticker Symbol: $V
Strategy: Neutral until break either side on Rising wedge
Time Frame: 4HR
TRENDSI ATS: BEARISH (RED DOT WITH RED LINE)
RSI Technical: Bearish.
$V is making Descending Triangle Pattern, which is Bearish. Also, formation of Rising Wedge in last couple of weeks, that is Bearish as well.
I am still NEUTRAL, until I see breakout confirmation on either side.
Follow for daily stock, crypto and forex technical analysis.
⚠️ Trading is risky, and I understand nothing is guaranteed. Proper risk management should be in place at all times to minimize losses. Please consult a financial advisor before trading. All Inclusive Trading LLC is not a financial advisor and may not be held liable for any losses which may occur.

🤖 #BTCLIVE - 05.08 - #IDEA 🤖🤖 #BTCLIVE - 05.08 - #IDEA 🤖
70:30 Long-Term
Bullish:Bearish
Technical Analysis:
Current Status:
Confirmed a descending broadening wedge - since the 1st August with the latest to failed breakouts. These are particularly bullish patterns - based on historical data showing a 79% frequency of breaking up from them. In the same data set it is claiming a 33%, although suggest you ignore that. With options expiration there is expected volatility which could see the breakout happen today although based on the most recent rejection we have seen some good support come at the POC line and 20 DEMA was lying in wait just below too. If it breaks out again things are turning v.bullish although breakout is not confirmed yet.
Bullish Scenario
Breaking and retesting $23.4k will see a short term target of approx. $24k and a bigger term target of $25.5k
Bearish Scenario
A Break down and retest of $22.7k will likely start the descent to $21.5k at the lower range of the longer term - breaking down on that will spell major bloodshed.
Key News:
- Pornhub no longer uses VISA/Mastercard likely to fall back on Crypto
- Coinbase has received a class action lawsuit alleging the #crypto exchange made false claims regarding its business activities
- Options Expiration
- Elon Musk said to expect a recession
Metrics:
Exchange
+ Exchange Reserve - As the exchange reserve continues to fall, it indicates lower selling pressure.
- Exchange Netflow Total - Net deposits on exchanges are high compared to the 7-day average. Higher deposits can be interpreted as higher selling pressure.
Miners
/ Miners' Position Index (MPI) - Miners' are selling holdings in a moderate range compared to its one-year average.
+ Puell Multiple - Miner's revenue is decreasing significantly compared to the cost they put in. This could indicate that price is undervalued along with the increasing miner's motive to hold their coins.
On-Chain
+ aSOPR More investors are selling at a loss. In the middle of a bear market, it can indicate a market bottom.
+ Binary CDD - Long term holders' movement in the last 7days were lower than the average. They have a motive to hold their coins.
+ Net Unrealized Profit and Loss (NUPL) - Investors are in a Fear phase where they are currently with unrealized profits that are slightly more than losses.
+ Transfer Volume - The total number of coins transferred has increased by 315.00% compared to yesterday.
+ Active Addresses - The total number of active wallets used to send and receive coins has increased by 21.00% compared to yesterday.
+ Transactions - The total number of transactions has increased by 72.00% compared to yesterday.
Sentiment
+ Coinbase Premium - US investors' buying pressure is relatively strong in Coinbase.
- Korea Premium - Korean retail investors' buying pressure is relatively strong.
- Fund Premium - Investors in funds and trusts including Grayscale have relatively weak buying sentiment.
Derivatives
+ Funding Rate - Long position traders are dominant and are willing to pay to short traders.
- Taker Buy Sell Ratio - Selling sentiment is dominent in the derivatives market. More sell orders are filled by takers.
/ Open Interest - As OI decreases, it indicates investors are closing futures positions and possibility of trend reversals. In turn, this might trigger the possibility of long/short-squeeze caused by sudden price movement or vice versa.
+ Liquidation - 15624591.41 of short positions were liquidated in the last 24 hours.

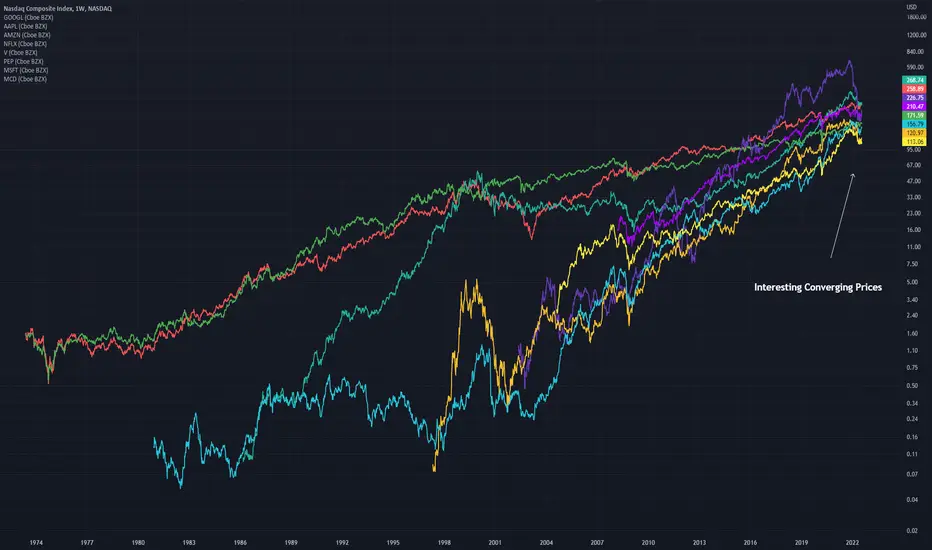
Top Performing Stocks ConvergenceAn Idea showing some of the best performing stocks
GOOGL
AAPL
AMZN
NFLX
V
PEP
MSFT
MCD
I find it interesting how they are all converging to the same point. Do you find this observation to be bearish or bullish? Or nothing at all?
Evotrade: Visa upside for a minimum of 4 till maximum of 7 daysThe chart shows in yellow index cycles by linking swings of minimum .
W= weekly cycles (7-11 days)
2W= bi weekly cycles (12 to 21 days)
12W= three month cyclce (45 to 86 days)
every major cycles is made of minor ones e.g. 2W= W+W, 4W= 2W+2W/ 2W+W/W+W+W
The chart also shows in white inverted cycles by linking swings of maximum (Same rules are applied as for the index ones).
Knowing the combination of the two, when a critical swing (maximum/minimum) is broken within a certain time, it is possible to calculate the remaining time in which a long/short position can be hold.
In this case given that the higher price of the critial swing Wi at 208,12$ was broken yesterday after only 3 days, the remaining time as for the title will be used to increasingly push the price up.
There is time to open long position from minimum of 20th of july till a maximum of 26 of july.
WARNING
The position hold till 20th of july is the minimum time till the cycle will be completed. From the 20th till 26th despite the inverted cycle has time to further push the price up, an inverted weekly cycle can begin as well, pushing the price further down. As a consquence holding a long position after the 07/20 can be risky.

VISA Downtrend TriangleNYSE:V
This is a continuation pattern that indicates that sellers are more aggressive than buyers, and is usually resolved with a break of the downside trendline. The signal would be deceived a close under the lower trendine with an increased in Volume . There might be a comeback move after the break of the lower trendline, but it should encounter resistance in the lower trendline.

Visa still trending downThis is a clear downtrend, which should push price down, starting today/tomorrow.

CRO daily...whoa, are you ready for this?CRO Daily chart: well where do we start...the company is screwing everyone
with there horrible cuts in % staking rewards along with many other features
going into the toilet, but, the chart is playing out how it should. Take a look
at the white consolidtion box... .50 and .32 were the support and resistance
levels...and the DeMark 9 has read a triple bottom...only thing, it wicked under
the support but is holding right at it...I feel the sell off is bc of the horrible
email users recievecd over the lst couple days...lets see if it will hold support
here and make a move to the upside... the retracment to thje golden pocket
would be a nice spot for it to get back too and i could see that scenaro if
we hold here...if not, $0.22 could be the elevator down to. RSI is way oversold
as well which makes it a great floor.

V bearish to 210.08Visa had a nice climb but it is over extended from my data points and has a high degree 83% probability of pulling back "to and below" 210.09 end of the week. However, you can always establish this target for next week in terms of duration of trading vehicles (e.g. options).

Visa - Can it Still Jump 30%?Is the financial giant Visa still able to show upside of up to 30% given the struggles in the world?
Fundamental indicators:
Revenue and Profits - keeps growing and beating expectations
Profit margin - is at circa 50% which makes it one of a kind
P/E - is quite high at 35x but may be deemed acceptable with this sort of business efficiency
Liabilities - no problems there
Risks:
Recession - is most likely approaching hence will eventually impact this impressive business as well
Eastern Europe conflict - suspension of business in Russia will have some impact on earnings
Technically:
It is clearly visible that Visa was enjoying exponential growth up until 2020 - which can be marked as global wave 3 using Elliott Wave count
Following Fed's pump of money into economy it stretched the correction into a Running Flat which ended in February 2022
And now we are potentially enjoying the final fifth wave which already looks that it may develop into Ending Diagonal when observing in lower timeframe
Specifically it looks like the first wave has already been formed by zigzag ,and now that the second wave has completed the third wave is developing
Depending on the shape of the fifth wave, Ending Diagonal or Impulse, the target is potentially ranging from $250 to $270 using Fibonacci levels
Alternative scenario - there is an alternative scenario that the fifth wave has already completed but it looks very unlikely at the moment
So the question is - will Visa be 'the last man standing' continuing the growth before crisis hits the global economies?
What are your thoughts about this scenario?
Please share your thoughts in the comments and like this idea if you would like to see more stocks analysed using Elliott Waves.
Thanks


VISA (V) Major BULLISH signal !I expect the visa shares to climb after the announcement of the results.
Visa should report yet another strong quarterly results.
Disclaimer: All content has only educational and informational purposes, and never should be used or take it as financial advice.
