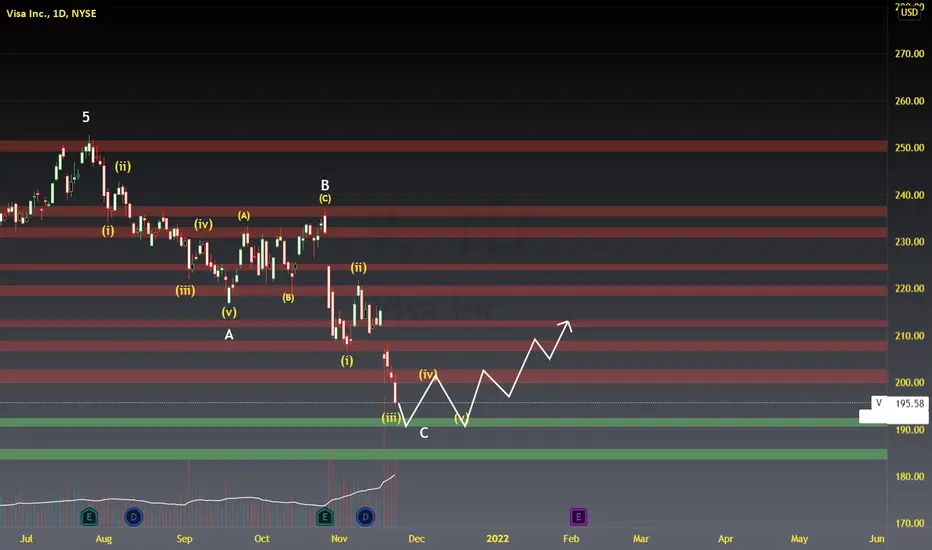
VISA SEEMS READY TO CHANGE DIRECTIONPlease find my $V analysis.
I believe we will soon reverse to the long side. Today's was a strong day, but still we might go lower as per the chart.
Visa

$V - Visa in a major bearish downtrend $134 PTIf you draw a trend since 2011, it looks like it can retest the $134 level (which has acted as major support levels multiple times. I would not buy at current levels.

Omicron fear?A thanksgiving not exactly calm, that of 2021, ruined by a really black Friday on the financial markets.
Omicron, the name of the new variant, is frightening.
We know that markets are driven by two main feelings, fear and euphoria. A nd it is my, our job, as traders, to stay away from both of these feelings, which do nothing but make us lose money and do the exact opposite of what should be done.
Those who know me know that I am absolutely a realistic person, I try to analyze the situation, without ever panicking at the moment, so I brilliantly overcome the coronavirus crisis, buying when everyone was selling and enduring even important drawdowns, only to be repaid.
Now, I’m certainly not saying that we are dealing with another V shape from -30% as in 2020, also because, those who have a bit of intelligence know that, given that we are talking about viruses, we will always have in front of us. of mutations, is its nature.
We must accept that we will have to live with it, using the weapons that science provides us.
Consequently, next week, considering that while I am writing to you news continues to arrive on the appearance of the variant in every European state, it is very likely that fear will continue to prevail, causing further declines, which by the way, as I have been writing for a while of time, they would be healthy.
All right but, when to buy?
And above all what?
The crux of the matter is the tightness of the vaccines to t he Omicron variant.
If, as has happened with the variants that have appeared so far, the protection is solid, then we could see a correction that could not go beyond 10-15% creating buying opportunities for a short Christmas rally.
If, on the other hand, vaccines should prove ineffective, rest assured that volatility will rise and the correction will be more marked.
Never as in these moments, you have to be calm and wait for the news.
As for the markets, I believe we will see a sudden rotation in tech stocks, digital payments, and video games. As well as obviously social networks and e-commerce.
Beware of pharmaceuticals, because they are already very inflated, except perhaps Moderna, which has just returned from an important pull-bak, and Novavax which is in the pipeline with a new vaccine.
Those who follow me know that I am already positioned on companies such as Activision, Visa, Square, Amazon and Facebook (Meta). Accumulations could arrive on these stocks if they suffer a decline caused by a general sell-off.
If we talk about accumulation for the long term, it is precisely the companies that work in tourism and which are related to oil, those that could suffer the greatest discounts and consequently the best purchasing opportunities. I’m talking about Airbnb, a company I strongly believe in, where I have an excellent average purchase price, and I will certainly buy more shares. Attention also to airlines such as Delta and American Airlines and obviously attention to ETCs on oil because a significant drop would create further buying opportunities on a commodity that has given me (and I hope you too) 100% earnings in 2021.
Possible increases in gold in the medium to long term, both from seasonality and obviously as a safe haven asset, even if during the first appearance of the covid, this was not exactly the case.
The resilience of cryptocurrencies should also be verified. Absent extremely volatile, absolutely not to be considered a safe-haven asset, has the undoubted advantage of being decorrelated from the numerous problems that can afflict traditional financial markets. There may also be a quick rotation here which could cause significant rises.
I greet you and I wish you a happy Sunday, quoting Warren Buffett because it is the wise men that we must look at in moments of emotion: “Be greedy when others are afraid and be afraid when others are greedy”
Happy trading and stay safe.
Lazy Bull
DISCLAIMER: I am not a financial advisor nor a CPA. These posts, videos, and any other contents are for educational and entertainment purposes only. Investing of any kind involves risk. While it is possible to minimize risk, your investments are solely your responsibility. It is imperative that you conduct your own research. I am merely sharing my opinion with no guarantee of gains or losses on investments.

Bands Bands BandsThe Bollinger Bands said buy a few days ago. Not a trader, don't teach trading. This signal has been making gains both in the traditional markets as well as in Crypto. Using the red arrows AND volume as sell signals it also has protection for the downside. That said, Bitcoin is making huge headway regarding adoption & Taproot, brings smart contracts to The Blockchain. As of this writing Bitcoin has surpassed Visa in value transfer metrics. Bitcoin USES Visa as a bridge to evacuate dollars from the traditional finance system into the decentralized finance system. We're still early. Lots of people still have no idea what Bitcoin is or that they'll need it to beat inflation & global instability. Once the Plebs catch on that dollars rob them of their value, there will be an explosion of adoption & rapid rise in price.

VISA preparing for the bull runVisa ( NYSE:V ) has entered an important zone and has already fallen more than 20%, which is quite rare for Visa apart from major worldwide crashes. Basically said, Visa is cheap relative to its performance and even though Amazon's negative news affected last days of the price of Visa, those two companies are still in discussion about cooperation and I believe it will be eventually resolved.
Now, I am looking for a significant pullback and breakouts from minor trendline. I have started trading in small positions and accumulate in following days.

V at 50MA, price channel and demand zone, could go to 240-250 V is bouncing from 50MA and a demand zone. Also, it touched a bottom trendline in a price channel.
Entry level - above 225
Target level - 240-250
Stop-loss - 219.50
Size - 5% of the capital
Period 4-6 weeks

V dailyGood company to have in your portfolio. You want to buy a bouncing ball company, not those that are rocks. V will EVENTUALLY rebound, wait for any confirmation of reversal (candle stick pattern or chart pattern) to load, that drop was on notable volume. 195 is also a notable area, 150weeklyMA. We can also see a bullish divergence on the RSI.
According to my DCF, Visa is currently undervalue, R/R to have Visa in your portfolio is now bigger than not having it in my opinion.
DCA is the way to go.
Visa (V) LongFrom the highs of July, Visa has lost more than 20%.
To "complicate" the situation, the news released before the opening of the markets on November 17, namely that Amazon wants to ban the use of the famous credit card in the UK.
I ... I had bought the previous day.
Hey ... this is trading.
However, we are talking about Visa and obviously, part of my strategy is to always enter in brackets, so the news, apart from the emotionality of the moment, could create an additional investment opportunity, should Visa continue its descent up to certain levels.
The company is clearly solid, and from a statistical analysis, I noticed that the pull-backs, over the years, as well as being very rare, are on an average of -18%, so we are at a discount, that is to say, it is the time to buy.
Not to mention that I don't think Amazon's decision is final; a deal will be found and when it does, the volatility will be high. (It is, therefore, possible to exploit the momentum by buying call options).
Should the price continue to fall, the entry or accumulation levels in my opinion are as follows:
- $ 190.23: important volumetric level
- $ 179.50: post-covid breakout level, would act as a major resistance.
Target:
- 235 $: important volumetric level where the price will surely react
- $ 250: just before the highs, total take profit
Happy trading
Lazy Bull
DISCLAIMER: I am not a financial advisor nor a CPA. These posts, videos, and any other contents are for educational and entertainment purposes only. Investing of any kind involves risk. While it is possible to minimize risk, your investments are solely your responsibility. It is imperative that you conduct your own research. I am merely sharing my opinion with no guarantee of gains or losses on investments.

V - VISA - We hope for a better purchase priceIt is in a zone of possible technical rebound but with SHS structure in formation.
Ideally, it would be a pullback to: 61.8%, ext. 161.8% + POC.

Visa | Short Term Bearish / Long Term BullishI'll try to be brief: all the indicators and trend lines indicate a low-volatile (which is an advantage for the solidity especially in a long-term perspective) and growing trend of Visa. However, following the trend from March 2020 (as I always say "the new modern era for the world") until today November 2021, Visa has always retraced each level of the Fibonacci retracement until it touches its maximum peak, resulting in and current decline (currently Visa broke the previous trendline, but it was predictable as its trend up to that moment was really exaggeratedly bullish).
Due to the low volatility of the market I suspect that the retracement in the short term could lead Visa to further losses, I assume an additional 3 or 4 points up to around $ 206/207 per share (which is not many in a long-term perspective anyway but for a day trader instead can be an abyss), coinciding with the 0.382 Fibonacci retracement; at that moment I have good reason to think that Visa will restart its bullish run also quite efficiently (let's say that by early 2022 I would not be surprised if we were at $ 260 per share) to get back in line with its innovative power and with the previous trend which has just been broken, as mentioned before.
In conclusion, as usual DYOR (!!!), mine is just a "brainstorming" seeing the chart and knowing the company, however I admit I have a recently opened position on Visa, so I have no reason to lie :)

VISA BEARISHa head and shoulders pattern identified and confirmed in VISA
OBJECTIF 1: 200
OBJECTIF 2: 190
OBJECTIF 3: 180

VISA TO HOLD LONG-TERM NOW!!!!Here is my Visa inc. report. As per the report, you should buy and hold Visa for a longer term as it consistently shows upward strength and growth throughout its time.

VISA WEEKLYRules:
-If price break Point 2, 4, or 6 cancel the setup
-Price needs to break Point 1, 3, and 5 to confirm the setup
When price reach the 100FE it normally does a pullback or reversal
The market can Truncate

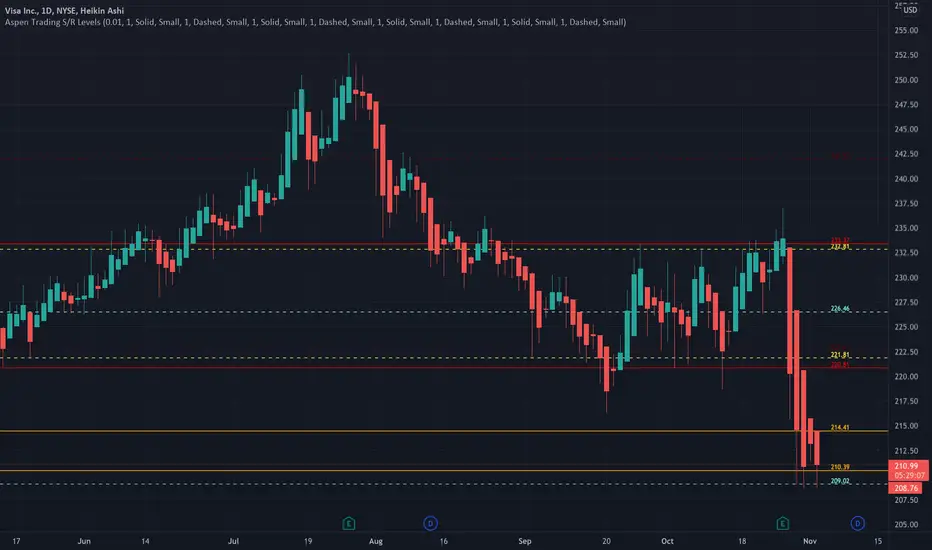
V looks bullish using Aspen Trading S/R LevelsAspen Trading S/R Levels are predicting support for Visa @ 209.02.
Visa is looking bullish for the remaining part of the year.
Another tailwind is that Visa typically displays seasonal strength this time of the year.
Please like, share and follow if you agree with the analysis.
Note - Aspen Trading S/R levels are invite only. They can be accessed through my profile information.
Post 10/26 Q3 FY21’ Earnings Analysis$MMM, $AMP, $GOOGL, $GE, $AMD, $COF, $HAS, $V, $TWTR, $UPS, $RTX, $NVS
$MMM - 3M - reported EPS of $2,45/share - beat estimates of $2.21/share - revenue of $8.94B +7.09% YoY
Organic local-currency sales up 6.3% YoY
Operating CF of $1.9B
Adjusted FCF of $1.5B (20%) YoY
Returned $1.4B to shareholders in dividends
Industrial FCF tops estimates
Narrows FY21 EPS outlook - trims full-year earnings view on supply chain challenges
Down (0.09%) after hours
$GOOGL - Google Alphabet Class A - reported EPS of $27.26/share - beat estimates of $19.89/share
Revenue of $53.62B
Top Line growth of 44%
Ad Revenue of $53.13B up 44%
Revenue from Cloud Division of $4.99B up 45%
Reported a $188M gain on investments up 623.1% YoY
Down (0.22%) after hours
$GE - General Electric - reported EPS of $0.57/share - beat estimates of $0.24/share - revenue of $18.43B down (0.5%) YoY
Improvements in FCF performance & growth in earnings - despite weakness in revenues
Bottom Line up 50% YoY
Sales suffered from weakness in Healthcare & Renewable Energy segments - partially offset by gains in Aviation
Organic & Industrial Revenues down (1%) YoY - Aviation Revenues up 10% YoY
Up +0.01% after hours
$AMD - Advanced Micro Devices - reported EPS of $0.73/share - beat estimates of $0.67/share - revenue of $4.31B up 54% YoY
Adjusted Gross Margin of 48% - in line with estimates - up 44% YoY
Capital Expenditures of $85M
Computer/Graphics segment revenue of $2.4B up 44% YoY
Q4 revenue estimates raised to $4.6B
Down (0.41%) after hours
$COF - Capital One - Reported EPS of $4686/share - beat estimates of $4.99/share - revenue of $7.83B +6.1% YoY
Earnings Surprise of 31.42%
Beat consensus EPS estimates past 4 quarters
Revenue rise reflects loan growth
Net credit card charge-offs improved in Sept
Down (4.01%) after hours
$HAS - Hasbro - reported EPS of $1.96/share - beat estimates of $1.70/share - revenue of $1.97B +10.88% YoY
Operating Profit of $367.9M up 9% YoY
Adjusted Operating Profit of $389.6M up 6% YoY
Net Earnings of $253.2M up 15% YoY
Adjusted Net Earnings of $271.2M up 5% YoY
Supply chain challenges weigh on top line
Further reduced debt & maintained a strong cash position - repaid $400M of debt & funded quarterly dividend
Up +1.46% after hours
$V - Visa - reported EPS of $1.62/share - beat estimates of $1.53/share - revenue of $6.56B up 27.45% YoY
Earnings Surprise of 5.88%
Surpassed consensus EPS estimates past 4 quarters
Announce boost in quarterly dividend
Down (2.60%) after hours
$TWTR - Twitter - reported EPS of ($0.54) - missing estimates of $0.02/share - revenue of $1.28B up 37% YoY
Reported a net loss of ($537M) vs. $29M in FY20' due to a legal settlement - does not expect to recoup the full revenue loss
Ad Revenue rose more than 41% YoY to $4.14B up 6% YoY
Number of Monetized users grew by 5M - user base up 13% YoY
Apple's privacy changes to iOS 14 has less of an impact than expected
$UPS - United Parcel Service - reported EPS of $2.71/share - beat estimates of $2.55/share - revenue of $23.18B
US Domestic Package Revenues of $14.2B up 7.4% YoY
Bottom Line up 18.9% YoY with strong performance across all segments
Top Line up 9.2% YoY drive by up beat demand for e-commerce related package deliveries
Operating Profit of $2.97B up 23.4% YoY
Up +0.52% after hours
$RTX - Raytheon Technologies - reported EPS of $1.26/share - beating estimates of $1.08/share - revenue of $16.2B up 7.7% YoY
Sales of $16.2B - missing estimates of $16.9B - up 9.9% YoY
Operating Profit of $1.3B - up 209.5% YoY
Bottom Line up 125% YoY - attributable to higher YoY revenues & operating profit
Newly disclosed quarterly dividend paid $0.51/share on 10/19/21 - represents a $2.04 dividend on an annualized basis
Down (0.46%) after hours
$NVS - Novartis - reported EPS of $1.71/share - beat estimates of $1.64/share - revenue of $13.03B up 6.2% YoY
Net Income of $2.76B up 43% YoY
Net Sales $13,03B up 6% YoY - volume contributed 9 percentage points to sales growth
Down (1.38%) after hours

VISA bearish analysisV, bear flag forming on the daily chart. plus looks like a Head and Shoulders pattern forming which is a bearish pattern. Visa has earnings this week.

Visa Is Starting to Rise Up !Hello everyone, as we all know the market action discounts everything :)
_________________________________Make sure to Like and Follow if you like the idea_________________________________
It looks like Visa Bearish movement has ended when a Breakout of the Descending Channel happened on the 23rd of Sep. after that the stock has started moving sideways with a small edge to the upper direction.
The breakout point has formed what seems to be a solid support level where the market was able to bounce twice from.
The 19th of Oct was a great day for the stock where the market value has jumped from 228.27 to 233.52, a 2,2% increase in 1 day and this bullish push doesn’t seem like it's going to stop yet.
Possible Scenarios for the market :
Scenario 1 :
The market seems to be having a good Bullish momentum at the time this will lead the stock value to push up and hit the resistance level located at 235.14, If the buyers were able to gather more force and breakout that resistance then we will be seeing the price zigzag until it gets to the resistance level located at 247.63.
Scenario 2 :
The Bears might attempt to drive the market back into the descending channel range but they will be met by a big support zone that’s located near the 224.00 range, where a lot of buy power is located, if the Bears were able to drive the price to that level then we will see a big battle where the price will most likely bounce back up and return to Scenario 1 movement.
Technical indicators show :
1) The market is above the 5 10 20 50 100 and 200 MA and EMA (Strong Bullish Sign)
2) The MACD line has crossed the 0 line indicating the market changing from a Bearish state to a Bullish state. With a positive crossover happening between the MACD line and the Signal line
3) The STOCH is in the overbought zone with a positive crossover between the %K and %D
Daily Support & Resistance points :
support Resistance
1) 228.28 1) 232.90
2) 225.90 2) 235.14
3) 223.66 3) 237.51
Weekly Support & Resistance points :
support Resistance
1) 222.71 1) 235.17
2) 214.44 2) 239.36
3) 210.25 3) 247.63
Fundamental point of view :
Large credit card giant Visa is moving into the cryptocurrency space with its own version of credit cards, opening up opportunities for certain large-cap growth ETFs.
With a stake in Visa, ETF investors can play VISA move towards the cryptocurrency space with the Invesco Dynamic Large Cap Growth ETF (PWB).
Indicators point to continued Q4 strength in the domestic air travel recovery, and that's good news for Visa.
The 7-day moving average of U.S. COVID-19 cases, a leading indicator for domestic restrictions and travel, continues to decline since mid-September and Transportation Security Administration screenings as a percentage of 2019 levels improved to 85% from 83% in Evercore's prior Global Air Travel Tracker issue.
This is my personal opinion done with technical analysis of the market price and research online from Fundamental Analysts and News for The Fundamental point of view, not financial advice.
If you have any questions please ask and have a great day !!
Thank you for reading.

Visa Inc. (V) bullish scenario:The technical figure Triangle can be found in US company Visa Inc. (V) at daily chart. Visa Inc. is an American multinational financial services corporation. It facilitates electronic funds transfers throughout the world, most commonly through Visa-branded credit cards, debit cards, and prepaid cards. Visa is one of the world's most valuable companies. The Triangle has broken through the resistance line on 16/10/2021, if the price holds above this level you can have a possible bullish price movement with a forecast for the next 19 days towards 240.18 USD. Your stop loss order according to experts should be placed at 218.63 USD if you decide to enter this position.
Risk Disclosure: Trading Foreign Exchange (Forex) and Contracts of Difference (CFD's) carries a high level of risk. By registering and signing up, any client affirms their understanding of their own personal accountability for all transactions performed within their account and recognizes the risks associated with trading on such markets and on such sites. Furthermore, one understands that the company carries zero influence over transactions, markets, and trading signals, therefore, cannot be held liable nor guarantee any profits or losses.

V - STOCKS - 11. OCT. 2021Welcome to our Weekly V2-Trade Setup ( V ) !
-
4 HOUR
Market about to turn.
DAILY
Expecting more bullish price action.
WEEKLY
Buying the turnover!
-
STOCK SETUP
BUY V
ENTRY LEVEL @ 229.37
SL @ 220.54
TP @ Open
Max Risk: 0.5% - 1%!
(Remember to add a few pips to all levels - different Brokers!)
Leave us a comment or like to keep our content for free and alive.
Have a great week everyone!
ALAN

AFRMScalping lvls here for AFRM .. if market sentiment was bullish I would believe this would breakout to upside but am skeptical with how market is digesting currently. Therefore here's both sides to this hot name.
Break above 115 - > 119
Break below 106 - > 100 - > 96

$VVisa the largest global electronic payment solutions company, gained a meager 5% – increasing from about $219 at the beginning of 2020 to around $230 currently, underperforming the S&P500, which grew 20% over the same period.
However, the company’s payments volume has seen some recovery over the recent quarters – nominal domestic payments volume and nominal cross-border volume increased 18% and 10% year on year in Q3.
There were two clear reasons for the improvement in payments volume:
First, easing of travel bans and Covid-19 restrictions in several countries, second, the U.S. government’s approval of the $1.9 trillion coronavirus relief package in March.
Visa without question is a strong company.
Visa had a slight pullback as it started to get a little overbought on the daily, now it’s coming out of oversold territory.
A nice clean break of downward channel has been broken and we could be seeing a good old retest of previous resistance to see if it’ll act as support.
Watchlist.
- Factor Four

VISA LONGVisa had a dip of 13% in the last 2 months, which makes it a great opportunity to buy on long term, unless a stock market crash happens in the next 6 months. On a daily timeframe, the stock created a descendent channel, and it was broken, making the 200MA a strong support. Long term potential📈

VISA LONG Since the end of 2020, Visa stock has been on a steep climb. Indeed, after rising more than 40% from November 2020 to October 2021, the stock reached its annual highs at $251.77. The stock is now trading at $225.56 just above our pivot point at $215.50 (blue line). In addition, the stock is in an ascending channel and currently near the lower bound. But the 200-period moving average is still at $223.73, which confirms our bullish scenario. We anticipate a continuation of the rise towards $233.00 (first green line) at first and then towards $249.20 (second green line).
Alternative scenario: A clear break of the pivot point at $215.50 (blue line) would lead to a return to $206.72 (red line).
