Visa

$V weekly updatedLooking for $237 next week to close remaining positions. Other calls were at +102% : )

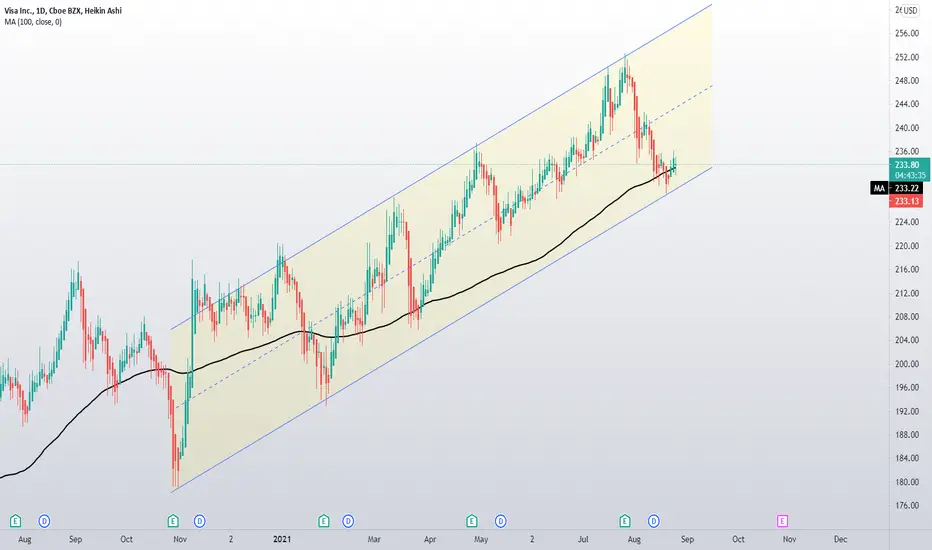
V Buy ideaVisa currently on the bottom line of the downtrend (white lines) and wicked on the 50 weekly MA on september 17th. Depending on market sentiment, we may have found V bottom. I keep V on watch for a long term buy with earnings coming end of October. V is currently undervalued based on my personal DCF. Full reversal over 228 !

Visa [LONG]Looks like a good initial entry on Visa - still potential move to downside but at a long term risk to reward i'm comfortable with.
Positive divergence on RSI along with key fib levels and weekly EMA support.
** NOT INVESTMENT ADVICE **

Visa Bull FlagMentioned Visa a few days back. I think this looks like it is setting up to move higher. Visa: LONG.

Visa Not Looking So HotMore on this later, but the chart indicates weakness. That said, I am not sure what to make of the bear wedge just yet. Does this lead the entire market lower? Do we go sideways for a little while and then take off higher?
For now, really interested in the price action at $214 and will continue to monitor.

Short on visa INC. in D1Take visa INC. in the correction and place the SL above the previous high
to close signal wait for ichimoku signal ( 5 tenkan sen cut 26 kijun sen ) in H4

$V Analysis & Key Levels - REQUEST - I hold no position$V Analysis & Key Levels - REQUEST
Ok, Radu5, so $V does not typically stay under the 180 EMA (Purple) for too long. The average is around 10 days. (22 days if you count the crash of 2020 in March.)
And so far it looks like the 180 EMA is trying to be support but I think it will break under just looking at the MacD . The MacD is under zero and as long as it’s under zero it’s in the bear zone. Again… it doesn’t seem to stay there very long.
SO… if you’re going to add to your position, do it at the support levels only (Green lines and numbers)
Once you’re back above the 180 EMA and the 35 EMA you’ll be back where you want to be. Once it’s above the 35 EMA you’ll be above the 0 on the macD and then just hold for as long as the MacD stays above 0.
I don’t know what indicators you use but if you just add 35 EMA , 180 EMA and a MacD that should be enough to let you know where to enter and where to exit a trade.
I hope this helps.
—————
I am not your financial advisor, but I will happily answer questions and analyze to the best of my ability but ultimately the risk is on you.
Red = Resistance
Green = Support
Blue = trendlines
Have fun, y’all!!

ACH Alchemy Pay short term upside potential If you haven`t bought at my first call:
Then looking at the bullish flags and measuring the afterwards movements, the short term price targets is 0.16usd.

V: Triple BounceVisa has been bouncing clearly on ema 200 and also on bull trend line, 3 times! Very clean and Rebound. Bounced off a major support level at $220 beautifully. Visa has been trading at a very rich valuation, over 40x earnings and 20x sales. Its been selling off recently, down about 10% from all time highs. MACD is bouncing to positive and there is a V bounce at RSI.
Revenue growth has been strong despite the pandemic and the company continues to make acquisitions to lead the fintech sector.

Time to VISA (V)In early august, Visa crossed the EMA 200 and began a dangerous descending situation. In September 2nd, the stock dropped near support ($221) but it didn't cross the line, good news for all investors. Now the stock has confirmed the ascending trend raising up from the support. I'm in at $227.5.
Special atention the next days, when it can cross up the EMA 200 and try to raise a new max.
What do you think about this Stock?
Thank you!
Cheers and nice trade!

$V LONG #VISACheck out 3 green points on chart ...
rsi and 200ma support
the previous like before story
DISCLAIMER

$V Sellers ExhaustionThis week bulls need to defend the AVWAP level at 222.47
Sellers may be exhausted here and a reversal is implied looking at historic similar volume and price action. However, break below could see 215/210 zone as next level of strong support. Would be backing up the truck and loading longs if we get a chance that low.

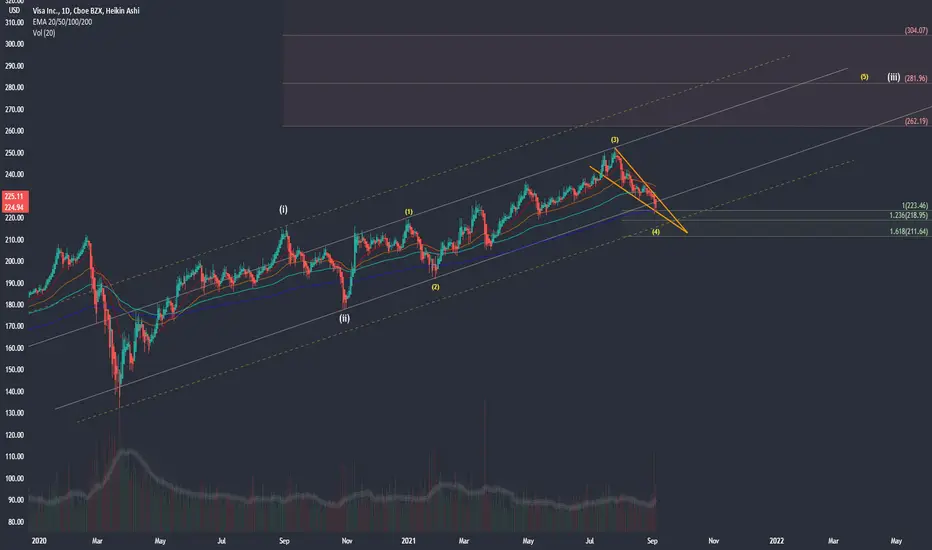
VISA - WAITING FOR BUY SIGNAL#VISA gave us a nice pullback here in minor wave 4 and now I am waiting for the buy signal for completion of minor wave 5 and major wave 3. We can see in the chart that we typically get a small bounce off the 200 EMA but in the past, they have pulled this below 200 EMA only to jerk it back up. Green box is my buyzone inside this falling wedge. Awaiting buy signal using volume candles and fib levels provided.

V could hit $250 by mid NovemberIf the symmetry plays out as previous occasions on the weekly chart, we should see V hit $250 price target by mid-November.

$V support confirmed yesterday #visa great support confirmed yesterday at visa
green day today and here!
disclaimer

What to look for (Visa)There are some notable bull signs that can be seen on Visa. One of them is a close above the swing low. Another bull signs is the reducing selling momentum + Willy Oscillator. Another bull sign I want to brief on is the Weis Wave. The weis wave is indicating that there is less interest on the short side of Visa. I'm personally awaiting a shift in the weis wave to confirm that we are consistently getting less interest towards the short side and will then execute long positions on this stock, but I believe the probabilities are stacked in the favor of longs.
Bullish Signals
-Squeeze indicator
-Willy Oscillator
-Weis Wave
-Fib Support
▼Side Note▼
-On the 15 min Chart we were given a sell signal. This may potentially allow for dips to catch if it is followed by reduced momentum.

$V Weekly Technicals and FundamentalsTechnicals :
Respecting Anchored VWAP at $230 and also 21MA & volume shelf as support. Trading the bottom of upward channel with historic strong bounces (black arrows). Also uptick in RSI and bullish trend in OBV indicator.
The above indicates a move up, however a break below we could see 218.12 or the 50MA as next line of support
Fundamentals:
Visa’s earnings of $1.49 per share, outpaced the Zacks Consensus Estimate by 12%. The bottom line improved 41% year over year. Next quarter's EPS est $1.54
The company’s net revenues advanced 27% year over year to $6.1 billion in the quarter under review. The top line beat the consensus mark by 5.1%.
I'm bullish with 10/15 $240C

HBAR Cup & Handle103 Days consolidation, Cup & Handle formation in progress, fundamentally strong project and has ties with many big names like Google, IBM, VISA

V MTF ANALYSIS Looking for a confluencw of crypto adoption, overdrive of E-commerce expansion & Oct earnings. NO TP TUTES WILL SHOW YOU


$V Trading the ChannelRemoving some indicators to eliminate some noise.
Break out of channel invalidates trade, looking for a move to middle of channel
Entered 10/15 240 Call and 230/225P bull credit spread