VISA on a strong Bullish Leg targeting $440.Visa Inc. (V) has been trading within a Channel Up pattern since the October 10 2022 market bottom. After December 2022, every test of the 1W MA50 (blue trend-line) has been the most optimal long-term buy opportunity, being also a Higher Low (bottom) of the pattern.
Every Bullish Leg has been +5% stronger than the previous, which leads us to believe that the current Bullish Leg will peak at around +49.50% (+5% from +44.60%). This translates to $440 Target towards the end of the year.
-------------------------------------------------------------------------------
** Please LIKE 👍, FOLLOW ✅, SHARE 🙌 and COMMENT ✍ if you enjoy this idea! Also share your ideas and charts in the comments section below! This is best way to keep it relevant, support us, keep the content here free and allow the idea to reach as many people as possible. **
-------------------------------------------------------------------------------
💸💸💸💸💸💸
👇 👇 👇 👇 👇 👇
Visasignals

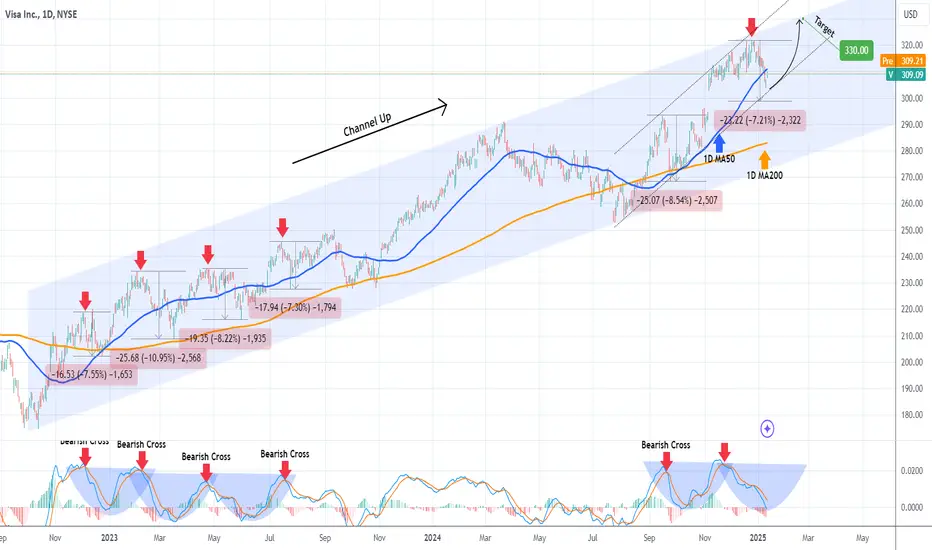
VISA issuing the first buy signal of the pattern.VISA Inc. (V) has gone a long way since our buy signal almost 5 months ago (August 29 2024, see chart below):
As you can see it was a buy signal just before a 1W MACD Bullish Cross, and straight hit our $320.00 Target before it started pulling-back again the past 30 days.
The +2 year Channel Up pattern is intact and in fact the recent break below the 1D MA50 (blue trend-line) is the first buy signal that is being waved as the price is almost at the bottom of the internal (dotted) Channel Up, which is the Bullish Leg of the +2 year pattern.
The minimum decline within this pattern has been -7.30% so there is still some room for a new low but the 1D MACD indicates we might be seeing a Bullish Cross soon.
In any case, this is a solid level for a first buy entry if you are a long-term DCA investor. Target the top of the 2-year Channel Up at $330.00.
-------------------------------------------------------------------------------
** Please LIKE 👍, FOLLOW ✅, SHARE 🙌 and COMMENT ✍ if you enjoy this idea! Also share your ideas and charts in the comments section below! This is best way to keep it relevant, support us, keep the content here free and allow the idea to reach as many people as possible. **
-------------------------------------------------------------------------------
💸💸💸💸💸💸
👇 👇 👇 👇 👇 👇
VISA flashing a short-term sell signal.Visa Inc. (V) has been one of our most accurate recent stock predictions (August 29, see chart below), as it is about to complete the buy signal we gave on the Channel's bottom to a +27.36% rise and hit our $320.00 Target:
Needless to say, if you took that call, evaluate your options as the profit is already enormous. Moving forward, specifically zooming in on the 1D time-frame, we can see that Visa is flashing its first sell signal in a while.
The price isn't only almost at the top of the 2-year Channel Up but more importantly, the 1D MACD has completed a Cup sequence on a Bearish Cross, similar to all early corrections at the start of this Channel.
As you can see all MACD Bearish Crosses were followed by pull-backs of similar size with the minimum being -7.30%.
As a result, we can expect the stock to hit and even break below the 1D MA50 (blue trend-line) at $295.00 (-7.30% decline), which would be also near the 0.382 Fibonacci retracement level (similar to the December 22 2022 Low).
-------------------------------------------------------------------------------
** Please LIKE 👍, FOLLOW ✅, SHARE 🙌 and COMMENT ✍ if you enjoy this idea! Also share your ideas and charts in the comments section below! This is best way to keep it relevant, support us, keep the content here free and allow the idea to reach as many people as possible. **
-------------------------------------------------------------------------------
💸💸💸💸💸💸
👇 👇 👇 👇 👇 👇

Visa stock new demand level and investment opportunity Visa stock continues to rally as expected creating new demand imbalances on the daily timeframe. There is a new one sitting at $285 per share. Waiting for the pullback before buying again.

Visa Soars! All Profit Targets Hit in 15-Minute Long TradeTechnical Analysis: Visa – 15-Minute Timeframe (Long Trade)
Visa presented a strong bullish opportunity with an entry at 275.92. The trade has been highly successful, with all profit targets hit, showcasing the strength of the uptrend.
Key Levels
Entry: 275.92 – The long position was initiated after confirming a strong bullish signal.
Stop-Loss (SL): 274.59 – Positioned below support to manage risk and protect against potential downside.
Take Profit 1 (TP1): 277.57 – Successfully hit, confirming the initial bullish momentum.
Take Profit 2 (TP2): 280.24 – Further upside pressure pushed the price to this level.
Take Profit 3 (TP3): 282.91 – The bullish trend carried the price to this target.
Take Profit 4 (TP4): 284.56 – The final target, marking a complete and highly profitable trade.
Trend Analysis
The price remained well above the Risological Dotted trendline, confirming a strong uptrend throughout the trade. The steady buying pressure helped achieve all targets, indicating robust bullish momentum.
The long trade on Visa has concluded successfully, hitting all targets, with the final target at 284.56. This trade exemplifies the power of identifying strong trends and riding the momentum to maximize profits.

VISA Best buy opportunity since 2022.Visa Inc (V) is trading again above its 1W MA50 (blue trend-line) for the 3rd straight week following the rebound on early August's Low. That low apart from a Double Bottom is also a technical Higher Low formed at the bottom of the 2-year Channel Up.
The previous Double Bottom in October 2023 was exactly on the 1W MA50 and even though not at the bottom of the Channel Up, it did manage to kickstart a +27.36% rally. The Bullish Leg before it rose by +34.04% before also correcting back to the 1W MA50.
With the 1W MACD about to form the first Bullish Cross in 9 months, we have at hand the best buy opportunity on Visa, whose last 1W MACD this low was back on the September 2022 bottom! Our Target for the end of the year is $320.00 (+27.36%).
-------------------------------------------------------------------------------
** Please LIKE 👍, FOLLOW ✅, SHARE 🙌 and COMMENT ✍ if you enjoy this idea! Also share your ideas and charts in the comments section below! This is best way to keep it relevant, support us, keep the content here free and allow the idea to reach as many people as possible. **
-------------------------------------------------------------------------------
💸💸💸💸💸💸
👇 👇 👇 👇 👇 👇

VISA Short-term correction. Know where to buy.Visa (V) has been trading within a long-term Channel up pattern since the October 13 2022 Low. The 1D MA50 (blue trend-line) has been in support of the latest Bullish Leg since November 02 2023, so there is a long-time that the stock hasn't given a healthy pull-back for medium-term buying.
This has come in the past in the form of an approximately -8.00% correction, particularly when the 1D RSI posts a Bearish Divergence, i.e. trades within a Channel Down while the stock is within a Channel Up.
As we are currently on such a Bearish Divergence since January 25, we expect a technical pull-back soon, thus turning bearish and targeting the 1D MA100 (green trend-line) at $270, where we will start buying again for the medium-term.
-------------------------------------------------------------------------------
** Please LIKE 👍, FOLLOW ✅, SHARE 🙌 and COMMENT ✍ if you enjoy this idea! Also share your ideas and charts in the comments section below! This is best way to keep it relevant, support us, keep the content here free and allow the idea to reach as many people as possible. **
-------------------------------------------------------------------------------
💸💸💸💸💸💸
👇 👇 👇 👇 👇 👇

VISA Pull-back to the 1D MA50 possible.Visa Inc. (V) has gone a long way since our last analysis (see chart below) which hit both our bullish and bearish targets:
The stock has made a +15.40% Higher High from the bottom of the long-term Channel Up, which is consistent with 2 out of the 3 previous Bullish Legs within this pattern. After those Higher Highs were formed, pull-backs to Higher Lows of -8.41% to -10.82% followed, all of which hit or approached very closely the 1D MA200 (orange trend-line).
As a result, our sell's target will be at least on the 1D MA50 (blue trend-line) at $250.00.
-------------------------------------------------------------------------------
** Please LIKE 👍, FOLLOW ✅, SHARE 🙌 and COMMENT ✍ if you enjoy this idea! Also share your ideas and charts in the comments section below! This is best way to keep it relevant, support us, keep the content here free and allow the idea to reach as many people as possible. **
-------------------------------------------------------------------------------
💸💸💸💸💸💸
👇 👇 👇 👇 👇 👇

Visa has formed a large level double topVisa has formed a large level double top
This figure shows the weekly candle chart of Visa's stock from the end of 2019 to the present. The graph overlays the bottom to top golden section at the beginning of 2020. As shown in the figure, the combination of last week's high point and 2021 high point of Visa's stock has formed a large level double top shape, both of which are suppressed by the 2.618 position of the gold split at the bottom of the figure! This week, the stock of Visa has fallen back to the bottom of the chart, which is 2.382 on the Golden Divide. In the future, this position will serve as the watershed for judging its strength!

VISA About to start a historic Bull Cycle similar to post 2009This is Visa Inc. (V) on the 1W time-frame. The primary pattern since the July 26 2021 All Time High (ATH) has been a Falling Wedge and the price continues to hold that formation after being rejected on the August 15 candle on the Lower Highs (top) trend-line. With the 1W MA50 (blue trend-line) crossing below the 1D MA100 (green trend-line), the first Bearish Cross since March 14 2011 has been formed!
In fact that Bearish Cross capped off a similar trading pattern to that Visa has been trading in since mid 2019. This idea compared the two eras: 2019 - 2022 and 2008 - 2011.
In 2011, the stock was trading within a Channel Down as the accumulation pattern instead of a Falling Wedge, with its Lows contained around the 0.5 Fibonacci retracement level. Following the Bearish Cross and the pull-back that came with it, the price made one last Lower High, pulled-back and then broke above the pattern aggressively. If the same formation continues to be repeated then we can have a break above the Falling Wedge by December/ January. See also how the RSI and MACD patterns are similar.
--------------------------------------------------------------------------------------------------------
** Please support this idea with your likes and comments, it is the best way to keep it relevant and support me. **
--------------------------------------------------------------------------------------------------------
