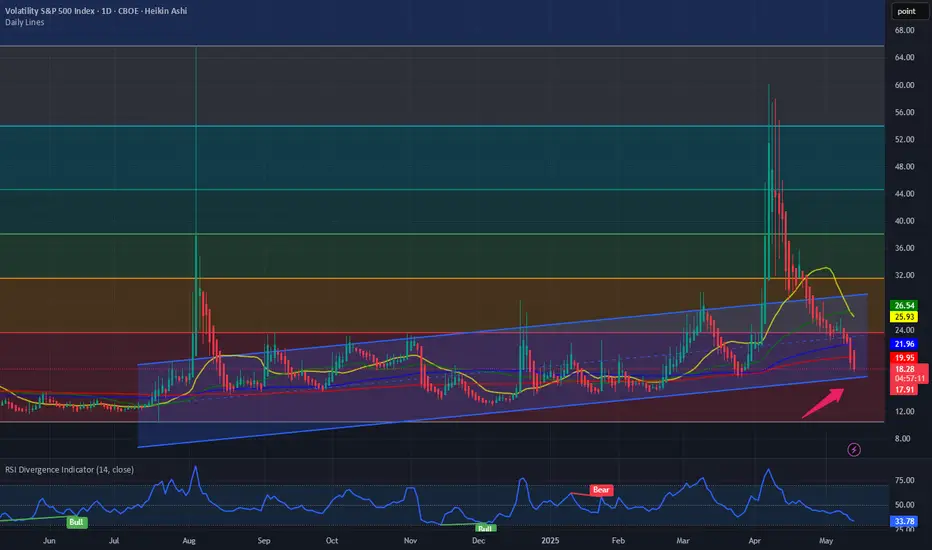
VIX SPY500 forecast until end of June 2025VIX S&P500 Index is in reversal. Downward movement has ended. Uptrend is starting now. All the way until end of June 2025 VIX will grow and steadily and surely.
Bottom is now at 18.18 and possible interim top is at 36.54
This view is supported by my forecast of S&P500 for June 2025.
For more updates on 1D chart click social media links in my profile.
VIX CBOE Volatility Index

VIX | Stock Market Correction IncomingVIX is the ticker symbol and the popular name for the Chicago Board Options Exchange's CBOE Volatility Index, a popular measure of the stock market's expectation of volatility based on S&P 500 index options. It is calculated and disseminated on a real-time basis by the CBOE, and is often referred to as the fear index or fear gauge.
The VIX traces its origin to the financial economics research of Menachem Brenner and Dan Galai. In a series of papers beginning in 1989, Brenner and Galai proposed the creation of a series of volatility indices, beginning with an index on stock market volatility, and moving to interest rate and foreign exchange rate volatility.

Average US Stock Rebounds as VIX Dies – But Who's Really WinningThe Value Line Geometric Index ( NYSE:VALUG ), representing the average US stock, has bounced hard off multi-year support, right as Trump makes global headlines for striking billion-dollar “deals” in the Middle East.
But let’s call this what it is:
Deregulation for aircraft, crypto, energy 🛩️💸⚡
Tariffs and restrictions on retail, green tech, and small business 🏪🌱📉
And all while sitting on personal meme coin bags worth billions.
Meanwhile, volatility ( TVC:VIX ) is back to sleep, and main street stocks are climbing — but who is actually winning here?

US10 YR Yield Weekly Chart Analysis: NFAUpdate: May 15, 2025
-As per my last update(April 5, 2025) about the gap between March 24th candle and March 31st candle that any candle body close above that gap will invert that gap from resistance to support and Upside target will be Jan 13, 2025 candle High
- We had a candle body close above that gap and now its acting like support.
-Now i am expecting the bullish trend to continue and long term upside target is Jan 13, 2025 candle High and Short term upside target is April 7, 2025 candle high

$VIX: Where does VIX go from here? Happy Tuesday. A new week, new market KPIs to look at. Since the ‘Liberation Day’ VIX spike to 50 it has been a bear market for VIX and has been going down since then. Since then, the S&P had more than 11 day of positive close for the day. This is which we would expect when VIX is making new lower highs and lower lows. But where does the VIX go from here?
It has been a remarkable trade to buy the indexes NASDAQ:QQQ and SP:SPX when the TVC:VIX is at or above 30. And then unwinding the trade when TVC:VIX touches 15. We have more than 10 days of positive closes in SP:SPX and the TVC:VIX is at 17. So we might have some more positive return in the near term. And then we rinse and repeat the same trade. Sell the indices when TVC:VIX touches 15 or lower band of this upward sloping channel.
Verdict: Stay long until TVC:VIX @ 15. Unwind trade and then wait for TVC:VIX @ 30.
The last 4 previous Stockmarket Fear spikes were great buys...for Bitcoin, allowing investors to enhance their long-term holdings.
Purchasing risk assets when the #VIX exceeds 50 and over 20% of stocks fall below their 200-day moving average has consistently yielded positive returns, with a success rate of one hundred percent when evaluated one week, one month, and three months later.
This particular scenario has only happened 11 times in the history of the S&P 500, and the reading from Monday, April 7th, marked one of those rare instances.
#BTFD

$IWM, small caps, not YET giving the "all clear"AMEX:IWM is the lone index still not in the clear 🚩 — backtesting its 200dma today and tagging the weekly mid-BB , just like in '22. Will it matter by week's end? If not, the bull is likely back across the board 🐂
This week's #CPI (Consumer Price Index) and #PPI (Producer Price Index) prints could significantly influence market direction across major indices — AMEX:SPY , NASDAQ:QQQ and AMEX:IWM — especially with rate cut expectations in flux. 🧵Here's how:
1. Hot CPI or PPI (above expectations):
AMEX:SPY : Likely to pull back as sticky inflation pressures broader S&P names, especially rate-sensitive sectors like real estate and utilities.
NASDAQ:QQQ : Could see sharper downside—tech stocks (many of which are high duration assets) are highly sensitive to interest rate expectations.
AMEX:IWM : Likely the hardest hit. Small caps suffer from tighter financial conditions and depend more on domestic borrowing costs.
🟥 Result: Bearish across the board, with small caps underperforming.
2. Cool CPI or PPI (below expectations):
AMEX:SPY : Broad lift, particularly in consumer discretionary and financials.
NASDAQ:QQQ : Strong rally—mega cap tech loves the prospect of lower yields.
AMEX:IWM : Outperforms if cooling inflation suggests easing ahead, since it's more leveraged to rate cycles and domestic growth.
🟩 Result: Bullish, with small caps possibly leading a relief rally.
3. In-line CPI/PPI :
Markets may stay choppy or consolidate, with AMEX:SPY and NASDAQ:QQQ more stable.
AMEX:IWM remains at risk of drifting lower unless there’s a strong dovish narrative from the Fed or other macro catalysts.
With small caps already lagging, this week’s inflation data could either validate its bearish divergence or spark a rotation rally if inflation
AMEX:SPY NASDAQ:QQQ TVC:VIX $ES_F $NQ_F $RTY_F TVC:TNX NASDAQ:TLT TVC:DXY #Tariffs #Stocks

$SPY Its time according to my chart.. Lower high is the trigger I posted two charts for reference to the current situation. With a historic rally right into resistance and a fractal analog that matches, I have no choice but to remain bearish. These are my studies. Sometimes Impatience leads to things like Impulsive Entries and Exits, Revenge Trading, and at times, even Blown Accounts. Times like those should be followed by a regroup and a reset.
The 9 Count Sell Signal Triggered with a Reset is on Technical Inidators for a move lower. I do believe we are going to consolidate for several days but nothing further than the second week of May. Today Bulls got extremely bullish and still were not able to hold the highs into the close. The test of the 200 day SMA was rejected and several days near these leveles whether above or below, would prove the downside move more possible. The monthly on SPX is my biggest indicator, personally. If it follows the pattern I'm following then after a test of the 10WMA, we will roll back over on the next 10 day candle. The market ran through a death cross without stopping, which if anyone were to study for several minutes, they would be able to see any first attempt at a death cross to the upsde is almost immediately met with a selloff back to the lows of the breakout move. Good luck everybody.

VIX looks close to jumping up.MACD on daily looking to reverse, RSI has been in oversold territory, this is just on a daily though so not necessarily a guaranteed reversal but it seems to be getting support.

VIX is a VIXjust having a little fun in a chat about how i chart the VIX. i say a VIX is a VIX. when we are spiking, we are spiking and we should become cautious if we don't know how to manage in that environment (intense bearish environment). this recent spike has proven that there are bullish moments that can be gleamed, but you have to be clear about your targets .
if someone has more to add about VIX royalty, please do share. otherwise, pick one to monitor if that is even your thing. no need to clutter your toolbox with VIX concepts... says me.
shout out to @BradMatheny. your work is amazing. thank you for sharing a bit here and there. i'm going to make time to learn more from you.
tootles

𝗧𝗲𝘀𝗹𝗮 𝗕𝗿𝗲𝗮𝗱𝗸𝗼𝘄𝗻: Priced for perfectionPriced for perfection in an imperfect market
NASDAQ:TSLA nearly hit its 200dma and key resistance area (~288–292) after a roughly 20% post-earnings squeeze, and as long as it stays below that level, it risks retesting the long-term uptrend line that has marked major lows twice since COVID.
𝘛𝘢𝘳𝘪𝘧𝘧 𝘢𝘯𝘥 𝘴𝘶𝘱𝘱𝘭𝘺-𝘤𝘩𝘢𝘪𝘯 𝘳𝘪𝘴𝘬: Tesla depends heavily on Chinese-made battery and electronic components now hit by reciprocal U.S. tariffs, while over 60% of global neodymium and dysprosium—vital for its EV motors—are mined and processed only in China, creating a critical bottleneck that could sharply elevate its input costs.
𝘔𝘢𝘳𝘨𝘪𝘯 𝘱𝘳𝘦𝘴𝘴𝘶𝘳𝘦 𝘷𝘴. 𝘭𝘰𝘧𝘵𝘺 𝘷𝘢𝘭𝘶𝘢𝘵𝘪𝘰𝘯: Q1 price cuts of up to 20% on core models drove Tesla’s auto gross margin to its lowest since 2020, calling into question the sustainability of its >70× forward P/E multiple, which assumes exceptionally high profits from future ventures like robotics and autonomous fleets.
$NQ_F NASDAQ:NDX NASDAQ:QQQ NASDAQ:AMZN NASDAQ:META NASDAQ:NVDA NASDAQ:SOX $ES_F AMEX:SPY SP:SPX TVC:DXY NASDAQ:TLT TVC:TNX TVC:VIX #Stocks #TrumpTariffs 🇺🇸 #ChinaTariffs 🇨🇳

$UVXY to $100+Unfortunately many of my charts were removed by a moderator for having private indicators on them (which I didn't realize was a thing), so I have to repost them.
If we look at the chart, we broke out of a bull flag and are now testing a very strong support level.
You can see we've bounced off of that level multiple times. I think we bounce off of this level again and continue higher from here.
I have no clue what the cause for this move will be, but it looks like we're set for a large move up to the $98-106 resistances with possibility for an extended move up to the top resistances.
Let's see how it plays out over the coming weeks. Key dates and levels on the chart.

VIX – “Liquidity Pool Bounce & Reversal Setup”🟢 VIX – “Liquidity Pool Bounce & Reversal Setup”
📅 Date: April 22, 2025
⏰ Multi-Timeframe Analysis (12h, 1D, 1h, 30m, 5m)
🔎 Global Context:
The Volatility Index (VIX) is reacting to a clear institutional liquidity zone (blue area) across multiple timeframes (12h, 1D, 1h), aligning with a mean reversion move following the explosive rally earlier this month. We’re seeing multiple signs of a potential bullish reversal:
Previous lows + demand zone confluence
Multiple CHoCH (Change of Character) events on lower timeframes
Implied divergence from equities (not shown here, but inferred)
Strong rejection from the institutional block (26.345–26.600)
🔍 Technical Analysis & Justification:
📌 Wyckoff & Smart Money Concepts (SMC):
On 30m and 1h charts, we observe several CHoCH and BOS events suggesting a transition from redistribution into accumulation.
The latest bearish move failed to break the weak low zone (26.345), indicating a liquidity grab trap.
📌 Fibonacci & Moving Averages:
Price touched the 78.6%–88.6% retracement from the previous bullish leg.
EMAs 8/21 (Orange/Blue) are about to cross bullish on 5m and 30m – a typical trigger for a new impulsive move.
EMA200 (White) still hovers above – likely target of the first bullish push.
📌 Volume Profile (implicit):
Most of the recent consolidation occurred in the 27.00–27.40 imbalance zone, which now acts as a magnet for price during retracement.
📌 Liquidity & Order Flow Concepts:
The 26.345–26.600 range served as a Weak Low and was swept clean – classic liquidity trap behavior.
📈 Trade Parameters:
🟢 Entry (Buy): 26.795
🔒 Stop-Loss (SL): 26.345 (below last liquidity sweep)
🎯 Take Profit 1 (TP1): 27.390 (inefficiency zone + EMA200)
🎯 Take Profit 2 (TP2): 28.150 (1h/30m order block)
🧮 Risk-Reward Ratio (RR):
TP1: ~1.6
TP2: ~3.0
📊 Confidence Level: ⭐⭐⭐⭐ (High-probability setup)
🧠 Strategic Summary:
This is a classic reversal play based on liquidity absorption and structural shift (CHoCH), supported by multi-timeframe alignment. A bullish engulfing or strong reaction inside the blue zone confirms the entry bias. If price breaks above 27.00 with volume, momentum may carry it towards 28.00+ swiftly.
⚠️ Risk Disclaimer: Trading involves risk. Only trade with capital you can afford to lose. Always manage your exposure wisely.
💬 What do you think of this setup? Do you see confluence with your strategy? Let’s discuss below! 👇

Historical co-relation of VIX and SPXWhen VIX hit all time high and retraced below 35, it is a good indicator of the start of a bull run

VIX drop before the next ZOOM upWhat we experienced last week was absolutely insane in terms of volatility. The beauty of all of this is that it's still a trend and many of these spikes are quite predictable. We all knew about the days the tariffs that were going to hit, right? Why didn't you get into UVIX when I called this out days in advance. It's fine, you will have another shot! Actually, we're in line for many many more spikes which is the great thing. Volatility is your friend!
I'll be posting weekly and will be giving away a Free trading alert that has been backtested for the last 3 years over the next week. 2025 will be awesome!
Expect VIX to drop a bit more, great to get in on the SVIX and then let's analyze the next trend and take on UVIX on the upside! This is so easy....

VIX is readying for a golden shot#vix the volatility index is consolidating in falling megaphone channel for another impulsive wave. TVC:VIX had the 1st wave when trade wars begin (But i warned you 3 months ago with VIX chart) then 2nd wave of correction in progress and when 2nd wave consolidation is done, 3rd wave far more cruel than 1st wave will set sail. Beware with your high risk positions, just a warning. Not financial advice. DYOR.

Nifty50 Wkly Anlysis – Strong Reversal, But Volatility AheadThe Indian stock market closed the week on an interesting note. The Nifty 50 index ended at 22,828, just 70 points lower than last week's close, after forming a significant bullish reversal from a low of 21,743 to a high of 22,923.
As we mentioned in last week's market outlook, a base formation was underway—and this week's price action confirmed it. With the next week being truncated due to market holidays on Monday and Friday, traders should expect increased volatility and sideways movement.
Key Technical Levels:
Support: 22,200 – This is 50% of this week's candle; a break may bring bearish momentum.
Resistance: 23,400 – A close above this could ignite a rally toward 23,900, 24,100, and possibly 24,414.
On the global front, the S&P 500 respected the 4,800 support level, rebounding sharply to close at 5,363. However, underlying market weakness remains, so it's a sell-on-rise situation in U.S. equities.
Pro Tip:
Indian investors should keep an eye out for quality, fundamentally strong stocks. Any correction in the market may offer excellent long-term buying opportunities.

VIX Hits 27-Year Extreme. Is the Market About to CRASH or SOAR?The Volatility Index (VIX displayed by the blue trend-line) has entered a level that has visited only another 5 times in the last 27 years (since August 1998)! That is what we've called the 'VIX Max Panic Resistance Zone'. As the name suggests that indicates ultimate panic for the stock markets, which was fueled by massive sell-offs, leading to extreme volatility and uncertainty.
So the obvious question arises: 'Is this Good or Bad for the market??'
The answer is pretty clear if you look at the chart objectively and with a clear perspective. In 4 out of those 5 times, the S&P500 (SPX) bottomed exactly on the month of the VIX Max Panic signal. It was only during the 2008 U.S. Housing Crisis that VIX hit the Max Panic Zone in October 2008 but bottomed 5 months late in March 2009.
As a result, this is historically a very strong opportunity for a multi-year buy position. If anything, today's VIX situation looks more similar to September 2011 or even the bottom of the previous U.S. - China Trade war in March 2020.
-------------------------------------------------------------------------------
** Please LIKE 👍, FOLLOW ✅, SHARE 🙌 and COMMENT ✍ if you enjoy this idea! Also share your ideas and charts in the comments section below! This is best way to keep it relevant, support us, keep the content here free and allow the idea to reach as many people as possible. **
-------------------------------------------------------------------------------
💸💸💸💸💸💸
👇 👇 👇 👇 👇 👇

"When the VIX is low, look out below!""When the VIX is low, look out below!"
+
FEDs motto "Higher for longer"
=
Fed rate hikes to go: 2-3 left
it is pivot time, change of market dynamic from "bad news is good news" to "bad news is bad news".
state of economy is not good and it will start sinking in to investors and public

SPX repeating 2022 patternI had said in a earlier post( see link to Related publication) that Vix is indicating we will be in 2022 style market and so far indeed it is, except for the breakdown from the wedge last week.
Expect the price to fluctuate within the wedge to consolidate before a breakout
The comparison shows close similarity of the wedge and path (except last week)

Path to 100 VIXI wrote this note on TVC:VIX a few days ago:
www.tradingview.com
And am now expanding it a bit more.
As someone who was working middle office during the original 2016 Trump Election, Brexit, during the Taper Tantrum and a few other major events - I want to lay out my principles on trading the VIX because spikes like this bring a lot of "first time" VIX traders to something that trades like NOTHING ELSE in the market.
This is not a stock in a short squeeze, this is not a generic index.
This is like nothing you've ever traded before. In fact, I'd encourage you to take advantage of TradingView's chart options and instead look at the chart of -1*$TVC:VIX.
That alone should give you pause.
----------------------------------
So - let's start with the principles of the finance business as laid out in the masterclass which was the movie "Margin Call" .
"John Tuld: There are three ways to make a living in this business: be first, be smarter, or cheat."
1. Be First.
You are not first if you are buying above the historic average of VIX 20-21.
If you were buying CBOE:UVXY since Jan 2025, you'd be up 175% right now and likely looking to re-balance into your desired long term asset positions.
2. Be Smarter.
* Are you taking into consideration the VIXEX Cycle?
* Do you know the effect of VIXEX before or after monthly OpEx?
* Do you know the current implied volatility curve of options ON the VIX?
* Do you know that of the last 4 times the VIX has hit 50, it went on to 80+ 50% of the time after that?
* Yes, I've seen the charts going around about forward S&P X year returns but did you know that after the VIX spike to 80 in October 2008, the market (in a decreasing volatility environment) went on a further 35% decline in the next 4-5 months?
* Where is the MOVE? What are the bond indexes & bond volatility measures doing? And if you don't yet understand that equities ALWAYS reacts to what is going on in the rates / yield world... you'll find out eventually. I hope.
3. Cheat
When things start going wrong, everyone wants an easy solution.
That's why its called a relief rally. It feels like relief - the bottom is in, the worst part is over.
But that is what the really big players have the biggest opportunity to play with the day to day environment.
They know our heuristics. They encourage the formation of cargo cult style investing whether that's HODL in the cryptocurrencies or Bogleheads in the vanguard ETFs.
It's all the same and encourages you to forgot first principles thinking about things like:
1. Is this actually a good price or is it just relatively cheap to recent history?
2. Who's going to have to dilute to survive the next period of tighter lending, import costs from tariffs, or whatever the problem of the day is.
3. VIX correlation - volatility is just a description of the markets. Its not a description of the direction. There is periods where volatility is positively correlated to the price movement (like during earnings beats). Know about this and know when it changes.
4. Etc.
Some have pointed out that is more appropriately a measure of liquidity in the SPX.
When VIX is low, that means there is lots of "friction" to price movement. It means that there is tons of orders on the L2 book keeping the current price from moving in any direction too quickly.
When VIX is high, that means there is very low "friction" to price movement. It means there are very few orders on the L2 book and market makers can "cheat" by appearing to create a low volume rally and then rug pull that price movement very quickly (not via spoofing, more just dynamic management of gamma & delta hedging requirements).
Additionally - volume itself becomes deceptive. Volume is just indicating that a trade happened.
Its not telling you to what degree the spread between the bid and ask has blown out to 1x, 2x, or 5x normal and that trades are executing only at the highest slippage prices in that spread.
All of these things are considerations that the market makers can use to make a "buy the dip" situation that works heavily to their advantage.
TLDR: "If you can't spot the sucker in your first half hour at the table, then you are the sucker"
----------------------------------
So - why / when would VIX go to 100?
In 2020, its easy to forget that a culmination of things stopped the crash at -35%.
* March 17, 2020 VIXEX wiped out a significant amount of long volatility positions.
* March 20, 2020 Opex wiped out a significant proportion of the short term put positions
* March 20, 2020 Fed Reserve announced to provide "enhanced" (i.e. unlimited) liquidity to the
markets starting Monday March 23, 2020.
* April 6th, 2020 Peak of Implied Volatility (point where options "most expensive") - which meant that buyers / sellers started providing more & more liquidity following this point.
In 2025, we have yet to see:
* Any motion towards intervention from the Fed for liquidity.
* Any motion from the significant fundamental investors (we're not close to an attractive P/S or P/E on most stocks for Buffett & Co to start buying)
* Any significant motion from companies on indicating strategies about capital raises, layoffs, or other company level liquidity reactions.
* Any "reset" of options in either volatility or hedging. Numbers below as of April 9, 2025:
- SPY 2.8M Put OI for April 17
- VIX 3.5M Call OI for April 16
Just an example but maybe IF we see those clear and NOT get re-bought for May Opex... we might be ready to call a top here at 50 VIX.
Otherwise.... we're just at another stop on the path to 100.

VIX - Extreme fear in the market: a unique opportunity?Extreme fear in the market: a unique opportunity?
An analysis of the most significant
VIX spikes (1987-2025) and subsequent stock market performance.
The VIX (Volatility Index) is an indicator that reflects the level of fear or uncertainty in the market based on expectations of volatility in the S&P 500 Index.
The VIX's 118% surge from April 4 to April 7, 2025 was the fifth largest 3-day surge in market history.
This surge 🚀 reflects the high level of uncertainty that has developed in the markets.
It is very difficult to make informed investment decisions during such periods.
But we can rely on historical patterns.
After the 20 largest VIX spikes, the S&P 500 Index has consistently delivered exceptional returns:
- After 1 year: 16.5% (vs. 12% in normal periods)
- After 3 years: 45.9% (vs. 39.5% in normal periods)
- After 5 years: 83.0% (vs. 74.4% in normal periods)
The difference in returns over the 4 years is 10.2% above average.
Over the past 40 years, there has only been one negative return (the 2007 spike before the financial crisis), while most extreme fear events have become outstanding buying opportunities. For example, the August 2011 spike was followed by an impressive 117% return over the next five years.
When market panic reaches extreme levels, institutional capital typically steps in against retail sales, setting the stage for stronger long-term growth. History shows that these moments of maximum fear often represent optimal entry points for patient investors.
It is essential to realize that historical patterns do not always hold true in the future. Each crisis has unique characteristics and causes that can lead to different outcomes.
These statistics provide good mathematical expectations, not guarantees.
This has always been the case in the market, and proper handling of math expectations and risk management are the foundations of profitable strategies.
Best regards EXCAVO
_____________________
Disclosure: I am part of Trade Nation's Influencer program and receive a monthly fee for using their TradingView charts in my analysis.

VIX Clips 60 as Market Volatility and Tariff UncertaintyThe VIX Clips 60 as Market Volatility and Uncertainty Surge on Tariff Announcement
The CBOE Volatility Index (VIX), often dubbed the “fear gauge,” surged past the 60 threshold this week—the highest level since August 5, 2023—as markets reacted violently to an unexpected announcement by the U.S. President regarding global tariffs. The sharp rise in the VIX, which measures market expectations of 30-day volatility, underscores the profound uncertainty now gripping investors, with the Dow Jones Industrial Average plummeting over 1,000 points and the S&P 500 entering correction territory. The trigger? A sweeping tariff policy unveiled by the administration on Liberation Day, a symbolic holiday marking a shift in economic strategy, which has sent shockwaves through global markets.
The VIX at 60: A Sign of Extreme Fear
The VIX typically hovers around 15-20 under normal conditions, reflecting moderate uncertainty. However, readings above 30 indicate heightened anxiety, and levels above 50 are rare, historically occurring during major crises like the 2008 financial collapse or the 2020 pandemic sell-off. This week’s spike to 60 marks a dramatic escalation, signaling a market gripped by fear. Analysts attribute this to the suddenness and scale of the President’s tariff announcement, which caught investors off guard after a period of relative calm.
The Liberation Day Tariff Announcement
On Liberation Day—a holiday commemorating historical freedoms—the administration announced a 25% tariff on a broad range of imports from key trading partners, including China, the EU, and others, effective immediately. The move, framed as a “national economic security initiative,” aims to curb perceived trade imbalances and protect domestic industries. However, its immediate impact has been severe:
Scope and Speed: The tariffs apply to $500 billion in goods, targeting sectors like semiconductors, automotive parts, and consumer electronics. The abrupt implementation, with no prior warning or negotiation, has left businesses scrambling to adjust supply chains.
Political Context: The announcement coincided with domestic political tensions, including debates over inflation and job creation. The White House argued the tariffs would “level the playing field” for American workers, but critics warned of retaliation and inflationary pressures.
Market Chaos: Sectors Under Siege
The tariff shockwave rippled across asset classes:
Equities: The S&P 500 fell 2+% on Monday, its worst single-day drop since March 2020. The Nasdaq, heavily weighted in tech stocks reliant on global supply chains, plunged over 5%.
Sectors: Semiconductor firms like Intel and AMD tanked, while automakers such as Ford and Tesla declined sharply.
Expert Analysis: A Volatility Tipping Point
Historical Parallels and Economic Risks
The current volatility mirrors past crises:
2008 Financial Crisis: The VIX hit 80 as Lehman Brothers collapsed, but the current crisis stems from policy, not financial contagion.
2020 Pandemic Sell-Off: The VIX spiked to 82 as lockdowns paralyzed economies, but today’s uncertainty is self-inflicted.
However, the tariff-driven uncertainty poses unique risks:
Inflation: Higher import costs could push inflation back above 4%, complicating the Fed’s rate-cut path.
Global Growth: The World Bank warns that trade wars could shave 2% off global GDP by 2025. Emerging markets, reliant on exports, face currency crises.
Looking Ahead: Can Calm Return?
Markets may stabilize if the administration signals flexibility. Potential pathways include:
Negotiations: A G20 summit in September offers a venue for de-escalation, though diplomatic progress is uncertain.
Policy Reversal: If tariffs are delayed or narrowed, the VIX could retreat. However, the President’s rhetoric suggests a hardline stance.
Corporate Adaptation: Companies might pivot to domestic suppliers, but such shifts take years, prolonging volatility.
Conclusion: A New Era of Uncertainty
The VIX at 60 marks a pivotal moment. Markets are now pricing in not just the immediate tariff impact but a broader shift toward protectionism and policy-driven instability. For investors, the path forward is fraught with uncertainty. While short-term volatility may ebb with reassurances, the long-term consequences—trade wars, inflation, and geopolitical friction—could redefine global economics for years.
With Liberation Day’s tariffs reshaping the landscape, one thing is clear: the era of low volatility is over. The question now is whether policymakers can navigate this new turbulence—or if markets will remain hostages to fear.
