VIX: From “Calm Tension” to a ReboundWhy does a small uptick matter today… if we’ve already seen 60+ readings four times in the past 17 years?
The first week of August 2025 brought back a familiar market force: volatility.
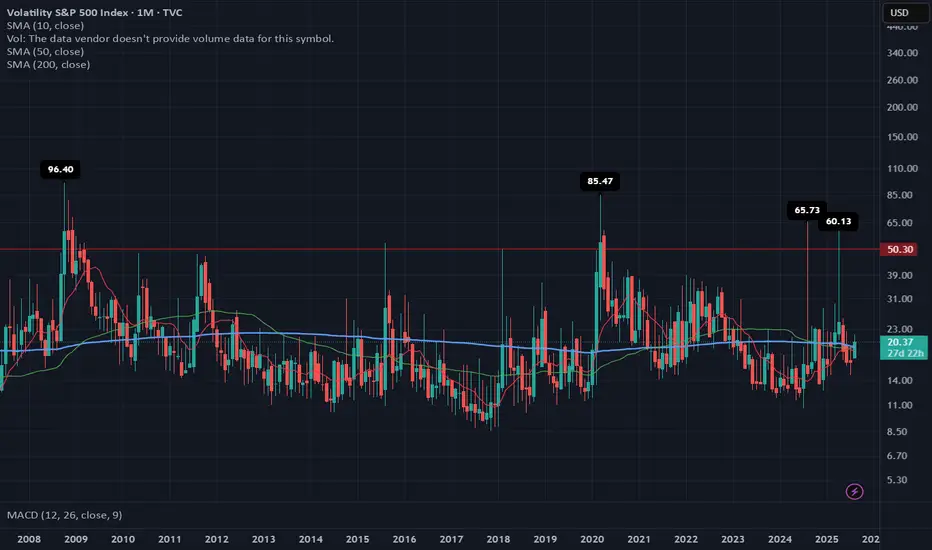
The VIX, which tracks expected fluctuations in the S&P 500, jumped 21% in just a few days, rising from 17.4 to 20.37, with an intraday high of 21.9 on August 1.
At first glance, the move may seem minor. But it broke through key long-term moving averages (SMA 50 and 200) and exited its recent comfort zone (14–19 pts). That alone is enough to make portfolio managers and traders pay attention again.
🔙 Historical context: when the VIX truly spiked
📅 Date 🔺 VIX intraday 🧨 Trigger
Oct 1, 2008 96.40 Subprime mortgage crisis, Lehman collapse, AIG bailout
Mar 2, 2020 85.47 COVID-19 global spread, border shutdowns
Aug 5, 2024 65.73 Surprise Fed rate hike + overheated jobs data
Apr 7, 2025 60.13 Panic over new U.S. tariffs on global partners
Compared to those moments, today's VIX levels look “mild.” But the technical and macroeconomic signals suggest that volatility may be establishing a new baseline.
1. 📊 Breakdown: First week of August 2025
Weekly increase: from 17.4 → 20.37 (+21%).
Technical breakout: monthly close above both the 50-day and 200-day simple moving averages (SMA 19.25 and 19.45).
MACD on the monthly chart has flipped positive for the first time since March 2023.
Key drivers:
🏛️ The Fed left interest rates unchanged on July 30, but two dissenting votes favored a rate cut.
👷♂️ Softening jobs data: July NFP came in at only +73,000 jobs (vs. +110,000 expected).
🧾 New U.S. tariffs, announced on August 1, reignited inflation concerns.
2. ⚖️ Comparing August 2025 to the August 2024 storm
Factor August 2024 August 2025 (Week 1)
🔺 VIX peak 65.73 21.9
🏛️ Fed stance Surprise 25 bp rate hike Rates unchanged, internal division
👷 Labor market Hot, wage pressures Cooling down
📉 S&P 500 reaction −12% in 3 weeks Approx. −3% decline underway
💧 Market liquidity Very low (pre-market) Normal
Conclusion:
2024 was a systemic shock.
2025 is more of a volatility warning sign—but one that matters for risk management.
3. 📍 Technical signals to monitor
The monthly MACD just turned positive, which historically precedes sustained volatility spikes.
Key short-term range: 18–22 pts. A sustained close above 22 could trigger heavy selling in high-beta stocks.
Options expiration (OPEX, Aug 16) may amplify moves via gamma flows.
4. 🔮 What could move the VIX next?
📅 Date 📌 Event ⚠️ Volatility Risk
Aug 14 Core CPI (July) Reading above 0.3% m/m could reignite hawkish Fed bets
Aug 22–23 Jackson Hole Symposium Powell’s speech could reset the policy outlook
End of Aug Q2 GDP revision Confirm whether slowdown = soft landing or stagflation
📌 Note: The VIX cannot be traded directly. Exposure is typically obtained through futures, options, or ETNs—each with specific risks like contango, low liquidity, and roll decay.
📌 Final thoughts
The VIX doesn’t need to hit 60 to send a message.
The fact that it’s breaking above long-term averages, reacting sharply to macro data, and threatening key levels is enough to suggest that the era of ultra-low volatility may be ending.
History shows us that major VIX spikes come fast and unannounced.
If you remember 2008, 2020, or even April 2025—you know that preparation beats prediction.
Volatilityindex
What will go down VIX or SPX?When SPX pushes fresh highs while the VIX floor makes higher lows, fragility rises.
This post is for informational/educational purposes only and is not investment advice or a solicitation to buy/sell any security. Past performance is not indicative of future results. I may hold positions related to the instruments mentioned.
$VIX Volatility Extremes, Narratives, Booms & Busts!TVC:VIX volatility index extremes have always been an important factor when assessing the cyclical nature of financial markets.
I demonstrate in this chart what values and narratives to look out for at these extremes. This can help ignore the noise when buying during low social mood / fearful events when everyone else is panic selling, and, selling during exuberance and booms when everyone else is FOMO buying.
This is the cyclical nature and intertwined relationship between media, events and financial markets that traders and Investors want to take advantage of.
Good times create positive social mood, exasperating over leveraging and booms with extreme positive news / silly price targets 'New Golden Age / Paradigm shift' style reporting.
This unwinds aggressively creating negative social mood which the media exasperate with 'fear and doom' reporting.
VIX is a useful tool to hedge against market uncertainty.
Safe trading

VIX Breakout: Forex Traders, Buckle Up for Volatility!🚨 VIX Surge: What Currency Traders Need to Know Right Now 🌪️💱
📊 Chart Context & Technicals:
The recent breakout in the VIX signals a major shift in global risk sentiment! 📈 The index has leapt off its base, showing markets are bracing for uncertainty. For forex traders, this is a flashing signal: volatility in equities often spills over into FX, amplifying moves in major pairs and risk-sensitive crosses. ⚡️
🌍 Geopolitical & Macro Backdrop:
This VIX spike is fueled by President Trump’s aggressive new tariffs on BRICS-aligned nations. 🏛️🔥 These moves have reignited global trade war fears, rattled equity markets, and triggered a broad risk-off wave. Historically, VIX surges = sharp swings in USD, JPY, CHF, and commodity-linked currencies. The USD, usually a safe haven, is now under pressure from both trade uncertainty and looming Fed rate cuts as the U.S. economy slows. 🏦📉
💱 FX Market Implications:
USD: The dollar is caught between safe-haven demand and worries over U.S. growth and deficits. Initial VIX spikes can boost USD, but ongoing trade tensions and dovish Fed signals are weighing it down. 💵⚖️
JPY & CHF: Classic safe-haven currencies! As VIX rises, expect flows into JPY and CHF, especially against high-beta currencies like AUD, NZD, and EM FX. 🗾🇨🇭
EUR, GBP, AUD, CAD: European currencies are outperforming in 2025, thanks to fiscal stimulus and capital inflows. Commodity currencies remain volatile, tracking risk appetite and global growth swings. 💶💷🇦🇺🇨🇦
🛠️ Trading & Strategy Takeaways:
Volatility = Opportunity: Elevated VIX means wider ranges and more frequent breakouts in FX. Prime time for breakout and momentum strategies, but demands tighter risk controls and dynamic position sizing! 🚦
Watch Correlations: Rising VIX typically strengthens JPY and CHF, while risk currencies (AUD, NZD, EM FX) weaken. USD direction is more nuanced—initially bid, but vulnerable to U.S. policy missteps and data misses. 🔄
Event Risk: With Trump’s tariff policy in flux and central banks diverging, expect FX volatility to stay high. Stay nimble around news releases and be ready for headline-driven whipsaws! 📰⚡️
🎯 Pro Takeaway:
The VIX is flashing a clear warning for currency traders: risk sentiment is deteriorating, and volatility is back in force. This environment rewards disciplined, adaptive trading—favoring safe-haven currencies, tactical hedges, and a readiness to pivot as policy headlines evolve. For those trading USD/JPY, EUR/USD, and cross-rates, expect bigger intraday swings and more false breakouts. Use the VIX as your real-time risk barometer and adjust your strategies accordingly! 🧭
VIX break-outs using GC, DC.VIX break-outs using a simplistic, effective approach, probabilities. Market themes or regimes based on markov chains?
keeping it simple.
Can Geopolitics Redefine Market Risk?The Cboe Volatility Index (VIX), which analysts widely dub the "fear gauge," currently commands significant attention in global financial markets. Its recent surge reflects profound uncertainty, particularly from escalating geopolitical tensions in the Middle East. While the VIX quantifies market expectations for future volatility, its current elevation signals more than mere sentiment. It represents a sophisticated repricing of systemic risk, capturing the implied probability of significant market dislocations. Investors find it an indispensable tool for navigating turbulent periods.
The dramatic escalation of the Iran-Israel proxy conflict into a confrontation, involving the United States, directly fuels this heightened volatility. Israeli airstrikes on Iranian military and nuclear facilities on June 13, 2025, prompted swift Iranian retaliation. Subsequently, on June 22, the U.S. launched "Operation Midnight Hammer," conducting precision strikes on key Iranian nuclear sites. Iran's Foreign Minister immediately declared diplomacy over, holding the U.S. responsible for "dangerous consequences" and vowing further "punishment operations," including a potential closure of the Strait of Hormuz.
This direct U.S. military intervention, particularly targeting nuclear facilities with specialized munitions, fundamentally alters the conflict's risk profile. It moves beyond proxy warfare into a confrontation with potentially existential implications for Iran. The explicit threat to close the Strait of Hormuz, a critical global chokepoint for oil supplies, creates immense uncertainty for energy markets and the broader global economy. While historical VIX spikes from geopolitical events often prove transient, the current situation's unique characteristics introduce a higher degree of systemic risk and unpredictability. The Cboe VVIX Index, measuring the VIX's expected volatility, has also risen to the higher end of its range, signaling deep market uncertainty about the future trajectory of risk itself.
The current environment necessitates a shift from static portfolio management to a dynamic, adaptive approach. Investors must re-evaluate portfolio construction, considering long exposure to volatility through VIX instruments as a hedging mechanism, and increasing allocations to traditional safe havens like U.S. Treasuries and gold. The elevated VVIX implies that even the predictability of market volatility is compromised, demanding a multi-layered risk management strategy. This specific confluence of events might signify a departure from historical patterns of short-lived geopolitical market impacts, suggesting geopolitical risk could become a more ingrained and persistent factor in asset pricing. Vigilance and agile strategies are paramount for navigating this unpredictable landscape.

BVOL: Volatility Compression Before the Final ExpansionThis chart might not get as much attention as BTC dominance or TOTAL, but Bitcoin volatility (BVOL) is one of the cleanest leading indicators when it comes to identifying market tops and bottoms.
Just look at the history — every major macro top or bottom in BTC price has correlated with a peak or trough in this chart. Whether it was the ATH in March 2024, the October 2024 breakout, or the deep pullbacks into key lows, BVOL has nailed the timing with precision.
Right now, we’re seeing volatility compressing hard — currently sitting around 13.17 — and heading into my targeted demand zone which has historically marked major inflection points.
🧠 What does this mean?
Volatility this low = market indecision + positioning. It’s when liquidity gets sucked dry before a major expansion move.
My expectation is:
- BVOL will soon hit demand and reverse
- BTC will complete its current correction
- Once volatility expands again, it likely aligns with a reversal and move into new ATHs — the final bullish phase of this cycle
Just like in past cycles, low volatility precedes explosive directional moves. This current compression is setting the stage — once the lid comes off, the move is usually fast and decisive.
⚠️ Watch this closely. BTC correcting into demand + BVOL hitting this low = confluence for the next trending leg.
Big picture context:
We’re deep into the 4-year cycle structure, with a macro top expected into Q3/Q4 2025. This setup supports the idea that after this consolidation and volatility reset, BTC could make one final leg up before distribution begins.
Let the volatility tell the story — it usually whispers before it roars.

Trading the VIX – Part 2Trading the VIX – Part 2: VIX ETPs and Strategic Applications
In Part 1 of this series, we explored the structure of VIX Futures, focusing on the roll-down effect in a contango VIX futures curve—common in calm market conditions.
In Part 2, we turn our attention to VIX-related Exchange-Traded Products (ETPs)—specifically, the popular and liquid:
• VXX – unleveraged long VIX ETP
• UVXY – leveraged long VIX ETP
• SVXY – inverse VIX ETP
Each of these products is based on a specific VIX futures strategy, the “S&P500 VIX Short Term Futures Index” , which is maintained by S&P, Dow Jones (the “SPDJ-Index”). The Fact Sheet and Methodology can be obtained from the S&P Global website.
What is the SPDJ Index that these ETPs track?
The SPDJ-Index is a strategy index that maintains a rolling long position in the first- and second-month VIX futures to maintain a constant 30-day weighted average maturity.
Key Features of the SPDJ Index:
• Starts with 100% exposure to VX1 (the front-month future) when it’s 30 days from expiration.
• Gradually it rolls from VX1 to VX2 (next-month future) each day to maintain a 30-day average expiration.
• At all times, the index is long either one or both VX1 and VX2, with exposure shifting daily from VX1 to VX2.
• This roll mechanism causes value erosion in contango (normal markets) and gains in backwardation (during volatility spikes).
• Since contango is the dominant market state, the index loses value over time—with occasional short-lived gains during sharp volatility increases.
Importantly, the SPDJ Index does not represent the VIX or any other volatility level, it simply reflects the value of this futures-based rolling strategy.
________________________________________
Breakdown of the ETPs: VXX, UVXY, and SVXY
VXX – Long SPDJ Index (1x)
• Tracks the SPDJ Index directly
• Suffers from the roll-down drag in contango environments.
• Useful only for short-term exposure during expected volatility spikes.
• Timing for long positions is critical
UVXY – Leveraged Long (Currently +1.5x)
• Replicates a strategy that maintains a constant leverage of 1.5 to the SPDJ Index.
• Formerly +2x leverage; reduced in April 2024.
• Highly sensitive to VIX moves; underperforms long term due to both roll-down drag and leverage decay (see below). Timing for long positions is even more important than for the VXX.
SVXY – Inverse (-0.5x)
• Replicates a strategy that maintains a constant exposure of -0.5 to the SPDJ Index.
• Benefits from falling VIX levels as well as from contango in the front part of the VIX futures curve.
• Formerly -1x before the Feb 2018 volatility spike triggered massive losses (XIV, a competing ETP, collapsed at that time).
• Performs well in calm conditions but is vulnerable to sharp volatility spikes.
Leveraged & Inverse ETPs – Important Notes affecting the UVXY and SVXY (without going into details):
• Daily resetting for the replicating strategies to maintain constant exposure factors (different from 1x) are pro-cyclical and can cause compounding errors, specifically in turbulent markets (e.g. Feb 2018).
• The real volatility of the VIX futures itself acts as a drag on returns, independent of the index’s direction.
• Risk management is essential—especially with inverse products like SVXY.
All three of these ETPs track a VIX futures strategy, they are not levered or unlevered versions of the original VIX index. Each of these ETPs benefits from liquid option markets, enhancing the toolkit for volatility trading.
Trading Strategies Using VIX ETPs
Here are several practical approaches to trading these products:
VXX and UVXY
• Best used for short-term trades aiming to capture volatility spikes.
• Options strategies such as zero-cost collars, vertical and calendar spreads can help mitigate the challenge of precise timing.
• Avoid long-term holds due to erosion from roll-down and leverage decay (see historical performance!).
SVXY – The Carry Trade Proxy
• Ideal for profiting from prolonged calm periods and the contango structure.
• Acts like a carry trade, offering a positive drift—but must be paired with robust stop-loss rules or exit strategy to guard against sharp spikes in volatility.
Switching Strategies
• Tactically rotate in/out of SVXY based on short-term volatility indicators.
• One common signal: VIX9D crossing above or below VIX, i.e. long SVXY if VIX9D crosses under VIX, staying long while VIX9D < VIX, closing long SVXY position when VIX9D crosses over VIX. Some traders also use crossovers with VIX3M or the individual expirations of the VIX futures curve to manage entries.
• Switching between SVXY and VXX based on crossover triggers through the VIX futures curve is often advertised, but very hard to get working in practice due to the importance of timing the VXX entry and exit – signals from the VIX curve may not signal VXX entries and exits timely enough.
Term Structure-Based Combinations
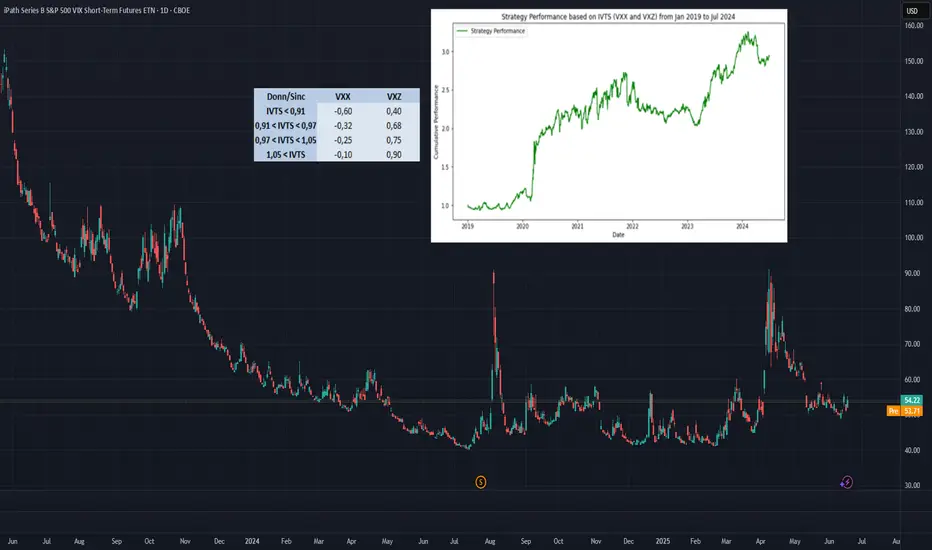
• Combine short VXX with long VXZ (an ETP tracking longer-dated VIX futures, balancing the 4th to 7th VIX contracts to achieve a constant expiration of 60days).
• Weighting is determined by the Implied Volatility Term Structure (IVTS), calculated as VIX / VIX3M. This approach adjusts positions based on the shape of the VIX futures curve, indicated by the IVTS. For instance, when the VIX futures curve shifts from contango (where near-term futures are cheaper than longer-term ones) to backwardation (where near-term futures are more expensive), it involves reducing short positions in VXX and increasing long positions in VXZ.
• This approach mimics the spirit of a calendar spread strategy in VIX futures and reflects the “S&P 500 Dynamic VIX Futures Index” , with weightings backed by research from Donninger (2011) and Sinclair (2013) - see performance chart and weighting-matrix enclosed in the introductory chart).
________________________________________
VIX Curves as Market Indicators
Beyond trading, VIX instruments and their term structure are widely used as market sentiment gauges. For instance:
Signs of Market Calm:
• VIX9D < VIX
• VIX < VIX3M
• VIX < VX1
• VX1 < VX2
These relationships imply that short-term volatility is lower than longer-term expectations, indicating near-term calmness in markets, occasionally leading to market complacency.
Traders and institutions use these signals to:
• Adjust positioning in broad market indices
• Determine hedging requirements
• Evaluate suitability of selling naked options
________________________________________
Final Thoughts
VIX ETPs offer a powerful toolkit for traders seeking to profit from or hedge against volatility. But they come with structural decay, leverage dynamics, and curve risk. Timing, strategy, and risk control are key.
Average US Stock Rebounds as VIX Dies – But Who's Really WinningThe Value Line Geometric Index ( NYSE:VALUG ), representing the average US stock, has bounced hard off multi-year support, right as Trump makes global headlines for striking billion-dollar “deals” in the Middle East.
But let’s call this what it is:
Deregulation for aircraft, crypto, energy 🛩️💸⚡
Tariffs and restrictions on retail, green tech, and small business 🏪🌱📉
And all while sitting on personal meme coin bags worth billions.
Meanwhile, volatility ( TVC:VIX ) is back to sleep, and main street stocks are climbing — but who is actually winning here?

VIX – “Liquidity Pool Bounce & Reversal Setup”🟢 VIX – “Liquidity Pool Bounce & Reversal Setup”
📅 Date: April 22, 2025
⏰ Multi-Timeframe Analysis (12h, 1D, 1h, 30m, 5m)
🔎 Global Context:
The Volatility Index (VIX) is reacting to a clear institutional liquidity zone (blue area) across multiple timeframes (12h, 1D, 1h), aligning with a mean reversion move following the explosive rally earlier this month. We’re seeing multiple signs of a potential bullish reversal:
Previous lows + demand zone confluence
Multiple CHoCH (Change of Character) events on lower timeframes
Implied divergence from equities (not shown here, but inferred)
Strong rejection from the institutional block (26.345–26.600)
🔍 Technical Analysis & Justification:
📌 Wyckoff & Smart Money Concepts (SMC):
On 30m and 1h charts, we observe several CHoCH and BOS events suggesting a transition from redistribution into accumulation.
The latest bearish move failed to break the weak low zone (26.345), indicating a liquidity grab trap.
📌 Fibonacci & Moving Averages:
Price touched the 78.6%–88.6% retracement from the previous bullish leg.
EMAs 8/21 (Orange/Blue) are about to cross bullish on 5m and 30m – a typical trigger for a new impulsive move.
EMA200 (White) still hovers above – likely target of the first bullish push.
📌 Volume Profile (implicit):
Most of the recent consolidation occurred in the 27.00–27.40 imbalance zone, which now acts as a magnet for price during retracement.
📌 Liquidity & Order Flow Concepts:
The 26.345–26.600 range served as a Weak Low and was swept clean – classic liquidity trap behavior.
📈 Trade Parameters:
🟢 Entry (Buy): 26.795
🔒 Stop-Loss (SL): 26.345 (below last liquidity sweep)
🎯 Take Profit 1 (TP1): 27.390 (inefficiency zone + EMA200)
🎯 Take Profit 2 (TP2): 28.150 (1h/30m order block)
🧮 Risk-Reward Ratio (RR):
TP1: ~1.6
TP2: ~3.0
📊 Confidence Level: ⭐⭐⭐⭐ (High-probability setup)
🧠 Strategic Summary:
This is a classic reversal play based on liquidity absorption and structural shift (CHoCH), supported by multi-timeframe alignment. A bullish engulfing or strong reaction inside the blue zone confirms the entry bias. If price breaks above 27.00 with volume, momentum may carry it towards 28.00+ swiftly.
⚠️ Risk Disclaimer: Trading involves risk. Only trade with capital you can afford to lose. Always manage your exposure wisely.
💬 What do you think of this setup? Do you see confluence with your strategy? Let’s discuss below! 👇

VIX is readying for a golden shot#vix the volatility index is consolidating in falling megaphone channel for another impulsive wave. TVC:VIX had the 1st wave when trade wars begin (But i warned you 3 months ago with VIX chart) then 2nd wave of correction in progress and when 2nd wave consolidation is done, 3rd wave far more cruel than 1st wave will set sail. Beware with your high risk positions, just a warning. Not financial advice. DYOR.

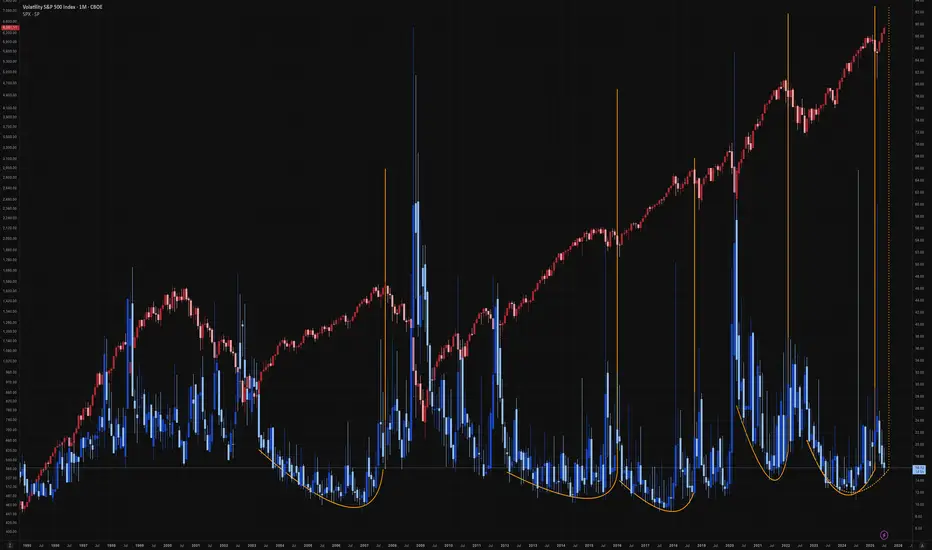
VIX Hits 27-Year Extreme. Is the Market About to CRASH or SOAR?The Volatility Index (VIX displayed by the blue trend-line) has entered a level that has visited only another 5 times in the last 27 years (since August 1998)! That is what we've called the 'VIX Max Panic Resistance Zone'. As the name suggests that indicates ultimate panic for the stock markets, which was fueled by massive sell-offs, leading to extreme volatility and uncertainty.
So the obvious question arises: 'Is this Good or Bad for the market??'
The answer is pretty clear if you look at the chart objectively and with a clear perspective. In 4 out of those 5 times, the S&P500 (SPX) bottomed exactly on the month of the VIX Max Panic signal. It was only during the 2008 U.S. Housing Crisis that VIX hit the Max Panic Zone in October 2008 but bottomed 5 months late in March 2009.
As a result, this is historically a very strong opportunity for a multi-year buy position. If anything, today's VIX situation looks more similar to September 2011 or even the bottom of the previous U.S. - China Trade war in March 2020.
-------------------------------------------------------------------------------
** Please LIKE 👍, FOLLOW ✅, SHARE 🙌 and COMMENT ✍ if you enjoy this idea! Also share your ideas and charts in the comments section below! This is best way to keep it relevant, support us, keep the content here free and allow the idea to reach as many people as possible. **
-------------------------------------------------------------------------------
💸💸💸💸💸💸
👇 👇 👇 👇 👇 👇

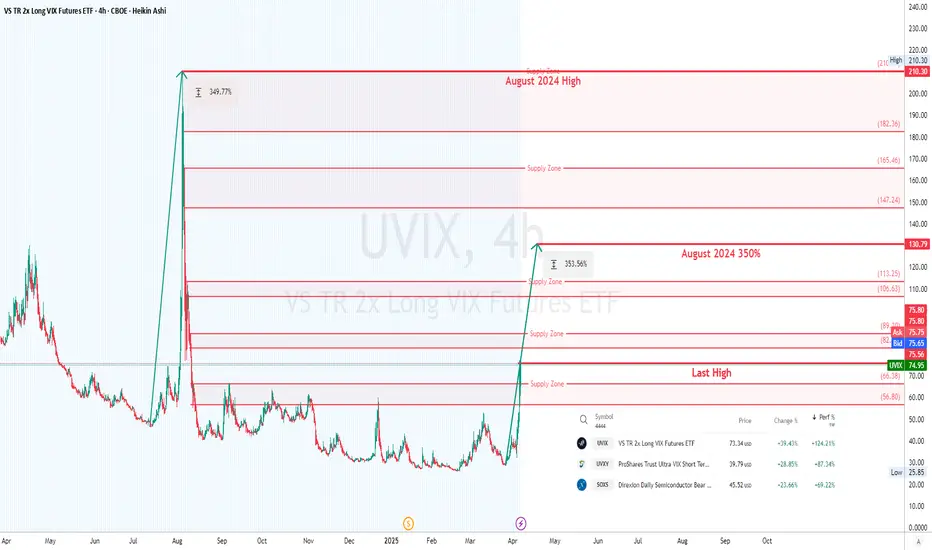
Trading UVIX for Effective Hedge📊 Trade Idea: UVIX Multi-Layered Entry Strategy (Scalping Volatility Spikes)
The current market environment presents a unique opportunity to trade the Volatility Shares 2x Long VIX Futures ETF (UVIX), which has surged nearly 50% on Thursday and 124% over the last week. With ongoing fears surrounding President Trump's reciprocal tariffs, volatility is expected to remain elevated.
🔍 What Is UVIX?
UVIX is a leveraged ETF designed to provide twice (2x) the daily return of the Long VIX Futures Index. Unlike the VIX itself, which measures expected market volatility, UVIX holds futures contracts on the VIX, aiming to profit from both upward spikes in volatility and the structure of the futures market.
Pros of UVIX:
High Return Potential: Can deliver significant gains when market volatility spikes.
Effective Hedge: A powerful tool to offset losses during broad market declines.
Liquidity: Offers easy access to volatility exposure without directly trading VIX futures.
Cons of UVIX:
High Volatility: Amplified moves can result in large gains or substantial losses.
Decay & Compounding Issues: Daily rebalancing and futures roll costs can erode value over time.
Not Suitable for Long-Term Holding: Designed for short-term plays, not buy-and-hold investing.
Here’s my detailed risk-managed trading plan to profit from continued volatility.
🚀 Entry Strategy: Layered Buy Entries with Trailing Stops
🎯 Initial Entry:
Entry Price: 80.00 (Just above the breached Supply Zone 0: 56.80 - 66.38)
Stop Loss: Below the lower trend line from the recent parabolic move (For example, around 70.00).
📈 Position Scaling: Adding to Winning Positions
Use Buy Stop Orders:
As the price breaks above significant supply zones, place Buy Stop Orders to add positions.
Scale in positions at:
Level 1: Above 89.20 (Top of Supply Zone 1)
Level 2: Above 113.25 (Top of Supply Zone 2)
Level 3: Above 147.24 (Bottom of Supply Zone 3)
Level 4: Above 182.36 (Bottom of Supply Zone 4)
Manual Entries:
Alternatively, you can manually add positions on strong breakouts during or outside Regular Trading Hours (RTH) to catch volatility spikes.
!!!Use Limit Orders Outside RTH!!
Place limit orders during off-hours to capture sharp volatility moves when liquidity is lower.
Market volatility often increases during pre-market or post-market sessions. Capitalize on these moves with well-placed limit orders.
🛡️ Risk Management: Trailing Stops & Break-Even Protection
Initial Stop Loss:
Set below the lower trend line (e.g., 70.00). This provides a wide margin for market fluctuations while still protecting your position.
Trailing Stop Loss:
As the price progresses upward, move your stop loss to higher levels to secure profits.
Use a dynamic trailing stop that follows major support levels or recent lows.
Break-Even :
Once UVIX has moved 10-20% above your entry point (80.00), move your stop loss to break even (80.00) for a risk free trade.
📌 Profit Targets
Target 1: 130.79 (Historical 350% level from July 2024 move)
Target 2: 165.46 (Top of Supply Zone 3)
Target 3: 210.30 (August 2024 High)
Adding positions as the price moves in your favor allows for maximum profit potential while limiting risk on initial entries.
Moving the stop loss to break-even creates a risk-free trade, allowing you to ride the momentum without worry.
Continually adjusting stops protects profits as they accumulate, ensuring that gains are secured even if the market turns sharply.
📣 Final Thoughts
The Volatility Shares 2x Long VIX Futures ETF (UVIX) is a powerful instrument for profiting from short-term volatility spikes. Given the current geopolitical and economic uncertainty, this setup offers a strong risk-reward opportunity.
💡Advice: Avoid Greed & Gambling in Volatility Trading
Trading the Volatility Shares 2x Long VIX Futures ETF (UVIX) offers tremendous profit potential during periods of heightened market volatility. However, the same leverage that can generate huge gains can just as easily cause significant losses. Avoiding greed and gambling behavior is crucial for your long-term success.
$VIX Hits 45! $BTC Historically Pumps Soon AfterThe TVC:VIX has only hit above 45 on 5 occasions in the history of CRYPTOCAP:BTC
Each time it did, BTC pumped at least 20%

Will the Fear Gauge Flash Red?The Cboe Volatility Index (VIX), Wall Street's closely watched "fear gauge," is poised for a potential surge due to US President Donald Trump's assertive policy agenda. This article examines the confluence of factors, primarily Trump's planned tariffs and escalating geopolitical tensions, that are likely to inject significant uncertainty into the financial markets. Historically, the VIX has proven to be a reliable indicator of investor anxiety, spiking during economic and political instability periods. The current climate, marked by a potential trade war and heightened international risks, suggests a strong likelihood of increased market volatility and a corresponding rise in the VIX.
President Trump's impending "Liberation Day" tariffs, set to target all countries with reciprocal duties, have already sparked considerable concern among economists and financial institutions. Experts at Goldman Sachs and J.P. Morgan predict that these tariffs will lead to higher inflation, slower economic growth, and an elevated risk of recession in the US. The sheer scale and breadth of these tariffs, affecting major trading partners and critical industries, create an environment of unpredictability that unsettles investors and compels them to seek protection against potential market downturns, a dynamic that typically drives the VIX upward.
Adding to the market's unease are the growing geopolitical fault lines involving the US and both China and Iran. Trade disputes and strategic rivalry with China, coupled with President Trump's confrontational stance and threats of military action against Iran over its nuclear program, contribute significantly to global instability. These high-stakes international situations, fraught with the potential for escalation, naturally trigger investor anxiety and a flight to safety, further fueling expectations of increased market volatility as measured by the VIX.
In conclusion, the combination of President Trump's aggressive trade policies and the mounting geopolitical risks presents a compelling case for a significant rise in the VIX. Market analysts have already observed this trend, and historical patterns during similar periods of uncertainty reinforce the expectation of heightened volatility. As investors grapple with the potential economic fallout from tariffs and the dangers of international conflicts, the VIX will likely serve as a crucial barometer, reflecting the increasing fear and uncertainty permeating the financial landscape.

Nasdaq 100 Volatility. US Tech Stocks Remain 'Runoff Smelling'It's gone two months or so... (Duh..? WTF.. only two monts, really? 😸) since comrade Trump entered The White House (again).
Everyone was on a rush, chatting endless "Blah-Blah-Blah", "I-crypto-czar", "crypto-capital-of-the-world", "we-robot", "mambo-jumbo", "super-duper", AI, VR and so on hyped bullsh#t.
- And now?..
- It's gone. It's absolutely gone..!
Leveraged bets and crypto assets turned into Bearish market; all four major US indices (S&P500, DJIA, Nasdaq 100 and Russell 2000) are negative over the past two months, while Gold OANDA:XAUUSD has doubled in price over the past 5 years (4th time in history ever), and remain the only is premium positioned.
This is why we at our 💖 Beloved @PandorraResearch Team decided to paint this idea for Nasdaq 100 Volatility Index CBOE:VXN to emphasize (again) that nothing last forever and no one should chase a feather, or dust in the wind.
Broadly-known ominously among investors as the "fear index" and launched by the Chicago Board Options Exchange (now the Cboe) in 1993, the Volatility Index (VIX) is meant to present the market's expectation of volatility over the coming 30 days. The metric is derived from options prices on the S&P 500 Index and captures the anticipated swings that drive investor sentiment.
In recent years, the VIX has become a far more central index, especially during periods of financial turbulence, such as the 2008 financial crisis and the COVID-19 pandemic. During these stretches, spikes in the VIX reflected widespread anxiety; during others, it's been a crucial barometer for market participants seeking a glimpse into investors' collective psyche. When the VIX is low, this suggests calm seas ahead. When it spikes, it signals approaching storms.
Every single stock index do have its own volatility.
This story (again) is about Cboe NASDAQ-100 Volatility Index CBOE:VXN
The Cboe NASDAQ-100 Volatility Index (VXN) is a key measure of market expectations of near-term volatility conveyed by NASDAQ-100 Index (NDX) option prices. It measures the market's expectation of 30-day volatility implicit in the prices of near-term NASDAQ-100 options. VXN is quoted in percentage points, just like the standard deviation of a rate of return, e.g. 19.36. Cboe disseminates the VXN index value continuously during trading hours.
The VXN Index is a leading barometer of investor sentiment and market volatility relating to the NASDAQ-100 Index.
Learn more about Methodology for Calculation of the VXN Index, using official CBOE website.
Technical observations
The main technical graph indicates that CBOE:VXN Index has recently jumped to current 'above 20' basic points.
In nowadays 'above 20' VXN levels indicate on further potentail Bearish progress in US Tech Stocks (Nasdaq 100 Index NASDAQ:NDX ).
--
Best wishes,
@PandorraResearch Team

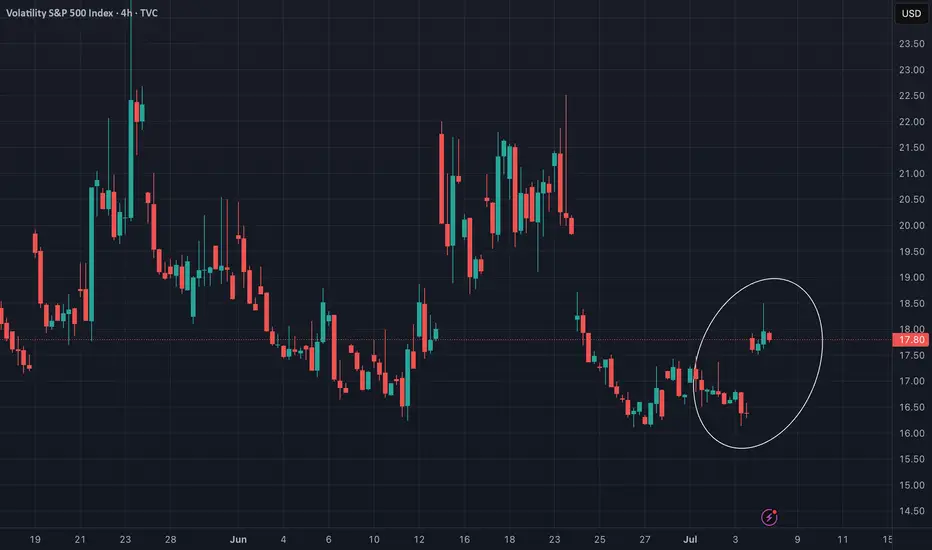
Greatest Volatility of all times is approaching...#vix the volatility index has been accumulating since covid 2020 crash. In higher time frame, TVC:VIX has broken out in 5th August 2024 and it was just a test!.. Then continued consolidation till this time , also doing the retest. at this zone, accumulation of the 2020 covid crash for a new impulsive wave!..
In lower time frame , several days ago VIX broke out the accumulation zone coming from 5th August and this warns you about your greedy positions my friends. We haven' t seen a real great volatility since covid crash and VIX chart is getting alarming. You' ve been warned. Not financial advice.
Temporary INVALIDATION: If VIX dumps below 13 zone , this will be more secure. Below 10 is the main invalidation.

BTC Short SqueezeBitcoin is currently trading green for the week, where it currently sits at US$96,700.
The Bollinger bands are continuing to compress, indicating that the price range of which Bitcoin is trading is narrowing.
Should we get a kick in volatility in the coming days, below are some potential outcomes.
Sentiment in crypto markets have taken a hit in recent weeks, with the fear and greed index currently indicating market sentiment as fearful.
Global exchange data from Coinglass suggests that if Bitcoin surges to US$100,000, up to $5 billion in short leveraged positions could be liquidated, triggering a potential short squeeze as traders rush to cover their positions.
Bitcoin volatility has also dropped to its lowest point since August 2024.
Bullish Scenario
Price may head towards $102k which is the February monthly open; this could be fuelled by a short squeeze – based on what we know from the exchange data referenced earlier.
Bearish Scenario
Price failing to remain above the yearly open of circa $93k could result in a move back towards the January low of $89k.

VOLATILITY is loading...#vix the volatility index is gaining momentum for another strike to markets. Take care on your risky positions and assets like #stocks and #crypto

VIX ready to explode higherLook at the last 2 Monthly candles. They are bullish candles and short term volatility would explode higher in Feb 2025.
All the best.
Marketpanda
Disclaimer: The information provided is for general informational and educational purposes only, and does not constitute financial, investment, or legal advice. None of the content shared should be relied upon as the sole basis for making investment decisions. Prior to making any financial or investment decisions, it is strongly recommended that you consult with a qualified financial advisor, accountant, or other professional who is familiar with your individual circumstances and risk tolerance. Any reliance you place on the information presented is strictly at your own risk, and we are not responsible for any losses, damages, or liabilities resulting from your investment or trading activities.

VIX Will GO DOWN|SHORT|
✅VIX is trading in a local
Downtrend and we are now
Seeing a bearish breakout
Of the rising support line
So we will be expecting a
Further bearish move down
SHORT🔥
✅Like and subscribe to never miss a new idea!✅

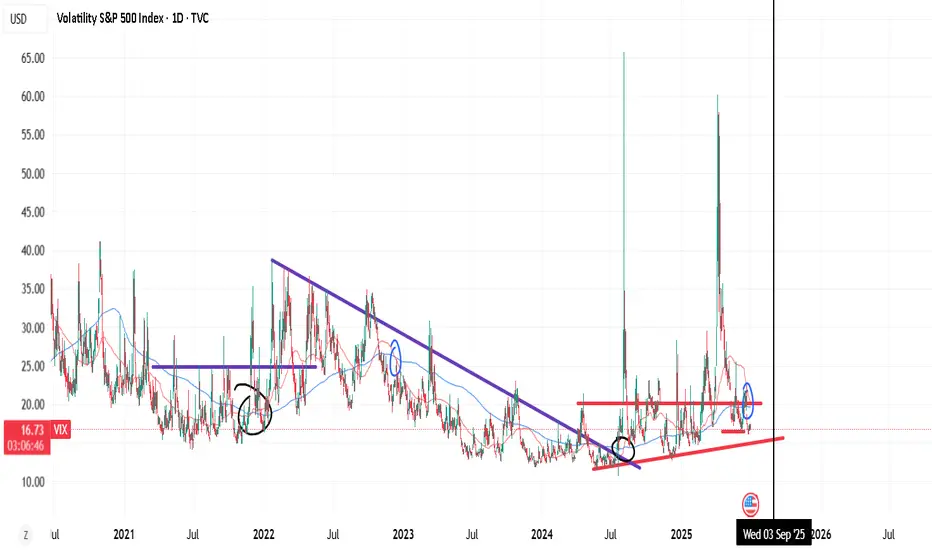
Countdown to Mega Volatility?#vix #volatilityindex has been declined 2 times after 5th August top. The last declination was at US elections day. Now, it' s clearly seen that TVC:VIX has broke out the trendline resistance for 4 months!. With retest or without retest if this #vixindex is not a fake out, then a great volatility is expected in nearly all markets in short / mid term. A pump in index will surely damage nearly all markets. Avoiding high risky positions is recommended.

Incoming volatility detected...#vix TVC:VIX the volatility index has bounced hard just a while ago. A breakout will surely damage all markets if succeeds.
