VIX: From “Calm Tension” to a ReboundWhy does a small uptick matter today… if we’ve already seen 60+ readings four times in the past 17 years?
The first week of August 2025 brought back a familiar market force: volatility.
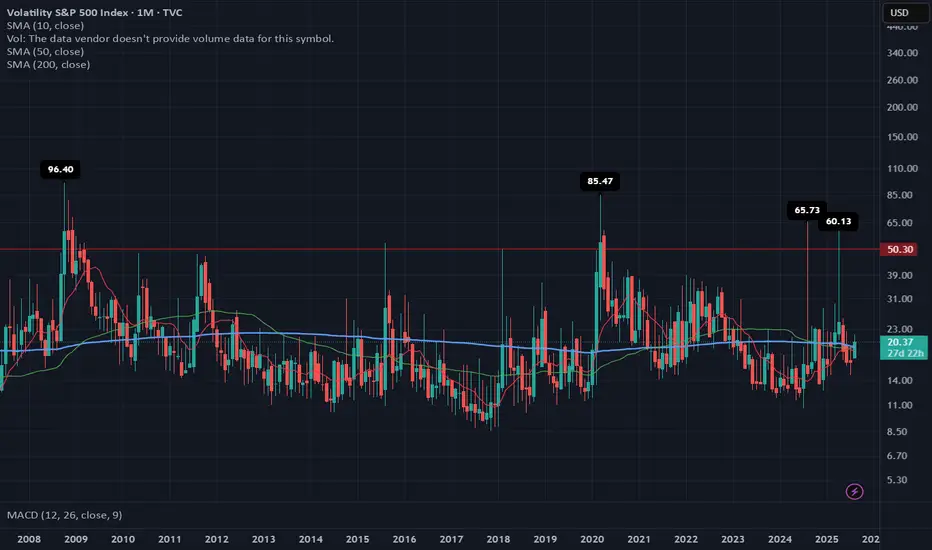
The VIX, which tracks expected fluctuations in the S&P 500, jumped 21% in just a few days, rising from 17.4 to 20.37, with an intraday high of 21.9 on August 1.
At first glance, the move may seem minor. But it broke through key long-term moving averages (SMA 50 and 200) and exited its recent comfort zone (14–19 pts). That alone is enough to make portfolio managers and traders pay attention again.
🔙 Historical context: when the VIX truly spiked
📅 Date 🔺 VIX intraday 🧨 Trigger
Oct 1, 2008 96.40 Subprime mortgage crisis, Lehman collapse, AIG bailout
Mar 2, 2020 85.47 COVID-19 global spread, border shutdowns
Aug 5, 2024 65.73 Surprise Fed rate hike + overheated jobs data
Apr 7, 2025 60.13 Panic over new U.S. tariffs on global partners
Compared to those moments, today's VIX levels look “mild.” But the technical and macroeconomic signals suggest that volatility may be establishing a new baseline.
1. 📊 Breakdown: First week of August 2025
Weekly increase: from 17.4 → 20.37 (+21%).
Technical breakout: monthly close above both the 50-day and 200-day simple moving averages (SMA 19.25 and 19.45).
MACD on the monthly chart has flipped positive for the first time since March 2023.
Key drivers:
🏛️ The Fed left interest rates unchanged on July 30, but two dissenting votes favored a rate cut.
👷♂️ Softening jobs data: July NFP came in at only +73,000 jobs (vs. +110,000 expected).
🧾 New U.S. tariffs, announced on August 1, reignited inflation concerns.
2. ⚖️ Comparing August 2025 to the August 2024 storm
Factor August 2024 August 2025 (Week 1)
🔺 VIX peak 65.73 21.9
🏛️ Fed stance Surprise 25 bp rate hike Rates unchanged, internal division
👷 Labor market Hot, wage pressures Cooling down
📉 S&P 500 reaction −12% in 3 weeks Approx. −3% decline underway
💧 Market liquidity Very low (pre-market) Normal
Conclusion:
2024 was a systemic shock.
2025 is more of a volatility warning sign—but one that matters for risk management.
3. 📍 Technical signals to monitor
The monthly MACD just turned positive, which historically precedes sustained volatility spikes.
Key short-term range: 18–22 pts. A sustained close above 22 could trigger heavy selling in high-beta stocks.
Options expiration (OPEX, Aug 16) may amplify moves via gamma flows.
4. 🔮 What could move the VIX next?
📅 Date 📌 Event ⚠️ Volatility Risk
Aug 14 Core CPI (July) Reading above 0.3% m/m could reignite hawkish Fed bets
Aug 22–23 Jackson Hole Symposium Powell’s speech could reset the policy outlook
End of Aug Q2 GDP revision Confirm whether slowdown = soft landing or stagflation
📌 Note: The VIX cannot be traded directly. Exposure is typically obtained through futures, options, or ETNs—each with specific risks like contango, low liquidity, and roll decay.
📌 Final thoughts
The VIX doesn’t need to hit 60 to send a message.
The fact that it’s breaking above long-term averages, reacting sharply to macro data, and threatening key levels is enough to suggest that the era of ultra-low volatility may be ending.
History shows us that major VIX spikes come fast and unannounced.
If you remember 2008, 2020, or even April 2025—you know that preparation beats prediction.
Volatilty
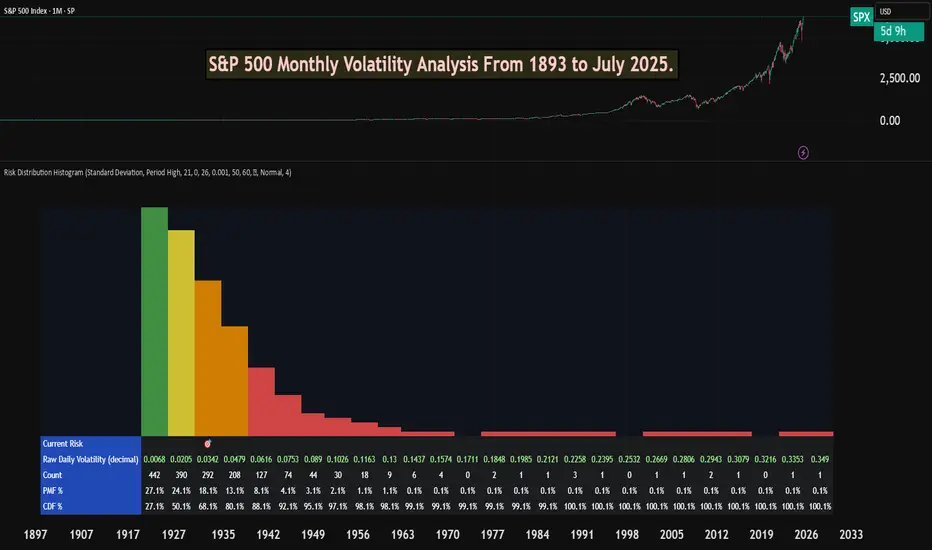
S&P 500 Monthly Volatility Analysis From 1893 to July 2025Most of the time, the S&P 500 is seen as a low-volatility index when compared to most individual stocks, small-cap indexes, or indexes from other countries.
However, most investors don't know exactly what volatility to expect from a statistical perspective.
The Risk Distribution Histogram allows us to understand exactly how risk is distributed.
S&P 500 Statistical Risk Distribution
Here are some highlights from what we get from the analysis. Some of this data might actually surprise investors. The data is monthly:
27% of all months have volatility under 0.68%
80% of all months' volatility was under 4.79%
5% of all months had a volatility of over 7%
If we can call a volatility over 25% a severe crash or "grey" swan, we had 7 of those events
3 months with extreme volatility over 30%
This allows us to understand tail risk and plan ahead. While most times the S&P 500 is in the low volatility zone, extreme events can happen.
What can we learn from this?
Prepare for rare but possible high-volatility events.
Understand the 80/20 rule. Most months are very low volatility, but 20% of them will have a volatility higher than 5% approximately.
Avoid overconfidence in stability
Plan for long-term horizons. High volatility tends to "dissipate" in the long term.
This is why it's important not to discard rare high-volatility events, especially when the investor is in need of liquidity.
This risk analysis can be done for any ticker.
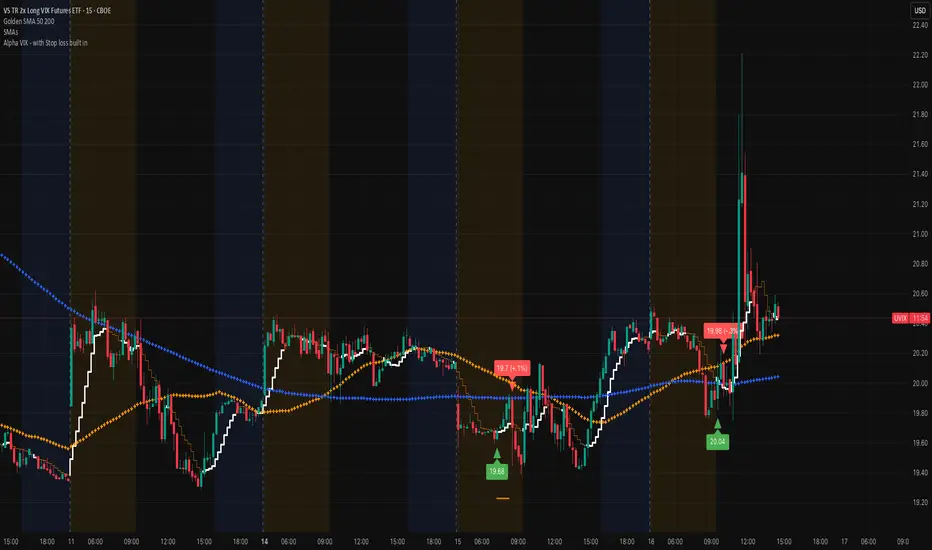
UVIX marching on (VIX proxy)Very nice spike this morning, that's typically a sign that there's more volatility in the works. Remember that we are at record lows on the VIX and that doesn't stay in this region for a long time. Add the Alpha VIX indicator to help you get an entry. The economy is brittle and staying focused on the VIX is a very nice play!
Best of luck and DM if you have any questions.....
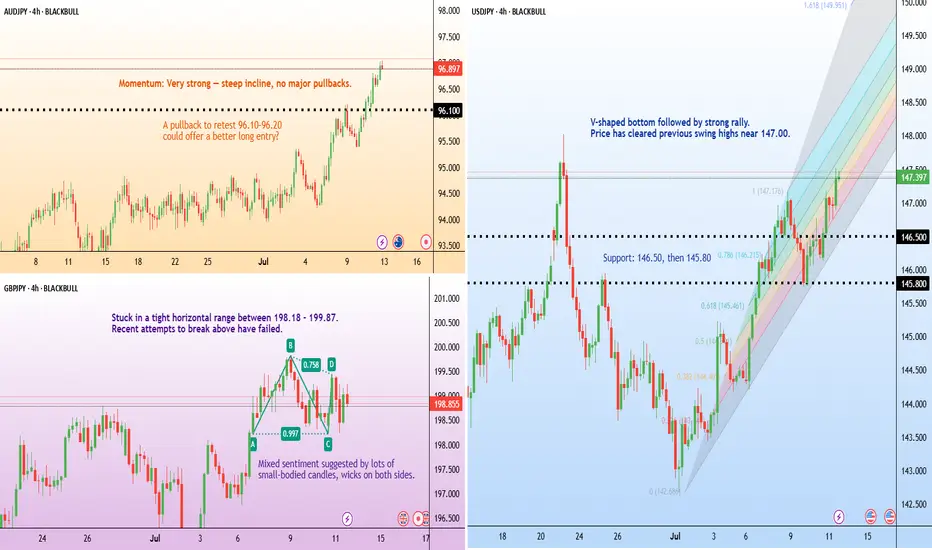
Why election risk means yen volatility could rise this weekThe Japanese yen remains vulnerable ahead of Japan’s Upper House election on July 20.
Polls suggest the ruling LDP-Komeito coalition may lose its Upper House majority. Such an outcome would further weaken Prime Minister Shigeru Ishiba’s position, with his government already operating as a minority in the Lower House.
Adding to the pressure, the U.S. is set to impose 25% tariffs on Japanese goods from August 1—part of a broader protectionist push.
BVOL: Volatility Compression Before the Final ExpansionThis chart might not get as much attention as BTC dominance or TOTAL, but Bitcoin volatility (BVOL) is one of the cleanest leading indicators when it comes to identifying market tops and bottoms.
Just look at the history — every major macro top or bottom in BTC price has correlated with a peak or trough in this chart. Whether it was the ATH in March 2024, the October 2024 breakout, or the deep pullbacks into key lows, BVOL has nailed the timing with precision.
Right now, we’re seeing volatility compressing hard — currently sitting around 13.17 — and heading into my targeted demand zone which has historically marked major inflection points.
🧠 What does this mean?
Volatility this low = market indecision + positioning. It’s when liquidity gets sucked dry before a major expansion move.
My expectation is:
- BVOL will soon hit demand and reverse
- BTC will complete its current correction
- Once volatility expands again, it likely aligns with a reversal and move into new ATHs — the final bullish phase of this cycle
Just like in past cycles, low volatility precedes explosive directional moves. This current compression is setting the stage — once the lid comes off, the move is usually fast and decisive.
⚠️ Watch this closely. BTC correcting into demand + BVOL hitting this low = confluence for the next trending leg.
Big picture context:
We’re deep into the 4-year cycle structure, with a macro top expected into Q3/Q4 2025. This setup supports the idea that after this consolidation and volatility reset, BTC could make one final leg up before distribution begins.
Let the volatility tell the story — it usually whispers before it roars.

Average US Stock Rebounds as VIX Dies – But Who's Really WinningThe Value Line Geometric Index ( NYSE:VALUG ), representing the average US stock, has bounced hard off multi-year support, right as Trump makes global headlines for striking billion-dollar “deals” in the Middle East.
But let’s call this what it is:
Deregulation for aircraft, crypto, energy 🛩️💸⚡
Tariffs and restrictions on retail, green tech, and small business 🏪🌱📉
And all while sitting on personal meme coin bags worth billions.
Meanwhile, volatility ( TVC:VIX ) is back to sleep, and main street stocks are climbing — but who is actually winning here?

What Makes a Chart Tradable – Part TwoIn the previous post , we explored the foundations of technical trading. We examined how market behavior can appear structured even when it results from randomness, how bias affects interpretation and how volatility persistence helps explain why certain moves tend to cluster rather than appear in isolation. This post builds on that foundation by focusing on how to recognize meaningful movement and determine whether a chart structure is tradable.
Technical charts often present a wide range of setups, patterns, and interpretations. But a core distinction must be made between coincidental formations and actual price behavior driven by imbalance. Not all movements are equal, and recognizing the difference between random fluctuation and purposeful structure is essential.
A common assumption in technical analysis is that certain patterns or shapes inherently provide a specific outcome. This assumption is problematic without a defined context. The ability to recognize a flag or wedge does not imply statistical validity. For a price movement to be tradable, there should be characteristics that suggest underlying buying or selling pressure.
Unusual Movement
To determine whether a price move is meaningful, it must be assessed in relation to what is typical for that market. All assets have their own average range, pace and rhythm. When price breaks from that baseline through unusually strong or sustained movement, it can signal momentum or imbalance.
What makes these moves relevant is not their size alone, but the fact that they differ from normal behavior. This kind of shift may reflect changes in supply and demand or a reaction to new information. Such movements could mark a change in behavior and can serve as reference points. Their value lies in being statistically uncommon, which may suggest that market conditions have changed.
Pullbacks as Rebalance
Following strong directional movement, price tends to enter a state of reversion or pause. This is known as a pullback, a controlled retracement .It is not merely a pause. It reflects a psychological reset and the temporary rebalancing of order flow in response to imbalance.
Not all pullbacks are viable. For a setup to be considered tradable, the retracement must occur in the context of a meaningful prior move. When the underlying trend is intact and the pullback is controlled, the structure can offer a more reliable opportunity.
The Role of Standardization
Trading should be based on discretion. It involves interpretation, context and deliberate decision-making. But without structure, it risks becoming inconsistent and reactive.
Therefore movement and momentum should be measurable. What appears meaningful must be evaluated relative to the asset’s own historical behavior, not assumed based on surface-level appearance. Without a reference, the evaluation may lack foundation.
Measurement supports model building. Standardization supports disciplined execution. A trader might believe a move is strong based on visual cues or pattern familiarity, but if it lacks historical context or fails to meet defined criteria, that evaluation could be flawed.
Framework and Models
There are categories of tools that can be incorporated to support standardization. The choice is not fixed and should be based on personal preference, methods and research. Example:
Volatility Measure: Could be used to confirm when price moves outside a volatility-based envelope, indicating movement beyond the average range.
Momentum Measure: Could be used to confirm whether current price action is faster or stronger compared to recent historical behavior.
Such models are used to define context, not to predict outcomes. They help standardize analysis and filter out questionable movements and patterns.
Conclusion
The textbook patterns often referenced on their own do not create edge. Tradable charts are those where meaningful movement, defined by momentum, imbalance and structure, can be observed and evaluated using standardized methods. The purpose is not precision but repeatability. Discretionary trading is built on contextual evaluation supported by consistency and objective tools.

I SPY an opportunity to riseThe "macro" environment has an extreme bearish tone. There is a great deal of uncertainty still. So let's look to the charts to see what's the deal. Monday morning was a spill over from Trump's tantrums and we bounced at the end of the day Monday with a wick. Interesting note... big tech earnings was beginning. What a perfect time to see some rise on the charts.
NFLX already had us anticipating some positive movement b/c of their Good Friday earnings. So most people were focused on the play of 1000-1100. So many people took a position.
Back to SPY... Trump stated after hours after during TSLAs awful earnings call that he was not going to fire JPowell and TSLA began rallying as well as other big tech companies (interesting). The rallies held overnight. There were selloffs after the earnings, creating HL (higher lows) that held across many charts. The week proceeded and we slowly rose the rest of the week.
I'm recalling that Trump initiated a 90 day pause. & though their is still negative chatter and uncertainty with the final outcome; it's enough to have bullish thoughts for the remainder of the earnings season (esp big tech and major companies) while we chop.
Cautiously viewing the charts one day at a time; watching for candlestick patterns to assist with plays. If the pattern is bullish, looking for a bullish play. if the pattern is bearish, looking for a bearish play. Or... just pick a side and wait for what you connect to. My notes on candle recognition below over the next week will be below.
Tootles

XAUUSD Volatility in Focus: Caution Advised for PullbackCurrently, I estimate that XAUUSD is nearing the end of wave iii of wave (v). I present two potential scenarios:
In the black label scenario, XAUUSD may continue its upward movement to complete wave iii, with a projected target in the 3,372–3,410 range.
However, under the red label scenario, there is a possibility of a short-term correction toward the 3,284–3,301 area before resuming the uptrend toward the same target zone.
Traders should closely monitor price action, as increased volatility is likely in the near term.

Short Volatility during rare spikes using leveraged ETF $UVXYOverview
Volatility represents how greatly an asset’s prices swing around the mean price. Historically there are rarely brief volatility flare-ups that present trading opportunities. Trying to anticipate volatile events can be costly, because other market participants generally expect the same well known events, and one never knows how big a volatility spike might arise from a given event. Instead if one merely awaits extreme volatility events, which historically are ephemeral, there's a higher probability trade in shorting it. I've thought about this previously, and took the opportunity with Liberation Day to successfully short volatility.
Volatility Instrument Selection
Choosing an appropriate instrument can aid in the likelihood of a successful short position. Among the options CBOE:UVXY looks attractive for the trade, because it's a leveraged ETF, is highly liquid, and provides options with granular strike prices and expiration dates. Leveraged ETFs are known to decline over time due to
Daily rebalancing and compounding effects
Volatility drag
Cost of leverage
Management fees and expenses
Path dependency
These characteristics of leveraged ETFs provide a structural tailwind to a short position, because the instrument naturally declines over time. This phenomenon easy enough to see on a CBOE:UVXY weekly chart
Moreover selection of a liquid product is prudent. At the time of writing CBOE:UVXY has an average daily volume north of $22 million dollars for the past 30 days.
Trade execution
Execution of the trade starts with recognition of a highly volatile event, this is both technical and discretionary. From there a trader is advised to use their preferred tactics to select entry, stop-loss and exit points. Personally I like to use chart patterns across different timeframes in tandem with Relative Strength Index, and to a lesser extent volume to identify trading setups. I use longer term charts to identify a trend, and shorter timeframe charts to determine entry and exit points. The timeframe(s) depend on the particular instrument and what the charts look like at the time of the trade.
During the Liberation Day Volatility Short trade, I've been using 1W, 1D, 4H and 1H charts.
The 1H chart has been suitable for entering an exiting trades. Head & Shoulders patterns have manifested both on price and momentum alongside declining volume. I've posted a couple CBOE:UVXY minds along the way.
Additional Thoughts
Volatility can also be used generally to anticipate moves in other asset classes, such as stocks, bonds, crypto and commodities. Using the levels from that last chart fed into successful NASDAQ:TQQQ & NASDAQ:SQQQ trades in the aftermath of Liberation Day.

Buying The Dip / Dollar Cost AveragingI recently published my first script and felt now would be a good time to share something I feel could help some people out. I have been trading since 2021 and it has been an amazing journey. Anyhow, I would consider myself a value based investor and in it for the long term.
So as the market takes a dip - now is certainly the time to be buying the dip or dollar cost averaging. The way I see it, if you are going to DCA/Buy The Dip, it might be handy to have access to a tool that is slightly better than just regularly timed investments.
Take a look at my indicator and let me know your thoughts.
Comment, Like and Follow if you enjoy the strategy and companion indicator.

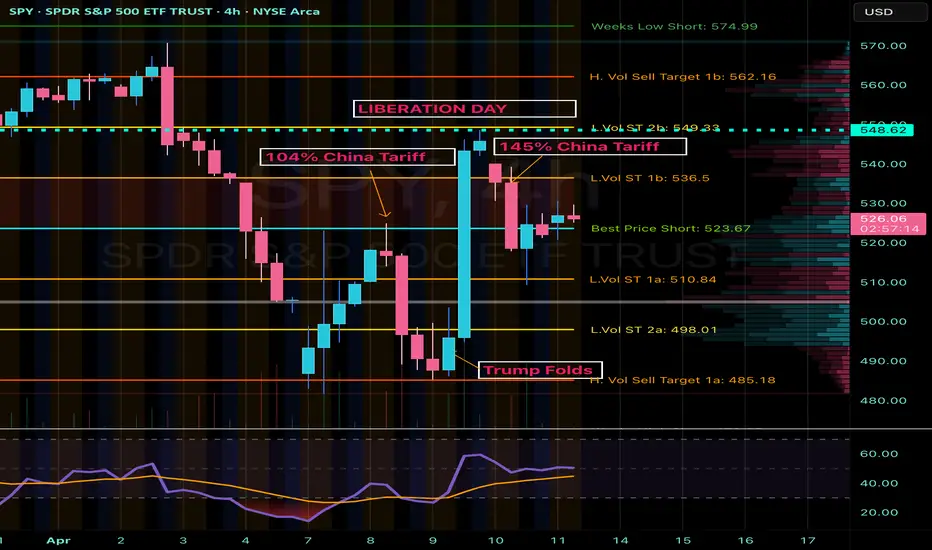
SPY Analysis: Navigating Tariff-Induced VolatilityContinuing from my last update, market volatility remains high due to Trump's unpredictable policy decisions. After initially folding and offering economic relief, Trump pivoted sharply with a sudden 145% tariff announcement. Today, China countered strongly with a 125% tariff. These escalating tariff exchanges continue to create significant uncertainty and market fluctuations, highlighting the critical need for careful analysis and precise trade management.
Technical Breakdown (4-Hour Chart)
Current Price Zone: Around $528.45
Key Resistance Levels:
- Immediate Resistance: $536.50 (L.Vol ST 1b)
- Critical Resistance: $549.33 - $549.60 (L.Vol ST 2b)
- Major Resistance Zone (Liberation Day): Approximately $562.16
Support Levels:
- Initial Support: $523.67 (Best Price Short)
- Secondary Support: $510.84 (L.Vol ST 1a)
- Important Lower Support: $498.01 (L.Vol ST 2a)
- Strong Support Level (Trump Folded area): ~$485.18
Trading Scenarios
Bullish Scenario (Potential Tariff Tension Relief):
- Entry Trigger: Confirmed breakout and sustained hold above resistance at $536.50.
Profit Targets:
- Target 1: $549.33 (next strong resistance level)
- Target 2: $562.16 (major resistance)
- Stop Loss: Below immediate support at $523.67, carefully managing downside risk.
Bearish Scenario (Ongoing Tariff Escalation or Increased Market Fear):
Entry Trigger: Inability to reclaim $536.50, or a decisive breakdown below support at $523.67.
Profit Targets:
- Target 1: $510.84 (nearest significant support)
- Target 2: $498.01 (secondary critical support)
- Target 3: $485.18 (robust support area)
- Stop Loss: Above resistance at $536.50 to protect against potential reversals.
Thought Process & Final Thoughts
The SPY currently trades within clearly defined resistance and support bands, heavily influenced by unpredictable tariff-driven headlines. Trump's volatile policy shifts and China's assertive retaliations amplify short-term market risks. Maintain flexible trading strategies, adhere strictly to established levels, and practice disciplined risk management. Continuous monitoring and swift response to evolving market sentiment will be essential for navigating this challenging environment effectively.
Path to 100 VIXI wrote this note on TVC:VIX a few days ago:
www.tradingview.com
And am now expanding it a bit more.
As someone who was working middle office during the original 2016 Trump Election, Brexit, during the Taper Tantrum and a few other major events - I want to lay out my principles on trading the VIX because spikes like this bring a lot of "first time" VIX traders to something that trades like NOTHING ELSE in the market.
This is not a stock in a short squeeze, this is not a generic index.
This is like nothing you've ever traded before. In fact, I'd encourage you to take advantage of TradingView's chart options and instead look at the chart of -1*$TVC:VIX.
That alone should give you pause.
----------------------------------
So - let's start with the principles of the finance business as laid out in the masterclass which was the movie "Margin Call" .
"John Tuld: There are three ways to make a living in this business: be first, be smarter, or cheat."
1. Be First.
You are not first if you are buying above the historic average of VIX 20-21.
If you were buying CBOE:UVXY since Jan 2025, you'd be up 175% right now and likely looking to re-balance into your desired long term asset positions.
2. Be Smarter.
* Are you taking into consideration the VIXEX Cycle?
* Do you know the effect of VIXEX before or after monthly OpEx?
* Do you know the current implied volatility curve of options ON the VIX?
* Do you know that of the last 4 times the VIX has hit 50, it went on to 80+ 50% of the time after that?
* Yes, I've seen the charts going around about forward S&P X year returns but did you know that after the VIX spike to 80 in October 2008, the market (in a decreasing volatility environment) went on a further 35% decline in the next 4-5 months?
* Where is the MOVE? What are the bond indexes & bond volatility measures doing? And if you don't yet understand that equities ALWAYS reacts to what is going on in the rates / yield world... you'll find out eventually. I hope.
3. Cheat
When things start going wrong, everyone wants an easy solution.
That's why its called a relief rally. It feels like relief - the bottom is in, the worst part is over.
But that is what the really big players have the biggest opportunity to play with the day to day environment.
They know our heuristics. They encourage the formation of cargo cult style investing whether that's HODL in the cryptocurrencies or Bogleheads in the vanguard ETFs.
It's all the same and encourages you to forgot first principles thinking about things like:
1. Is this actually a good price or is it just relatively cheap to recent history?
2. Who's going to have to dilute to survive the next period of tighter lending, import costs from tariffs, or whatever the problem of the day is.
3. VIX correlation - volatility is just a description of the markets. Its not a description of the direction. There is periods where volatility is positively correlated to the price movement (like during earnings beats). Know about this and know when it changes.
4. Etc.
Some have pointed out that is more appropriately a measure of liquidity in the SPX.
When VIX is low, that means there is lots of "friction" to price movement. It means that there is tons of orders on the L2 book keeping the current price from moving in any direction too quickly.
When VIX is high, that means there is very low "friction" to price movement. It means there are very few orders on the L2 book and market makers can "cheat" by appearing to create a low volume rally and then rug pull that price movement very quickly (not via spoofing, more just dynamic management of gamma & delta hedging requirements).
Additionally - volume itself becomes deceptive. Volume is just indicating that a trade happened.
Its not telling you to what degree the spread between the bid and ask has blown out to 1x, 2x, or 5x normal and that trades are executing only at the highest slippage prices in that spread.
All of these things are considerations that the market makers can use to make a "buy the dip" situation that works heavily to their advantage.
TLDR: "If you can't spot the sucker in your first half hour at the table, then you are the sucker"
----------------------------------
So - why / when would VIX go to 100?
In 2020, its easy to forget that a culmination of things stopped the crash at -35%.
* March 17, 2020 VIXEX wiped out a significant amount of long volatility positions.
* March 20, 2020 Opex wiped out a significant proportion of the short term put positions
* March 20, 2020 Fed Reserve announced to provide "enhanced" (i.e. unlimited) liquidity to the
markets starting Monday March 23, 2020.
* April 6th, 2020 Peak of Implied Volatility (point where options "most expensive") - which meant that buyers / sellers started providing more & more liquidity following this point.
In 2025, we have yet to see:
* Any motion towards intervention from the Fed for liquidity.
* Any motion from the significant fundamental investors (we're not close to an attractive P/S or P/E on most stocks for Buffett & Co to start buying)
* Any significant motion from companies on indicating strategies about capital raises, layoffs, or other company level liquidity reactions.
* Any "reset" of options in either volatility or hedging. Numbers below as of April 9, 2025:
- SPY 2.8M Put OI for April 17
- VIX 3.5M Call OI for April 16
Just an example but maybe IF we see those clear and NOT get re-bought for May Opex... we might be ready to call a top here at 50 VIX.
Otherwise.... we're just at another stop on the path to 100.

Foundation of Technical Trading: What Makes a Chart Tradable?The Foundation of Technical Trading
There is an abundance of information on price charts, technical methods, indicators, and various tools. However, the required first step is to understand basic market structure. Without this foundational knowledge, technical applications risk becoming inconsistent and disconnected from broader market behavior.
It is also important to question whether technical charts and tools are effective at all. What makes the market responsive to a trendline, a pattern, or an indicator? And why, at other times, do these tools seem entirely irrelevant? Is the market random? If certain events are predictable, under what conditions can such occurrences be expected?
Experiment: Random Charts
Here is an illustration of four charts; two showing real price data and two randomly generated. While some visual distortion gives away subtle differences, there are more refined methods to construct this experiment that makes telling the difference between real and random almost impossible.
All these charts show viable patterns and possible applications. When presented with these, even experienced people tend to construct narratives, whether or not structure is present. This raises a fundamental question; how can one distinguish real occurrences from coincidental formations on a chart? In case all movements are considered random, then this should indicate that applied methods perform no better than coincidence?
Bias and Distortion
It’s also important to comprehend the influence our perception. As humans we are wired to find patterns, even in random data, which can lead to various cognitive biases that distort our interpretation. For example, confirmation bias may lead us to focus only on evidence that supports our expectations, while apophenia causes us to see patterns where none exist. Similarly, hindsight bias can trick us into believing past patterns were obvious, which can develop overconfidence in future decisions. Awareness of these biases allows us to approach technical tools and charts with greater objectivity, with more focus on probabilistic methods and calculated risks.
Experiment: Random Levels
Perform the following experiment; open a chart and hide the price data. Then draw a few horizontal lines at random levels.
Then reveal the price again. You’ll notice that price can touch or reverse near these lines, as if they were relevant levels.
The same thing can happen with various indicators and tools. This experiment shows how easy it is to find confluence by chance. It also raises an important question, is your equipment and approach to the markets more reliable than random?
Market Disorder
Financial markets consist of various participants including banks, funds, traders and algorithmic systems. These participants operate with different objectives and across multiple timeframes resulting in a wide range of interpretations of market behavior. Trades are executed for various reasons such as speculation, hedging, rebalancing, liquidation or automation; directional intent could be unclear. For instance, the prior may serve to offset exposure, and portfolio rebalancing could require the execution of large orders without directional intent.
Technical and chart-based trading likely makes up a minor segment of the overall market; even within this subset, there is considerable variation in perception and interpretation. There could be differences in timeframe, reference points, pattern relevance and responses to similar information. The market is broader, more complex and less definitive than it appears. The point is that markets contain a high degree of structural disorder, which means most assumptions should be questioned and perceived as estimative.
The effect of buying and selling pressure on multiple timeframes sets the foundation for oscillation in price movements, rather than linear and monotonic movements. This pattern of rising and falling in a series of waves sets the points for where the current structure transitions between balance and imbalance. An overall equilibrium between buying and selling pressure results in consolidative price movement, whereas dominance leads to trending or progressive movement.
Volatility Distribution
To answer the main question: What differentiates real market behavior and charts from random data, and ultimately makes it tradable, is the distribution of volatility. This forms the basis for the phenomenon of volatility clustering, where periods of high volatility tend to follow high volatility, and low volatility follows low volatility. It is rare for the market to shift into a volatile state and then immediately revert to inactivity without some degree of persistence. Research supports the presence of this volatility persistence, though with the important caveat that it does not imply directional intent.
Volatility Cycles
These phases tend to occur in alternation, known as volatility cycles, which set the foundation for tradable price structures. This sequence consists of a contractive phase, marked by compression in price movements, followed by an expansive phase, characterized by increased volatility and directional movement. The alternation reflects shifts in underlying buying and selling pressure. This behavior offers a practical approach to interpret market behavior. A more detailed explanation of the concept could be explored in a future post.
Conclusion
While the idea of profitability through technical trading is often questioned, it remains a viable approach when based on sound principles. The edges available to the average trader are smaller and less frequent than commonly presumed. The concepts of volatility and the ability to locate areas of imbalance forms the basis for identifying conditions where market behavior becomes less random and more structured. This sets the foundation for developing technical edges.
The content in this post is adapted from the book The Art of Technical Trading for educational purposes.
VIX - Extreme fear in the market: a unique opportunity?Extreme fear in the market: a unique opportunity?
An analysis of the most significant
VIX spikes (1987-2025) and subsequent stock market performance.
The VIX (Volatility Index) is an indicator that reflects the level of fear or uncertainty in the market based on expectations of volatility in the S&P 500 Index.
The VIX's 118% surge from April 4 to April 7, 2025 was the fifth largest 3-day surge in market history.
This surge 🚀 reflects the high level of uncertainty that has developed in the markets.
It is very difficult to make informed investment decisions during such periods.
But we can rely on historical patterns.
After the 20 largest VIX spikes, the S&P 500 Index has consistently delivered exceptional returns:
- After 1 year: 16.5% (vs. 12% in normal periods)
- After 3 years: 45.9% (vs. 39.5% in normal periods)
- After 5 years: 83.0% (vs. 74.4% in normal periods)
The difference in returns over the 4 years is 10.2% above average.
Over the past 40 years, there has only been one negative return (the 2007 spike before the financial crisis), while most extreme fear events have become outstanding buying opportunities. For example, the August 2011 spike was followed by an impressive 117% return over the next five years.
When market panic reaches extreme levels, institutional capital typically steps in against retail sales, setting the stage for stronger long-term growth. History shows that these moments of maximum fear often represent optimal entry points for patient investors.
It is essential to realize that historical patterns do not always hold true in the future. Each crisis has unique characteristics and causes that can lead to different outcomes.
These statistics provide good mathematical expectations, not guarantees.
This has always been the case in the market, and proper handling of math expectations and risk management are the foundations of profitable strategies.
Best regards EXCAVO
_____________________
Disclosure: I am part of Trade Nation's Influencer program and receive a monthly fee for using their TradingView charts in my analysis.

VIX Clips 60 as Market Volatility and Tariff UncertaintyThe VIX Clips 60 as Market Volatility and Uncertainty Surge on Tariff Announcement
The CBOE Volatility Index (VIX), often dubbed the “fear gauge,” surged past the 60 threshold this week—the highest level since August 5, 2023—as markets reacted violently to an unexpected announcement by the U.S. President regarding global tariffs. The sharp rise in the VIX, which measures market expectations of 30-day volatility, underscores the profound uncertainty now gripping investors, with the Dow Jones Industrial Average plummeting over 1,000 points and the S&P 500 entering correction territory. The trigger? A sweeping tariff policy unveiled by the administration on Liberation Day, a symbolic holiday marking a shift in economic strategy, which has sent shockwaves through global markets.
The VIX at 60: A Sign of Extreme Fear
The VIX typically hovers around 15-20 under normal conditions, reflecting moderate uncertainty. However, readings above 30 indicate heightened anxiety, and levels above 50 are rare, historically occurring during major crises like the 2008 financial collapse or the 2020 pandemic sell-off. This week’s spike to 60 marks a dramatic escalation, signaling a market gripped by fear. Analysts attribute this to the suddenness and scale of the President’s tariff announcement, which caught investors off guard after a period of relative calm.
The Liberation Day Tariff Announcement
On Liberation Day—a holiday commemorating historical freedoms—the administration announced a 25% tariff on a broad range of imports from key trading partners, including China, the EU, and others, effective immediately. The move, framed as a “national economic security initiative,” aims to curb perceived trade imbalances and protect domestic industries. However, its immediate impact has been severe:
Scope and Speed: The tariffs apply to $500 billion in goods, targeting sectors like semiconductors, automotive parts, and consumer electronics. The abrupt implementation, with no prior warning or negotiation, has left businesses scrambling to adjust supply chains.
Political Context: The announcement coincided with domestic political tensions, including debates over inflation and job creation. The White House argued the tariffs would “level the playing field” for American workers, but critics warned of retaliation and inflationary pressures.
Market Chaos: Sectors Under Siege
The tariff shockwave rippled across asset classes:
Equities: The S&P 500 fell 2+% on Monday, its worst single-day drop since March 2020. The Nasdaq, heavily weighted in tech stocks reliant on global supply chains, plunged over 5%.
Sectors: Semiconductor firms like Intel and AMD tanked, while automakers such as Ford and Tesla declined sharply.
Expert Analysis: A Volatility Tipping Point
Historical Parallels and Economic Risks
The current volatility mirrors past crises:
2008 Financial Crisis: The VIX hit 80 as Lehman Brothers collapsed, but the current crisis stems from policy, not financial contagion.
2020 Pandemic Sell-Off: The VIX spiked to 82 as lockdowns paralyzed economies, but today’s uncertainty is self-inflicted.
However, the tariff-driven uncertainty poses unique risks:
Inflation: Higher import costs could push inflation back above 4%, complicating the Fed’s rate-cut path.
Global Growth: The World Bank warns that trade wars could shave 2% off global GDP by 2025. Emerging markets, reliant on exports, face currency crises.
Looking Ahead: Can Calm Return?
Markets may stabilize if the administration signals flexibility. Potential pathways include:
Negotiations: A G20 summit in September offers a venue for de-escalation, though diplomatic progress is uncertain.
Policy Reversal: If tariffs are delayed or narrowed, the VIX could retreat. However, the President’s rhetoric suggests a hardline stance.
Corporate Adaptation: Companies might pivot to domestic suppliers, but such shifts take years, prolonging volatility.
Conclusion: A New Era of Uncertainty
The VIX at 60 marks a pivotal moment. Markets are now pricing in not just the immediate tariff impact but a broader shift toward protectionism and policy-driven instability. For investors, the path forward is fraught with uncertainty. While short-term volatility may ebb with reassurances, the long-term consequences—trade wars, inflation, and geopolitical friction—could redefine global economics for years.
With Liberation Day’s tariffs reshaping the landscape, one thing is clear: the era of low volatility is over. The question now is whether policymakers can navigate this new turbulence—or if markets will remain hostages to fear.

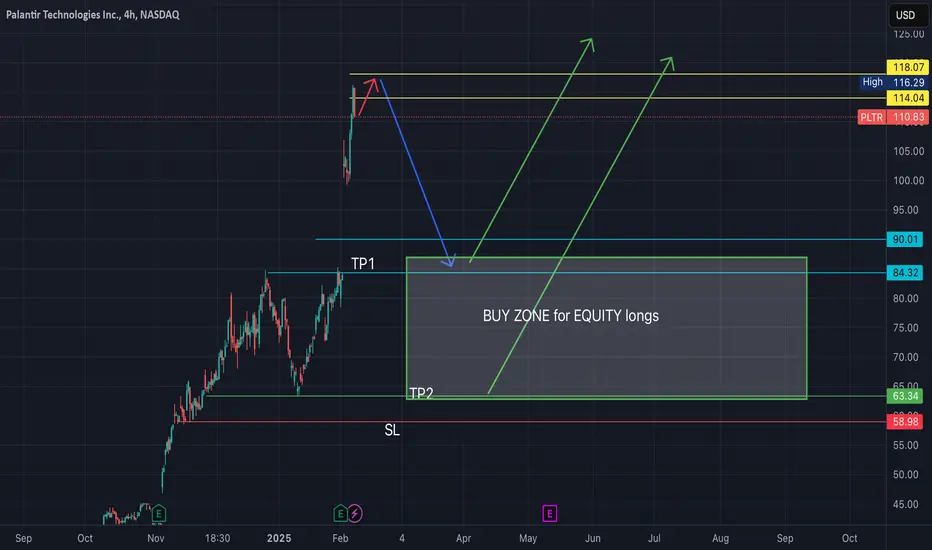
PLTR -- more volatility forecasted into MarchExpecting quick progression to 118$ level as final buy-side wave near term.
Looking for renewed significant selling action from that level to retrace price back to pre-earnings levels near 80-85$
Possibility exists (imho) that we fully retrace back to 63-64$ levels by April timeframe, depending on sentiment as we head into next FOMC meeting in mid-March.
After that, my cycles analysis indicates we will continue higher toward 120...Therefore, I will be planning on taking profits on put option contracts once underlying share price reaches below 85$, and will plan on scaling into long equity positions on discounts between 64-85$ for the projected subsequent buy wave to 120+
NASDAQ 100 (NAS100USD): Assessing the Potential BreakoutOver the past few months, the NASDAQ 100 (NAS100USD) has demonstrated a clear upward trajectory, marked by higher highs and higher lows—a classic sign of sustained bullish sentiment. However, we've seen periods of consolidation and recent volatility - let's take a look at its current technical landscape.
Current Market Overview:
As of January 29, 2025, the NASDAQ 100 is trading at approximately 21,600, a level that has served as a significant pivot point in recent trading sessions. A decisive move above this threshold could validate the ongoing uptrend and open the door to further gains.
Key Levels to Monitor:
Immediate Resistance : The 21,600 level is crucial. A sustained break above this point could signal the continuation of the bullish trend.
Support Levels : Should the price retreat, the 21,300 - 21,200 are notable support areas to watch.
Recent Developments:
The market has recently experienced heightened volatility, notably a sharp dip around January 27, followed by an aggressive recovery. This shows how unpredictable the market can be and hints at continued bullish movement.
Strategic Considerations:
Breakout Confirmation : A sustained move above 21,600, ideally accompanied by increased trading volume, would provide stronger confirmation of the breakout.
Support Retest : If the price successfully breaches the 21,600 resistance, this level could transform into a support zone. A subsequent retest of this level as support could present a compelling entry opportunity for long positions.
However , considering the Fed decision and fundamental factors around todays announcement - the most likely scenario would be slightly hawkish or a hawkish pause , which would be somewhat negative for the index. This would allow price to experience a temporary drop back down to the previous support (demand) level of 21,200 before buyers re-engage.
Trading Strategies:
Long Positions on Breakout Confirmation : A clear break and close above 21,600 could signal a long (buy) entry.
Long Positions on Retest of Support : A pullback to the 21,200 support level (assuming it holds) could offer a better opportunity to enter long positions.
Disclaimer:
This analysis is for informational purposes only and should not be considered financial advice. Trading involves significant risk, and it's essential to conduct your own thorough research and analysis before making any investment decisions. Past performance is not indicative of future results. Always use appropriate risk management techniques and trade responsibly. OANDA:NAS100USD IG:NASDAQ PEPPERSTONE:NAS100

VIX Will GO DOWN|SHORT|
✅VIX is trading in a local
Downtrend and we are now
Seeing a bearish breakout
Of the rising support line
So we will be expecting a
Further bearish move down
SHORT🔥
✅Like and subscribe to never miss a new idea!✅

Gold pullback to 2625-2640 zone. Feels like its going up today.
If I got pre-emptive about an hour ago calling for Long-gold at 2655 or thereabouts, if that got you a stop out then my sincerest feeling for you and I would like to make it up to you.
I have to literally pinch myself every time I take a trade here in currency or patricuarlly gold, becaues volume is reduced until London opens for business.
Anyway I will be looking to perform a Long trade here a bit later, but with 1 trade already down and that position I put a Stop-on and I exited the trade at 0.5194 I think it was.
Another chart here the 4HR. Gold has now made a fairly deep and up and down move since Thursday, causing just the right about of volatility and momentum to fire-up a deep 4hr reversal trade. These work on depth, generally the deeper the better to get that spring back through 30 on the RSI and 20 on Stochastic's, both are great, standard settings. To confirm that the long trade is the real deal I will be looking for a big spike in volume, increaasing more than 50 momentum on Rsi and/or 20 on Stochastics'.
But the best way to pul the trigger on a deep RSI reversal trade is to do all of the above monitoring good increases in momentum and volume, watch only as it passed above 30 / 20 on the Oscillators and on a lowertimeframe I suggest a 3 minute chart setup an EMA 9 and EMA 50 and BUY GOLD when the 9EMA bullishly crosses up and over the 50. Higher the time frame the stronger this Cross becomes but its the lower time frames where all of the action begins. The most accurate winning strategy for this type of trade would be on the daily but its a bit early for that big TF.
Buy the pullback in Gold. Watch for LIVE divergence on the 4HR for things like price bottoming and in the volatility is on the up and up in oscillators like RSI/STOCH/MACHd.
SL under a swing low on a 5 min timeframe.
TP 2680 is the final target. Take partial profits at the tops of zones.

TotalCrypto Market Pullback: What's Next for the Bull Run?Hello, crypto enthusiasts!
How are you today? I hope you're doing well and not letting this price action ruin your day. Times like these can be tough if you're unprepared or trading with emotions instead of following a proper plan or system.
This chart represents the **Total Market Cap** of cryptocurrencies, and as we can clearly see, it's heading down. Today marks the second consecutive day of downside price action, accompanied by increased volume.
Yesterday was the ideal exit point for the long trade that started after the U.S. elections. The signal was simple: **price pierced the PSAR**, indicating that the trade should be closed. While this index doesn’t represent an actual tradable position, it reflects the system's logic. Since this index aggregates the price action of all crypto assets, its decline suggests that most crypto assets are also experiencing downside pressure. While exceptions exist, this is the general trend.
Technical Analysis with Oscillators
- **RSI**: The Relative Strength Index has dropped from overbought levels (above 70) and is now at **~52**, signaling weakening bullish momentum. This suggests a potential continuation of the downtrend.
- **MACD**: The MACD line is trending down and crossing below the signal line, which indicates bearish momentum. This crossover often signals a further downside.
- **OBV**: The On-Balance Volume is showing a decline, confirming that selling pressure is dominating the market, supporting the bearish move.
What’s next?
- **First Target**: The 2021 top, marked by the black line, where we may see a reaction.
- **Second Target**: The **0.236 Fibonacci retracement level**, which provides another possible support area.
Of course, nothing is ever certain in trading. Tomorrow, the market could rally and ignore all current signals, but for now, the price appears to be trending downward.
A few reminders:
- In crypto, things rarely go the way we want.
- Stay prepared for every scenario and keep your portfolio ready to re-enter the market.
- Avoid letting hope and fear dictate your decisions—they won’t lead to profit.
I'll keep monitoring the markets and share my thoughts as they develop.
If you found this analysis useful, feel free to like, share, or comment below. And as always: **stay safe and keep calm!**

#NIfty50 Outlook for upcoming week 9-13th Dec, Nifty Rallies, Bu
The Nifty 50 index concluded the week on a high note, closing at 24,677, a significant 550-point surge from the previous week. The index oscillated wildly, touching a high of 24,857 and a low of 24,008. As predicted, the index faced selling pressure around the 25,000 level, a critical resistance zone that triggered a downward trend in late October.
For the upcoming week, the Nifty is expected to trade within a range of 24,100 to 25,000. A sustained break above 25,000 could propel the index towards 25,250. However, a pullback to retest support levels is likely before the next upward move.
Meanwhile, the S&P 500 index gained 1% to close at 6,090. Key resistance levels for the S&P 500 are 6,142 and 6,225, while support levels are 6,013 and 5,963.let's see if US market this week also support world market or not.

MCHP Long Setup: Oversold Rebound w/ Rising Volatility & VolumeMicrochip Technology (MCHP) is presenting a promising long opportunity for a temporary rebound, supported by three strong technical factors:
Slow Stochastic in Extreme Oversold Territory : The indicator is below 20, signaling excessive selling pressure, often linked to potential short-term recoveries.
Rising Volatility Index (LSVI) : The significant increase in volatility suggests the market is entering a phase of larger price movements, increasing the probability of a sharper rebound.
Increasing Volume with Reduced Decline: Recent candles show higher trading volume accompanied by a slowing rate of decline, indicating potential buyer activity and a technical correction from the recent sharp drop.
With the price near a critical support zone and a target identified at $65.00 (10% gain), this setup offers a compelling risk-reward ratio for short-term traders. If the price crosses above the red line, it may reach $71.00 (20% gain).
Watching for confirmations such as a %K/%D crossover on the Slow Stoch and sustained buying volume will be key to validating this thesis.
Disclaimer : Always manage risk carefully, particularly in high-volatility environments.
