Q for the community. Is the ATR valuable based against volume?I have to say that one of the most confusing indicators for me is the ATR indicator. it has the tolerance to move up or down which will tell you that you are gaining volatility or losing volatility. when you are gaining volatility above a certain amount on an asset is when it's a good time to trade. but there's nothing that tells us exactly when is that certain amount. also the gain above that unspecified amount changes between different assets and pairs that you trade.
another thing that discerns me from using the ATR Is that it's movement is related to price movement. well unfortunately we know that in the markets price can be manipulated which manipulates momentum. but the one thing it cannot be manipulated is volume.
so in today's video I'm asking a question to the community which is what happens for you guys as a benefit when the ATR is based against volume and calculated against the movement of volume.
also in today's video I show you guys how I have figured out a way for the ATR to tell you that you are just broken above the average volatility or just broken below the average volatility.
just because you are above average volatility doesn't mean you are still in a good trading area. just because you've broken above average volatility doesn't mean you can enter into a trade immediately. you also and always need extra confluences so with that being said I added this break of the average to the upside or downside into the bull bear power void and I created a method for the oscillator to spit out a simple pair of colors which you can change on your own that tell you you have just entered above average or below average volatility and as such you can start looking for your move or your exit.
so my question to the community is how relevant is volatility against volume in your indicators and trading strategies. also I'd like this to have a better layout or way of signifying you that you have broken above or below average volatility.
leave your ideas in the comments below.
Volatilty

VIX Is Ready To PartyThe VIX looks like its ready to party ahead of today's CPI print.
It recently touched the upward moving monthly trendline and my guess is it moves into the mid to upper twenties short term.

Bitcoin Historical Volatility new low Here we have the BTC historical Volatility Index in blue. Orange is the price of BTC. The teal line is the 50sma for volatility. At the bottom, I have the correlation coefficient (CC) for the volatility index with BTC. I have marked in green when the CC reaches above 0.50, and red when it crosses below -0.50. The fibonacci retracement is fairly arbitrary, but fits nicely between 0.25 and 1.00. In this article, I would like to discuss a little bit about volatility. It is often associated as going up when price goes down, but is a bit more specific in what it is telling us than simply being an inverse price indicator. Next, I’ll talk about the correlation coefficient. It is an excellent tool that every trader, and investor, should learn to use. Finally, I would like to examine some of the similarities between our recent all time low in this index, breaking the low 2018, which proceeded the infamous 2018 capitulation event.
Volatility is always an interesting indicator, and is often used to indicate position risk for the asset it is being calculated for. Simply stated, it is a measure of how much the price of an asset moves in a particular period of time. However, it can be calculated a number of different ways. The most common is standard deviation, or how far price is from an average of the price over a recent period of time. The amount of time the data is taken from can also change how the volatility measure acts and how useful it is. More so, because it measures movement, and not so much direction, it can be difficult to use it in an accurate way, as correlation appears to be inconstant at face value. Historical volatility is calculated a little differently. And honestly, before reading a few papers on it for this essay, I had not realized that ‘historical’ referenced the calculation method as opposed to it being the history of the volatility. Historical, or realized, volatility is an estimation of the standard deviation of the price of returns over a particular period of time, in this case, 24 hours. It can also be calculated with a weighting for the trading volume over the calculation period. I have placed a 50ma (150 day moving average) to show a general range for average volatility, and we can see that MA tends to oscillate between 2.5 and 5.0.
The correlation coefficient is an excellent indicator that allows you to see, and quantify, the correlation of your current chart with any other chart ticker. Here I have it set to the BLX all time price index for BTC. The higher it goes, the more correlated the movement of the 2 charts are, and below zero indicates an inverse correlation. When CC is near zero, the movements of the two charts are NOT correlated. One of the issues with volatility indexes is their accuracy can vary, and is sometime disputed. My goal in using the correlation coefficient with this index is to parse out when volatility is most useful to pay attention to, and in which direction. On this chart, we can see that when volatility spikes above 10, it is often correlated with big, sudden moves to the downside. However, not all of them are. By using the correlation coefficient, we can parse out the direction of volatility. When CC is in the green, and volatility increases, we see the price of bitcoin moving up, usually in an explosive manner. Likewise, inverse correlation is often showing us downwards movements. I find this a useful way to pull a little bit of the noise out of the volatility index.
The previous all time low in volatility of 0.35 occurred on October 28th of 2018, and about sixteen days before the 2018 capitulation event began. About a week ago on Christmas day, we broke that low, going down to 0.34. Very low volatility tells us that price isn’t just moving sideways, but is pretty flat for the most part. And if you have been following bitcoin lately (bless your soul) you know flat and boring is kind of an understatement. The good news is that it’s likely going to get exciting soon. Volatility doesn’t seem to stay at or below 1.0 for very long, and seems to be either correlated, or inversely correlated with price within a few weeks to a month after reaching 1.0. An exception would be from August of 2019 to the pandemic crash in 2020. We can see some similarities in both volatility and the correlation coefficient between the time leading up to the 2018 capitulation event and our recent data in 2022. Price action is also fairly similar (flat and boring) with the exception that in 2018, the line chart had a small move down and back up during the flatness, while we had a small move up and then down earlier in December. Although, I doubt this really means anything. In 2018, we saw a 50% drop after price had already fallen around 70%. From top to bottom, the draw-down was just under 85%. Another 50% draw-down from where we are at the time of writing would take the price of bitcoin to just over $8,000.
So what does this mean? Well, I can tell you, for sure, 100%, that I can not tell the future. I will be, however, watching my new chart very closely. But I would say it is likely we’ll be seeing something exciting, and it will probably be in January. Unfortunately, it looks like CC moves down just as fast as price, and as fast as volatility moves up during sudden, capitulation like events. However, Bitcoin always has a way of surprising everyone. If CC moves down to 0, and then puts in another local high in the next week, I would be a little spooked. If it keeps moving up to 0.50, it may be an interesting and unexpected move to the upside. Regardless of what happens, I would encourage everyone to try to understand volatility a little better than you already do, and use the correlation coefficient indicator. It is a simple, yet versatile tool that can be used to quantify data in a way that makes a trading strategy precise. Here’s to 2023, I wish you well, and thanks for reading.

There Is No VIX "Suppression Program"VIX at the weekly view.
I didn't have time to write this last week due to a hectic schedule. Better late than never, I guess.
The VIX broke the weekly resistance and bounced from the pivot zone (white line). A smaller VIX spike is in progress. No, I am not expecting above 40 at all. Maybe mid-30s at the higher end. It would be nice if I am wrong so more opportunities can arise... With the relatively big contango going on between VIX and VX, you would need extreme, precise timing in VX long entries and exits... I don't like babysitting trades at all - where there is no margin for error. I prefer trades were I am allowed to have plenty of margin for error (easier trades).
It seems that my red line still lives on which I am very surprised. It should expire in the next quarter... but it's hard to pinpoint. Even then, cash (or cash equivalents) is still still king. Why is that important?
The biggest VIX spikes were driven due to 1 particular reason: excessive demand for hedges in SPX/ES options. There is no "suppression" program as conspiracy theorists claim on social media. There is no mysterious group (often called "they") that magically pull levers to control all markets. That type of thinking is a losing mentality. That mentality means the person lost a lot and wants to blame someone else other than himself/herself. It's like a grown adult blaming all their problems on their parents. It's a very unhealthy coping mechanism.
As stated before, there are 3 reasons why the VIX won't spike hard despite big red days in the SPX or ES.
1) When short-term bond yields are high and in an uptrend (bond prices in a downtrend), cash becomes king (not trash). So, when positions are being sold, the money is then flowed into cash equivalents like treasury bonds and securities. That means there is less money going to hedges. VIX doesn't get a big spike if there less demand for hedges.
2) When the bonds are sinking (yields rising), there is also sector rotation from growth to cyclical stocks. More specifically, dividend value stocks become more attractive. That just means money is just rotating among sectors within the SPX/ES. There are little hedges being bought during this rotation... as it's just trading shares for shares.
3) Hedges were meant to protect gains in investments. If the investment is at a loss, then there is no need for a hedge since that would unnecessarily tie up more capital. When cash is king, it makes more sense just to sell for tax-loss harvesting (to offset gains for tax purposes) than to add more stress with hedges. Imagine if you had $1 million in gains this year and you then owe over $400,000 in taxes. Most likely, you would worry about how to lower your tax liability. Tax-loss harvesting is a common method. Hedges were meant to protect gains so the investments would reach the long-term capital gains tax rate (which is significantly lower).
It is NOT an inverse index nor some sort of fear index (which the media loves to label it as). Normally, if I see something who treats it that way, it's a red flag that they never bothered studying the VIX and VX. The VIX loves to punish anyone who is impatient or anyone didn't bother to understand its mechanics.
Imagine the VIX like piloting a commercial or transport plane. If you don't understand the flight control systems thoroughly, you will likely crash the plane.

How to recognize a trend changeIn this video I cover how to recognize a trend change with and with out indicators.
Enjoy!

Large volumes appeared. I expect a rebound from the support leveThe price has been in a downward movement for a long time. Large volumes appeared. Got a reaction from the level. An oblique level in the resistance was formed. I expect a rebound from the support and movement towards the boundaries of the inclined level. Goal - 0.477$

The sellers are very active and red delta keeps growingWaiting for the upcoming breakout of the strong local support level. The sellers are very active and red delta keeps growing. Be aware of liquidity grabs. Target - 10.0

Long Volatility into AugustBy now you all know the drill. Let's start with an initial framework, assess the current environment, and evaluate all below questions.
are we trending or ranging?
- a series of higher highs, higher lows
- sellers structure is broken, we are tracking whether buyers will protect or find it difficult to hold
discount?
- we are tracking the lows for the previous wave block
- Support 20, Pivot 25, Resistance 38
managing trade?
- Trading and assess based on quarters, 00, 25, 50, 75
- Market participation in form of current strength/weakness, when market is weak we are sellers and when strong we are buyers
This position, technically speaking, is very similar to the swing we traded in 2020. Buyers have developed a structure of higher highs, and higher lows, and desire their chance to go over to a direct attack on the highs.
In this case the result is not certain; but since attacking in this fashion is characteristic of a volatility event. There are two lines, assuming the 20 support holds. In the first case, as well we need to track 25, the combinatory breakout of 25 will allow buyers to continue their summer dance with a romantic hue, unlocking 38 for August.


VIX - Volatility is skyrocketingIn early August 2022, we warned that volatility would creep back into the market. Not long enough after that, the market started to sell off, and VIX skyrocketed from 20 USD to over 27 USD. Therefore, we stick to our short-term price target of 30 USD for VIX. However, we want to set a new medium-term price target at 35 USD.
Illustration 1.01
The chart shows a bullish breakout above the resistance and two opening gaps on VIX. All of these developments are immensely bullish for VIX.
Please feel free to express your ideas and thoughts in the comment section.
DISCLAIMER: This analysis is not intended to encourage any buying or selling of any particular securities. Furthermore, it should not be a basis for taking any trade action by an individual investor. Therefore, your own due diligence is highly advised before entering a trade.

BTC forecastBTC is currently sitting at 40%ish of its all time high. While still below its overall price median, opportunities for it being undersold look good. Price is still climbing steadily though so reasonable soon, it will be considered overbought .
Its 200 period daily moving averaging is still trending downward, while the 1 and 4 hour moving averages trend upward. This represents a short-term positive outlook where good quick profits could be gained. This is further supported by the very slow upward trend of the weekly moving averages.
Caution should be excercised as it approaches its median price. Statistical probablity suggests price reversion will be come more likely the higher the price goes above the median.
Considering the depth of the correction since the start of the downtrend from November 14th, 2021 onward, price is recovering relatively well, yet not too aggressively. A non-aggrewssive recovery really is a good sign for the market and a positive pulse of future growth potential.
A strategy reasonably aggressive, yet properly balanced with defense, could bring some very good results.

Factors currently influencing the CHF and opportunitiesThe Swiss Franc has seen some crazy moves since April.
In the last quarter, we saw the CHF weaken on the onset of the Russian invasion. Then the SNB raised rates by whooping 50 bps for the first time in years. This led the Swiss government bond yields to spike with USDCHF weakened in days.
Since then, speculators have pulled back rate hike bets in the face of an economic growth slowdown in Europe. with the Swiss 2 year bond yields back below 0%.
So what does this mean for Swiss Franc crosses?
USDCHF
I expect the currency to weaken against the USD as traders bet that the Fed will maintain their tightening policy until inflation is below their 2% target.
AUDCHF
The RBA is also on a tightening cycle with the RBA expected to hike rates further to the end of 2022. In addition to this, the Australian economy seems to be resilient with data coming out of the country being strong. China's PBOC and CCP support for the economy is expected to provide support for the Aussie.
CADCHF
The oil linked Loonie is having support from higher energy prices and a BoC that is also on a rate hiking cycle.
Technically speaking, the pair has gone back above the 100Day moving average and I expect it to test the cluster resistance level 0.769xx from 2014-2019
Other pairs that are interesting are:
CHFJPY
Major risk to short-selling the pair is that bond yield differentials are expected to remain high hence JPY strength looks like a long shot for Q3
NZDJPY
Recovery of the Chinese economy is going to support the commodity-linked Kiwi. However, strength of the pair is not expected to be higher than that of the AUDCHF
Summary
CHF weakness brings a lot of opportunities. However, it's important to note that tailrisk to these trades exist. In the current environment, FX volatility is high and could wipe you out. Be safe out there

SKEW IndexDespite numerous mentions about the CBOE SKEW Index, we are no where near the 2018/2019 lows (which are the lowest readings on file for the past decade).
Understanding how SKEW Index works, it's relationship to Vol Structures, and impact towards Gamma & Vega and how/what it implies by way of Institutional Hedging is another tool for the pros.
Do your DD (due diligence) before reading someone's tweet, getting the reddit cliff notes version, and then deploying your personal capital...the markets are not easy, and complex relationships take time to understand all aspects and angles. MMs want you to believe everything is linear, but they just aren't!

Two Scenario for Recession playing out into biggest EXP.Two Scenario for Recession playing out into biggest EXP of options 14 of June.

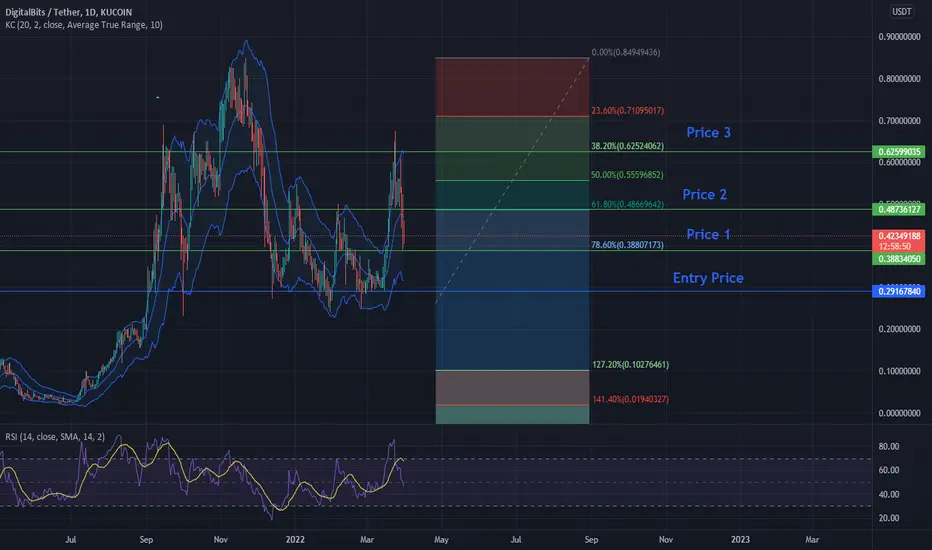
Swing Trade - Use the volatility to your advantageThe cryptomarket is historically volatile and by using this volatility to our advantage in trading are we able to make big gains.
Entry Price: 0.291
Price 1: 0.388
Price 2: 0.487
Price 3: 0.625
The price is expected to drop further and reach the price level of 0.256, at this level is the price expected to bounce following the low of the KC.
This prediction is made through studying the price movement in the past which has given us higher high which combined with the RSI having speed downwards and the volatility given in the chart would this price bounce be likely to happen.
No Financial advice. Education purpose.
How Can Volatility Indicators Improve My Trading Understand the ebbs and flow of volatility can help trading your trading by improving your entries and exits of a trade thanks to these types of indicators you can have a better grasp of what's going on with price

VIX Short-Term and Long-Term Buy Setups 🎥Hello everyone, if you like the idea, do not forget to support with a like and follow.
Here is the top-down analysis for VIX, feel free to request any pair/instrument or ask any questions in the comment section below.
Best of luck!

What Are You Going To Do Now, VIX? 8/10/2020VIX at the 4 hour view.
The VIX did something a little unusual. The VIX poked below tier II support below, but closed right above tier II support (second dotted green line). In addition, the VVIX closed right above 110. The VIX refuses to give up since the Put/Call Ratio was around 0.66 today. Normally, below 0.75 is considered extreme on the buy side. However, we are living in abnormal times now. This means the VIX recognizes the Put/Call Ratio as a possibly buy climax and exhausting the supply of buyers. So, the VIX acts as both a fear AND greed gauge. You just have to interpret it. You can tell if it's greed when the VIX increases while the ES increases as well.
I found out why on the ES. To my ES post, the ES has been in an ascending wedge for several days now. The lower intraday range is what's lowering the VIX. In addition, high liquidity is also pinning the VIX down since the ES refuses to have a decent pullback.
Interestingly, the ascending wedge on the ES should be resolved either tonight or tomorrow. I had a date range for the volatility jump on the VIX between 8/10 to 8/12. I don't think this is a coincidence at all.
The ES is primed for a correction. However, high liquidity levels on the MCI and NFCI indicate that the correction will be delayed until liquidity levels finally reach weakened levels. That doesn't happen overnight. That usually takes weeks, possibly months to get there. I would not hold my breath for it.
What does that mean for the VIX this week? If the ES pulls back immediately and not do a blow off top pattern, then the measured move of the pullback would be about 80-90 points. Due to high liquidity levels, volatility jumps (more like a hop) would only last 1-2 days. I'm not expecting a "bigger" volatility jump until the ES reaches the previous all-time highs. Why? Bears are looking for a double top pattern. But again, I am not expecting a crash. The trend will be over all up until liquidity levels actually reach weak levels.
What will it take for liquidity to lower faster? Please see my ES post earlier.


VIX Long PositionAs I see a big gain in the vix soon, above 75s to 150s I longed it from
17.03
Target: 75s to 150s
SL: 10s

Crypto Market Update : Complicated area to deal with !Hope this idea will inspire some of you !
Don't forget to hit the like/follow button if you feel like this post deserves it ;)
That's the best way to support me and help pushing this content to other users.
Kindly,
Phil

VIX vs VVIX : Dangerous decorellation and trade opportunityHope this idea will inspire some of you !
Don't forget to hit the like/follow button if you feel like this post deserves it ;)
That's the best way to support me and help pushing this content to other users.
Kindly,
Phil

EWZ - BrazilSelling some high IV here with Brazil's elections.
-1 30/38 strangle in Nov cycle for $2.50 cr.
