VOLTAS In breakoutNSE:VOLTAS in breakout. As it approaches the key level of 1390, I recommend buying once it decisively crosses that threshold. With bullish momentum building, we can set our sights on the first target at 1480 and an ambitious second target at 1565!
Remember, investing requires careful analysis and risk management. Stay informed, and let’s navigate this market together! What are your thoughts? Are you eyeing VOLTAS or any other stocks for potential growth? Let’s discuss in the comments below! 💬💰 #StockMarket #InvestmentStrategy #VOLTAS #BreakoutTrading
Voltasanalysis

VOLTAS in BreakoutNSE:VOLTAS in Breakout! Falling trendline breakout in Prices and RSI indicate Positive. Target would be 1350

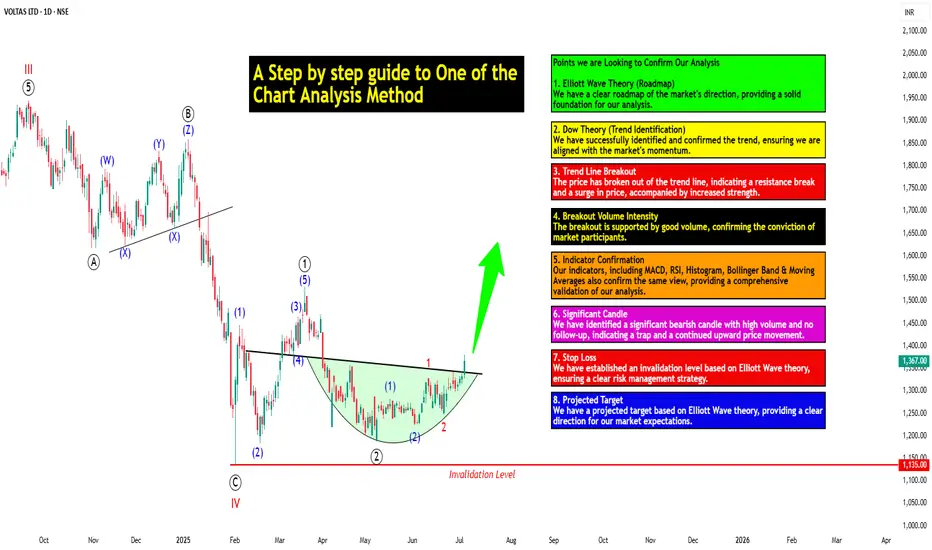
A Step-by-step Guide to One of the Chart Analysis Method: VOLTASHello Friends,
Welcome to RK_Chaarts,
Today we're going to learn step-by-step guide to one of the chart analysis Method by analyzing a chart of " VOLTAS LTD. " to identify a trend change opportunity.(Educational Post).
Let's get started!
Applying Elliott Wave Theory
According to Elliott Wave theory, we can see that the high of September 20, 2024, marked the end of the wave III of the cycle degree in Red. After that, a corrective wave unfolded, which reached its low on February 1, 2025. This was the wave IV of the cycle degree in Red, with a low of 1135.
The approximately 6 months correction ended here, and now the wave V of the cycle degree in Red has begun. Within this, there will be five sub-divisions of primary degree in black, which we can label as waves ((1)) to ((5)). Of these, waves ((1)) and ((2)) are complete, and we are possibly now in wave ((3)) of the Primary degree in Black.
Within wave ((3)), there will be five sub-divisions of intermediate degree in blue, of which waves (1) and (2) are complete, and the (3)rd intermediate degree in Blue is underway. Within this, there will be five sub-divisions waves of minor degree in red, of which 1 and 2 are complete, and today we saw the breakout of the 3 of the (3).
Possibly, this is a momentum move according to Elliott Wave theory, which we can call the third of the third of the third.
Now that we have this low of wave IV at ₹1135, it should not go below this level according to Elliott Wave theory. If it does, our current wave count will be invalidated. That's why we have an invalidation level within Elliott Wave, which according to this chart is at ₹1135. This low should not be breached. If it is breached for any reason, we'll have to re-analyze our entire count, and the counts could be different.
However, if this low holds, then the minimum target for wave V, based on the projection of wave theory, would be at least 100% to 123% of the fall from top III to bottom IV, which could take it to around ₹2000 to ₹2100. Shown in chart image below
Possible Elliott Wave Counts on Daily Time Frame Along with Invalidation level & Target levels.
Dow Theory Suggests now Up Trend
After forming the top of wave III, we can see that the price has moved downwards in a pattern of lower highs and lower lows. However, after completing the bottom of wave IV, the price has started forming a pattern of higher highs and higher lows, indicating that an uptrend has begun.
This is a clear signal that supports our wave counts moving upwards, i.e., towards an impulse move, based on Dow theory. The successful completion of wave IV and the initiation of the higher highs and higher lows pattern suggest a strong bullish trend, and we can expect the price to continue moving upwards. Shown in chart image below
Breakout with good intensity of Volumes
In this chart, we've observed a rounding bottom type chart pattern, and today, we've seen a breakout above the upper resistance trend line. Today's candle volume is also significantly higher than the average. Shown in chart images below
Chart Pattern: Rounding Bottom
Resistance Trendline Breakout with Good Intensity of Volumes
Supporting Indicators & Moving Averages
Also we can see that the current price has closed above the 50-day EMA and 100-day EMA. Additionally, indicators like RSI is above 60 and showing momentum, MACD is positive and above the zero line, and the histogram is also showing a breakout. Shown in chart images below
Breakout above 50DEMA & 100DEMA
RSI Breakout above 60+ on Daily Time Frame
Bullish side Breakout in Histogram on Daily Time Frame
MACD running Positive & above zero line on Daily Time Frame
Bollinger Band on Weekly
If we look at the weekly time frame, the current week's candle is above the middle Bollinger Band, indicating that the price is above the 20-period simple moving average on the weekly time frame. which is very good sign. Shown in chart image below
Price Trading above 20 SMA on Weekly Time Frame (Mid.Bollinger Band)
Significant Observation in Price Action & Volumes
Before the breakout, the rounding bottom chart pattern that was forming at the bottom can be interpreted as accumulation, as a red bearish candle with high volume appeared, marking the highest volume. Notably, no candle has closed below the low of that candle since then.
Although a gap-down candle occurred, it opened and closed bullish, indicating no selling pressure below that level. The absence of bearish follow-up and the subsequent breakout today are significant observations, combining price action and volume. This is a positive sign suggesting the price may move upwards. Shown in chart image below
This is how chart analysis is done for investment purposes. We've seen many signs in our favor, and yet we still use a stop loss to prevent significant losses in case the stock or market moves unexpectedly. This is what stop loss is all about - minimizing potential losses.
We've also discussed the target projection based on Wave theory, 123.6% level, which we explained through an image. So, friends, I hope you've understood the entire conclusion and learned how to analyze charts using different methods, one of which we shared with you today.
I am not Sebi registered analyst.
My studies are for educational purpose only.
Please Consult your financial advisor before trading or investing.
I am not responsible for any kinds of your profits and your losses.
Most investors treat trading as a hobby because they have a full-time job doing something else.
However, If you treat trading like a business, it will pay you like a business.
If you treat like a hobby, hobbies don't pay, they cost you...!
Hope this post is helpful to community
Thanks
RK💕
Disclaimer and Risk Warning.
The analysis and discussion provided on in.tradingview.com/u/RK_Chaarts/ is intended for educational purposes only and should not be relied upon for trading decisions. RK_Chaarts is not an investment adviser and the information provided here should not be taken as professional investment advice. Before buying or selling any investments, securities, or precious metals, it is recommended that you conduct your own due diligence. RK_Chaarts does not share in your profits and will not take responsibility for any losses you may incur. So Please Consult your financial advisor before trading or investing.
VOLTAS AnalysisThe chart provided is of VOLTAS LTD on a weekly time frame (1W) from TradingView, showing various price levels and targets based on Fibonacci retracement levels and projections. Here's a detailed analysis and summary:
Key Components:
1. Price Levels:
- Current price: 1,490.75
- High: 1,559.85
- Low: 1,481.95
- Close: 1,490.75
2. Fibonacci Retracement Levels:
- 0.618: 1,312.35
- 0.5: 1,205.05
- 0: 750.20
3. Target Levels:
- Target 1: 1,659.85
- Target 2: 2,222.05 (1.618 Fibonacci extension)
4. Significant Support and Resistance:
- Historical support around 750.20
- Significant resistance at the high around 1,559.85
- Perfect retracement noted historically, which acted as a support level.
Analysis:
- The stock has experienced a strong uptrend from the retracement level of 750.20 to its current level.
- The recent price action has breached the Fibonacci retracement levels of 0.5 and 0.618, indicating a bullish momentum.
- The first target is set at 1,659.85 , suggesting a potential continuation of the uptrend.
- The second target, based on the 1.618 Fibonacci extension, is projected at 2,222.05 .
Summary:
The chart for VOLTAS LTD indicates a strong bullish trend with potential upside targets at 1,659.85 and 2,222.05 . The stock has already surpassed key Fibonacci retracement levels, reinforcing the bullish outlook. The significant support level at 750.20 and historical retracement patterns provide a solid foundation for the current uptrend.
The price movement suggests that if the current resistance around 1,559.85 is decisively broken, the stock could aim for the targets mentioned above.

Voltas Ltd (VOLTAS) AnalysisThe chart provided is of Voltas Ltd (VOLTAS) listed on the National Stock Exchange (NSE) of India, on a weekly timeframe. Here’s a detailed analysis and summary:
1. Trend Analysis:
- The stock was in a consolidation phase from mid-2021 to early 2023, trading in a range between approximately 1000 and 1300.
- Recently, the stock has shown strong bullish momentum, breaking out of this range and moving upwards.
2. Support and Resistance Levels:
- Support:
- Major support around 1327.60 and 1251.05.
- Resistance/Targets:
- Target 1: 1540.70 (61.8% Fibonacci retracement level)
- Target 2: 1721.55 (100% Fibonacci extension level)
- Target 3: 2012.15 (161.8% Fibonacci extension level)
3. Breakout:
- The stock has broken above the resistance level around 1327.60, indicating a potential bullish trend continuation.
- The breakout is accompanied by strong bullish candles, confirming the move.
4. Chart Patterns:
- There was a long consolidation period that formed a base, and the recent breakout suggests the beginning of a new uptrend.
- The stock appears to be forming higher highs and higher lows, a characteristic of an uptrend.
5. Fibonacci Retracement and Extension Levels:
- The chart shows Fibonacci retracement and extension levels, which provide potential target areas based on the recent price action.
- The 61.8% retracement level at 1540.70 is a key resistance level to watch.
- The 100% and 161.8% extension levels at 1721.55 and 2012.15, respectively, are further targets in case the bullish momentum continues.
6. Current Price Action:
- The current price is 1451.50, which is just above a key resistance level at 1485.85 (50% Fibonacci retracement level).
- The stock showed a strong weekly gain of 6.75%, indicating strong bullish sentiment.
Summary:
The chart of Voltas Ltd (VOLTAS) indicates a strong bullish breakout from a long consolidation phase, with the current price at 1451.50. Key support levels are at 1327.60 and 1251.05, while key resistance levels and targets are at 1540.70, 1721.55, and 2012.15. The recent breakout and strong bullish candles suggest the potential for further upside, with Fibonacci levels providing clear targets for future price action. The stock is currently showing strong bullish momentum, with higher highs and higher lows indicating an uptrend.

VOLTAS SHOW THE POWER OF TATA PRODUCT Last 4 year study of that share multiple range + flag + channel breakout and breakdown 3 year drama.Now that came on FIBONACCI .5 retracement point take two down side channel ready to take reversal and revenge of investors loss. Voltas price now near by 800 TRG 920/980/1080/1200/1400 that is trg based on quarterly / half yearly and year bases target
depend upon client investment and risk capacity and holding capacity you can adjust your TRG

Voltas - Elliott Wave CountVoltas - Elliott Wave Count
It appears that the market correction for Voltas has come to an end, and we can anticipate another upward impulse wave, provided that today's low remains stable. Anyone who opened a short position based on our previous view should consider closing it. However, if the market falls below the current low, the previously mentioned view will no longer be applicable.
Please note that this information is for educational purposes only, and it is crucial to trade with caution.
NSE:VOLTAS NSE:VOLTAS1! BSE:VOLTAS

Voltas - Elliott Wave CountVoltas - Elliott Wave Count
Voltas - The market appears to be in correction. it seems that Wave B is completed so the price is expected to decline with wave C. wave c target 830 to 825 range and consider 888 level for invalidation to this view.
Once the ABC correction is completed we can expect the next impulse up move.
Please note that this information is for educational purposes only, and it is crucial to trade with caution.
NSE:VOLTAS NSE:VOLTAS1! BSE:VOLTAS BSE:VOLTAS

Voltas Ltd Positional Buy 18 Jun 2023As per my analysis, NSE:VOLTAS is ready to move again on upper side levels. 790-793 is best buy level with stop loss of 935 (-55 Points Risk). My expected upside target would be 834 (+44), 865 (+75) & 902 (+112). This could be low risk and reward opportunity.
Note: This is my personal analysis, only to learn stock market behavior. Thanks.

Support turned Resistance in VoltasVOLTAS weekly chart has exhibited a typical support turns resistance price behavior in the 920 zone. The stock took support in this zone in Apr'21 and again a couple of times in May'22. It finally left this zone toward the down side in Sep'22 only to bounce back against the 920 support zone six months later in Mar'23.
However, this time the 920 zone has turned out to be a resistance, a typical behavior in technical analysis, and the stock has fallen sharply from there.
The weight of the evidence now points toward further downside in the price.

Voltas on its way to breakout Voltas Ltd was on our radar for upcoming week bcs RSI and trend line make breakout but we wait for resistance (most imp) breakout. A good buying volume also see in it.
Buy it above 861
Target 880 910 930 965
Sl 830

Voltas Levels & Strategy for Medium TermDear traders, I have identified chart levels based on my analysis, major support & resistance levels. Please note that I am not a SEBI registered member. Information shared by me here for educational purpose only. Please don’t trust me or anyone for trading/investment purpose as it may lead to financial losses. Focus on learning, how to fish, trust on your own trading skills and please do consult your financial advisor before trading.
My Strategy: Sell on rise only????? Please share your thoughts.

VOLTASWelcome to this analysis on VOLTAS
It has made a Bearish Harmonic Gartley Pattern on daily time frame on 14-01-2022.
Today it has shown a reversal from the PRZ and is currently forming a Bearish Engulfing Candle
Derivative data is also suggesting Fresh Short positions are taking place currently in it.
It could do a retracement till 1250-1225 as long as it does not trade above 1325.

VOLTAS VOLTAS has given Breakout in Daily time frame, it looks Bullish,
All the key levels are mentioned in chart with Stop-loss and Targets.
Disclaimer
I am not sebi registered analyst
My studies are Educational purpose only
Please consult with your Financial advisor before trading or investing
