XAU/USD (Gold) – Educational Chart Breakdown [1H Timeframe]We’re currently observing a consolidation phase just below a well-tested resistance zone (~$3,377), while price remains supported by an ascending trendline — a classic setup where structure tightens before a significant move.
Two Potential Outcomes:
Bullish Case
If price closes convincingly above $3,378 with strong volume, we may see a continuation toward the $3,400–$3,410 zone. This would confirm the resistance break and shift market structure bullish on the 1H chart.
Bearish Case
Failure to break above resistance may lead to a reversal and a drop into the $3,345–$3,355 demand zone — especially if price loses the ascending trendline. This would reflect a liquidity sweep and continuation of the larger corrective move.
Patience is key — wait for confirmation before taking action. Consolidation often precedes expansion.
Volume Indicator

What is a Bearish Breakaway and How To Spot One!This Educational Idea consists of:
- What a Bearish Breakaway Candlestick Pattern is
- How its Formed
- Added Confirmations
The example comes to us from EURGBP over the evening hours!
Since I was late to turn it into a Trade Idea, perfect opportunity for a Learning Curve!
Hope you enjoy and find value!

NVDA - 140 Quasimodo?Well NVDA has exceeded the 120 PoC from the last year, and other than the head and shoulders developing it looks rather bullish above that 120. But I would sell 140, or at least not buy.
And if I'm buying I'd probably wait for 112. Think I will wait forever? 😂
Will update after we get some more data.

Understanding Volume In TradingVolume is one of the most crucial yet often overlooked aspects of trading. It represents the total number of shares, contracts, or lots traded in a given period and provides insight into the strength of price movements. By analyzing volume effectively, traders can identify trends, confirm breakouts, and detect potential reversals before they happen.
Unlike price action alone, volume adds a critical layer of confirmation. A price move supported by high volume is more likely to be sustainable, while a move on low volume may indicate weakness or manipulation. Institutions, hedge funds, and large market players leave footprints through volume, and understanding these patterns can give traders an edge.
Volume Types 🎯
Volume
Buy/Sell Volume
Delta Volume
Cumulative Delta Volume
Relative Volume
Cumulative Relative Volume
Open Interest
Volume Profile
01. Volume 🔥
In trading, volume refers to the total quantity of assets traded during a specific time frame, whether they are stocks, futures contracts, options, or currencies. It measures the activity level of a security and provides insights into the strength or weakness of price movements.
Key aspects:
Market sentiment: High volume often indicates strong interest in a security and can signal the strength of a price move. Conversely, low volume may suggest a lack of interest and can indicate that price movements may not be sustainable.
Liquidity: High volume generally indicates better liquidity, meaning it is easier to enter and exit positions without significantly impacting the asset’s price. Low volume may lead to higher slippage and greater price volatility.
Volume spikes: Extremely high volume after a prolonged trend may signal the end of that trend (blow-off tops or panic selling bottoms).
Market types: Volume can vary by market type. In stock markets, it is usually reported in shares. In futures and options, it is reported in contracts, while in Forex, it is often measured by tick volume (the number of price changes).
Impact on market orders & liquidity
High Volume = Lower Slippage: Large orders can be executed more efficiently in high-volume environments.
Low Volume = Higher Volatility: Thin order books in low-volume markets can lead to erratic price swings and wider bid-ask spreads.
02. Buy/Sell Volume 💹
Buy volume and sell volume are key metrics that indicate the level of buying and selling activity in a market. They help traders assess the strength of price movements and market sentiment.
Buy Volume
Buy volume represents the number of shares, contracts, or lots traded at the ask price (or higher). It occurs when buyers are willing to pay the seller’s asking price, indicating buying pressure and potential bullish sentiment.
How buy volume is measured:
Transactions that execute at the ask price are counted as buy volume.
In some cases, aggressive market orders (where buyers take liquidity) are considered buy volume.
Buy volume is often compared to total volume to determine demand strength.
Sell Volume
Sell volume represents the number of shares, contracts, or lots traded at the bid price (or lower). It occurs when sellers accept the buyer’s bid price, indicating selling pressure and potential bearish sentiment.
How sell volume is measured:
Transactions executed at the bid price are counted as sell volume.
Market sell orders (where sellers take liquidity) contribute to sell volume.
Higher sell volume relative to buy volume suggests downward price pressure.
03. Delta Volume ✨
Delta Volume (often referred to as Volume Delta) is a key order flow metric that measures the difference between buy volume and sell volume over a given period.
Calculation
Delta Volume is defined as: Delta Volume = Buy Volume − Sell Volume
Where:
Buy Volume is the total volume transacted at the ask price (aggressive buying).
Sell Volume is the total volume transacted at the bid price (aggressive selling).
Interpretation
Positive Delta (Buy Volume > Sell Volume): Indicates more aggressive buying, suggesting bullish momentum.
Negative Delta (Sell Volume > Buy Volume): Indicates more aggressive selling, suggesting bearish momentum.
Near Zero Delta: Indicates a balance between buyers and sellers, often seen in range-bound markets.
04. Cumulative Delta Volume ⚡
Cumulative Delta Volume (CVD) is an advanced order flow metric that tracks the cumulative sum of Delta Volume over time.
Calculation
CVD t =CVD t − 1 + (Buy Volume − Sell Volume)
Where:
Buy Volume = Volume transacted at the ask price (aggressive buying).
Sell Volume = Volume transacted at the bid price (aggressive selling).
CVD*t = Current cumulative delta value.
CVD\*{t-1} = Previous cumulative delta value.
Interpretation
Rising CVD (Positive Delta Accumulation): Buyers are dominating, indicating bullish momentum.
Falling CVD (Negative Delta Accumulation): Sellers are in control, signaling bearish momentum.
Flat or Divergent CVD: A divergence between price and CVD can indicate potential reversals or absorption by large traders.
05. Relative Volume 📉
Relative Volume (RVOL) is a key trading metric that measures current trading volume compared to its historical average over a specified period. It helps traders assess whether a security is experiencing unusual trading activity and provides insights into liquidity, volatility, and potential price movements.
Calculation
Relative Volume is typically expressed as a ratio:
RVOL = Current Volume / Average Volume Over A Given Period
Where:
Current Volume = The total shares/contracts traded in the current period (e.g., 1-minute, 5-minute, daily).
Average Volume = The average volume over a past period (e.g., 10-day average, 50-day average).
A higher RVOL (>1) means the security is trading at above-average volume, while a lower RVOL (<1) indicates below-average activity.
Interpretation
RVOL > 2: Indicates significantly higher-than-normal volume, often linked to news events, earnings reports, or breakout trends.
RVOL around 1: Suggests normal trading activity with no unusual volume spikes.
RVOL < 1: Indicates low trading activity, which may lead to weak price movements and lower liquidity.
06. Cumulative Relative Volume 💥
Cumulative Relative Volume (CRVOL) is an advanced volume metric that tracks the total volume traded throughout a session relative to its historical average at the same time of day.
Calculation
Cumulative Relative Volume compares the ongoing total volume at a given point in time to the average cumulative volume at that same time over a historical period.
CRVOL = Cumulative Volume at Time X / Average Cumulative Volume at Time X over N periods
Where:
Cumulative Volume at Time X = The total volume traded from market open up to time X.
Average Cumulative Volume at Time X = The average total volume at that point in time over a selected historical period (e.g., 10 days).
N periods = The number of historical sessions used for comparison.
A CRVOL > 1 indicates higher-than-normal trading activity, while CRVOL < 1 suggests lower-than-average activity.
Interpretation
CRVOL > 1.5: Significantly higher trading activity than usual, often linked to news events, earnings reports, or institutional participation.
CRVOL ≈ 1: Normal trading volume, suggesting typical market conditions.
CRVOL < 0.8: Below-average trading volume, often indicating low liquidity and reduced volatility.
07. Open Interest 📊
Open Interest (OI) is a key metric in derivatives markets (futures and options) that represents the total number of outstanding contracts that have not been settled or closed. It is an important indicator of market activity, liquidity, and trader commitment.
How it works?
Open Interest increases or decreases based on the interaction between buyers and sellers:
OI Increases: When a new buyer and a new seller enter the market, creating a fresh contract.
OI Decreases: When an existing buyer and seller close their positions (either by offsetting trades or expiration).
OI Unchanged: If an existing contract is transferred between traders (one trader closes, another opens an equal position).
Interpretation
Rising OI + Rising Price: Suggests strong buying interest, indicating a bullish trend with conviction.
Rising OI + Falling Price: Indicates strong selling pressure, confirming a bearish trend.
Falling OI + Rising Price: Signals a short-covering rally or weakening trend, as traders close positions.
Falling OI + Falling Price: Suggests a lack of commitment to further declines, indicating potential trend exhaustion.
08. Volume Profile 🎢
Volume Profile is a powerful market analysis tool that plots trading volume at different price levels over a specific period. Unlike traditional volume indicators, which show volume per time interval, Volume Profile reveals where the most buying and selling activity occurred, helping traders identify key support and resistance levels, market structure, and potential price reactions.
Components
Volume Profile is displayed as a histogram on the vertical axis, showing the amount of volume traded at each price level. It is built using tick data or intraday price action and is often calculated for different timeframes (daily, weekly, monthly, or custom sessions).
Key components of Volume Profile include:
Point of Control (POC): The price level where the highest volume was traded, acting as a major support/resistance zone.
High Volume Nodes (HVN): Price areas with heavy trading activity, indicating consolidation zones where price is likely to stabilize.
Low Volume Nodes (LVN): Price areas with little trading activity, often leading to fast price movements as there is little resistance or support.
Value Area (VA): The price range where 70% of the total volume was traded, representing the "fair value" zone of the market.
Value Area High (VAH) & Value Area Low (VAL): The upper and lower boundaries of the Value Area, acting as dynamic support and resistance levels.
Types
Session Volume Profile: Analyzes volume for a single trading session (daily or intraday).
Composite Volume Profile: Covers a longer period (weeks, months, or custom-defined ranges).
Fixed Range Volume Profile: Analyzes volume for a specific price range or custom-selected area.
Developing Volume Profile: Updates dynamically throughout the trading session to show real-time changes in volume distribution.
Interpretation
POC as a Magnet: Price tends to revisit the POC due to high liquidity and market agreement at that level.
Breakouts from Value Area: If price breaks above VAH with strong volume, it signals a bullish trend; if it breaks below VAL, it signals a bearish trend.
Reaction at LVN: Price moves quickly through LVN areas but may reverse or stall when approaching HVN.
Rejections at VAH/VAL: If price rejects VAH, it may return to POC or VAL, and vice versa.
09. Indicators 📦
Volume indicators help traders gauge market strength by analyzing the number of shares or contracts traded.
Volume (Default) – Displays the total volume traded per candle, often color-coded based on price movement.
Volume Profile (Fixed Range, Session, Visible Range) – Shows volume distribution across price levels to identify support and resistance zones.
Volume Weighted Average Price (VWAP) – A dynamic support/resistance line that calculates the average price based on volume.
On-Balance Volume (OBV) – Measures cumulative volume flow to detect price trends and confirm breakouts.
Money Flow Index (MFI) – A volume-weighted RSI-like oscillator that identifies overbought and oversold conditions.
Volume Delta – Measures the difference between buying (ask) and selling (bid) volume.
Cumulative Delta Volume – Tracks the cumulative sum of volume delta over time to assess buying/selling pressure.
Relative Volume (RVOL) – Compares current volume to historical averages to highlight unusual trading activity.
Key Takeaways 📋
Volume is a crucial market indicator that reflects trading activity and liquidity, often preceding price movements.
High volume confirms trends and breakouts, while low volume can signal weak or false moves.
Volume Profile identifies key support and resistance zones, with High Volume Nodes (HVNs) acting as strong barriers and Low Volume Nodes (LVNs) allowing fast price movement.
Relative Volume (RVOL) highlights unusual market activity, while Delta Volume and Cumulative Delta reveal buying and selling pressure.
VWAP serves as a dynamic support/resistance tool commonly used by institutional traders.
SHORT META Ahead of Earnings Report Based on Insider Selling"Meta Platforms Insider Sold Shares Worth $22,132,922"
Mark Zuckerberg, 10% Owner, Director, Chair of Board and Chief Executive Officer, on January 15, 2025, sold 35,921 shares in [eta Platforms. Following the Form 4 filing with the SEC, Zuckerberg has control over a total of 353,696 shares of the company, with 353,696 controlled indirectly.
Jennifer Newstead, Chief Legal Officer of Meta Platforms sold 905 shares of Class A Common Stock on January 14, 2025, at a price of $604.54 per share, totaling $547,108. Following the transaction, Newstead directly owns 31,105 shares of Meta Platforms.
Jennifer Newstead, Chief Legal Officer of Meta Platforms, sold 905 shares of Class A Common Stock on January 21, 2025, at a price of $618.0 per share, totaling $559,290. Following the transaction, Newstead directly owns 30,200 shares of Meta Platforms.
The sales were conducted under a Rule 10b5-1 trading plan adopted on November 30, 2023.
Olivan Javier, Chief Operating Officer of Meta Platforms, sold 413 shares of Class A Common Stock on January 21, 2025, at a price of $618.0 per share, totaling $255,234. Following the transaction, Javier directly owns 16,275 shares and indirectly owns 95,287 shares through various entities.
The sale was conducted under a Rule 10b5-1 trading plan adopted on August 30, 2023.

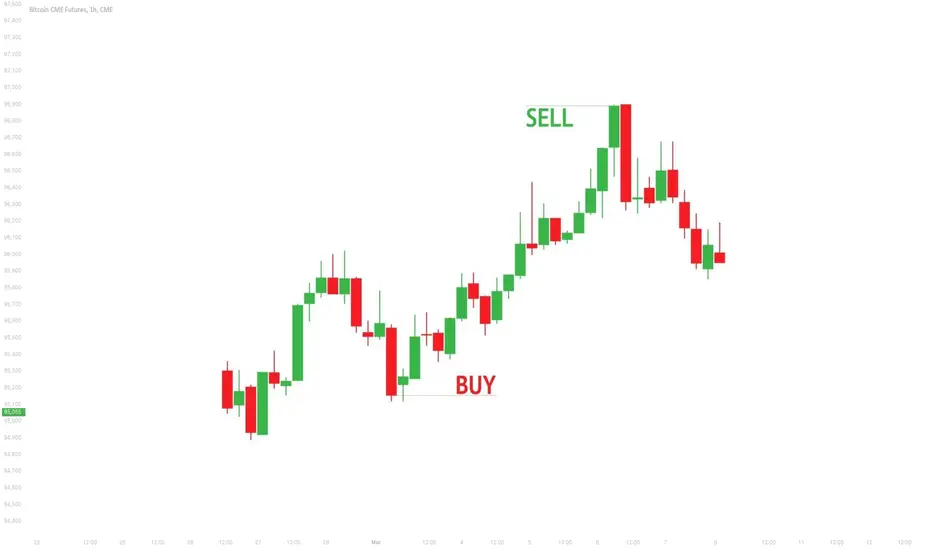
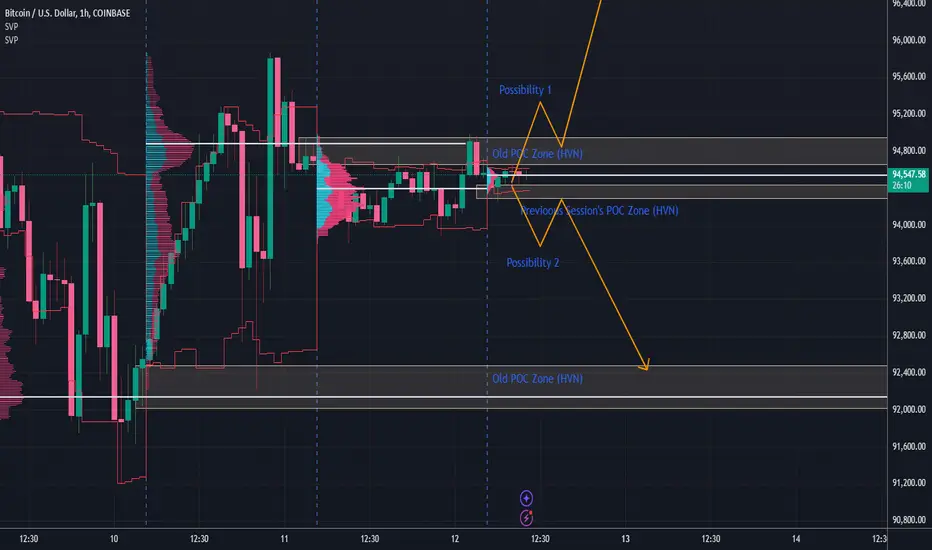
Bitcoin Stuck in heavy volume zone on both sides !BTCUSD is trading between two heavy volume clusters from previous sessions located in close proximity of each other. A break of either of these is likely result in a good move till the next heavy volume cluster as marked on charts.
NSTR - Technical Analysis of Key Bullish and Bearish LevelsKey Observations:
Expanded Volume Profile:
The volume profile on the left indicates significant trading activity (support/resistance zones).
The high-volume node around 360–380 suggests a key area of interest where the price might consolidate or face resistance/support.
Bullish Levels:
Bullish Week (376): A breakout above this level could trigger upward momentum toward 400 and potentially higher.
Close Week Swing (363): Currently being tested. Sustained strength above this level would be a sign of bullish continuation.
Key Target at 400: Bullish swing level acting as a psychological and technical resistance point.
Bearish Levels:
Bear Swing (348): A breakdown below this level could lead to further downside, with the next support at Bear Week (325).
Week ATR (328): If the price approaches this level, it signals a deeper bearish sentiment.
Price Action:
The yellow line shows a recovery attempt after a sharp drop. The price appears to be testing resistance at Close Week Swing (363).
The upward trend from lower levels near 325 suggests some buying interest at lower prices.
Annotations and Targets:
Close Week Swing (363) is pivotal; crossing this level with volume might lead to a test of higher resistance levels.
The area around 325–328 has shown strong support previously, and a retest might attract buyers.
Analysis:
Bullish Scenario:
The price needs to decisively close above 363 to gain bullish momentum. If this happens, look for targets at 376 and then 400.
Volume supporting an upward move would confirm bullish sentiment.
The Bullish Week (376) level is critical for mid-term trend confirmation.
Bearish Scenario:
Failure to hold above 363 could lead to a retest of 348 (Bear Swing) and possibly further downward moves toward 325–328.
Increased volume at lower levels might indicate bearish control.
Neutral Scenario:
Consolidation between 348 and 363 could signal indecision, with a breakout or breakdown likely depending on market sentiment.
Recommendations:
For Bullish Traders:
Look for strong volume above 363 and consider targets at 376 and 400.
Watch for consolidation near 360–363 as a possible entry point.
For Bearish Traders:
A rejection at 363 or a breakdown below 348 would signal opportunities to target 325–328.
Use volume and candlestick patterns to confirm breakdowns.
Risk Management:
Stops should be placed slightly beyond key levels (e.g., above 376 for shorts or below 348 for longs).
This setup emphasizes the importance of the 363 level as a tipping point for direction. Let me know if you'd like further insights!

BOMBAY DYEING - Ready to Move to the Next OrbitThe stock after facing price rejection in the range of 224 to 241 was pushed down to the 50 DMA. It moved almost sideways in the last three months. Recently we saw some interest coming back into the stock with the relative strength and the money flow turning positive and the volume was also increasing. The stock remained very strong during the recent weakness we saw in the overall market. Now finally it has crossed above the price rejection zone with good volume support. The delivery volumes saw substantial increase recently. All other parameters like the buying pressure, volume adjusted momentums, absolute momentum everything seem to be favouring further up move. Looks like the stock is ready to move to the top into the next orbit.

MAZAGON DOCKS - ON A RECOVERY PATH ?The stock after a buying climax bar in the month of July was overwhelmed with the supply of the BC bar and was pushed down to below the 50 DMA levels. Then it started accumulating around the 50 DMA and now it's finally getting pushed above the short-term moving averages. And all the key parameters like the relative strength, absolute strength, the money flow, buying pressure are all nicely stacked up favouring further up move. So, this could move up again. Another 1000 points testing 5400 levels. However, it is better to watch the next couple of bars to see if there is follow-up support coming.

ICP Long Swing SetupThe chart suggests a bullish outlook based on the volume and price action. The significant volume spikes during rallies indicate strong buying interest.
The current low volume during the pullback phase supports the possibility of accumulation.
If the price breaks above the recent highs with increasing volume, it could signal the continuation of the uptrend.

CORRECTION WITH TREND SETUPafter we miss the chance for long with rejection setup at 4H chart we can see clear chance for short
with trend setup as shown on the chart also we have clear view for distribution level at 30 MIN
chart with dally volume profile so far so good for short

#balkrishnaindia long setup After correction stock formed really good base with volume guttering now it's giving volume spike at resistance if it break it and sustain aboue it. Than it will be really good setup.iys fir education purpose only. Am will be not liable for your any lose.

traders await US CPI on ThursdayGold price remains confined in a narrow range as traders await US CPI on Thursday
10 January 2024
• Gold price extends its consolidative price move above a multi-week low touched on Monday.
•The Fed rate cut uncertainty is holding back traders from placing aggressive directional bets.
• Elevated US bond yields underpin the USD and cap gains ahead of the US CPI on Thursday.
Technical Analysis: Gold price bears await a break below the 50-day SMA support near $2,017 area
From a technical perspective, the multi-week low, around the $2,017 area touched on Monday, which now coincides with the 50-day Simple Moving Average (SMA), should protect the immediate downside. A convincing break below could make the gold price vulnerable to accelerate the slide towards the $2,000 psychological mark. Some follow-through selling will expose the December swing low, around the $1,973 region, before the XAU/USD eventually drops to the $1,965-1,963 confluence, comprising the 100- and 200-day SMAs.
On the flip side, the $2,040-2,042 zone might continue to act as an immediate strong barrier, above which the Gold price could aim to retest Friday's swing high, around the $2,064 area. The next relevant hurdle is pegged near the $2,077 area, which if cleared decisively will negate any near-term negative outlook and set the stage for a move towards reclaiming the $2,100 round figure.
Gold price (XAU/USD) met with some supply following an uptick to the $2,040 area on Tuesday and finally settled with only modest gains on Tuesday. The precious metal continues with its struggle to gain any meaningful traction during the Asian session on Wednesday as traders seek more clarity on the Federal Reserve's (Fed) rate cut path before placing directional bets. Hence, the market focus will remain glued to the release of the latest consumer inflation figures from the United States (US) due on Thursday, which will play a key role in determining the near-term trajectory for the commodity.
Ahead of the key data risk, investors have been scaling back their expectations for a more aggressive policy easing by the Fed in the wake of a robust December US jobs report on Friday, which pointed to a still-resilient labor market. This remains supportive of elevated US Treasury bond yields and acts as a tailwind for the US Dollar (USD), capping the non-yielding Gold price. That said, geopolitical risks stemming from the Israel-Hamas war and persistent worries over a slow economic recovery in China – the world's second-largest economy – should lend some support to the safe-haven precious metal.
Daily Digest Market Movers: Gold price struggles for a firm direction amid mixed fundamental cues
• The uncertainty over the timing of when the Federal Reserve will start cutting interest rates holds back traders from placing fresh directional bets around the gold price.
The New York Fed reported on Monday that US consumers' projection of inflation fell to the lowest level in nearly three years in December, raising bets for an imminent shift in the Fed's policy stance.
Meanwhile, the resilient US economy, which is experiencing above-target inflation, gives the US central bank more headroom to keep interest rates higher for longer.
• This allows the yield in the benchmark 10-year US government bond to hold above the 4.0% threshold, which lends support to the US Dollar and caps the yellow metal.
Bearish traders, however, seem reluctant and prefer to wait on the sidelines ahead of the latest US consumer inflation figures, due for release on Thursday.
Citing a senior US Defense Department official, CNBC reported late Tuesday that Iran-backed Houthi militants launched the largest attack to date on commercial merchant vessels.
A senior People's Bank of China official said this Wednesday that the central bank may use monetary policy tools to provide strong support for reasonable credit growth.
The official added that the PBoC will strengthen its counter-cyclical and cross-cycle policy adjustments to create favorable conditions for the country's economic growth.
• There isn't any relevant market-moving macro data scheduled for release from the US on Wednesday, leaving the XAU/USD at the mercy of the USD price dynamics.

ES Outlook for 11-27 Week We are approaching an area of resistance with the composite value area from the ATH lingering above us. Does not mean we will see a sharp rejection, but could mean that buyers really need to step up or else we risk a phase of balance and or rotation lower.

GbpJpy long position analysis We're in a pull back of a bullish trend and I think this area has its potential to go up.
You can set a buy limit order or for more confirmation wait for a CHoCH in lower time frames.
Let's see what will happen...
Good luck

GbpUsd sell position analysis As we have CHoCH and a BOS now we have to look for a pull back to go short.
For more confirmation you can wait for a CHoCH in 1min TF after the price has reached to this level.
Let see what will happen...
Good luck

GAP Short under 18.50Retracement play for XETR:GAP after major earnings pop. Beware this still has momentum , but we are reaching an overvalued territory.
Big volume gap also seen above 19 , which is unlikely to fill with this overextended trend.
Price target - $15

$BTC [NOW]BINANCE:BTCUSD / BYBIT:USDT.P + abusing the BaseLine Chart
Damn high for a pull back, but also no rally.
Unless its cosmetics just to let the Monthly Candle shine, its decision time.


Volume price Volume price is my term meaning the average price for a certain traded volume in a certain period of time.
As an example, I took the BTCUSD chart
To find out at what level the largest volume is traded, there is a tool called "Fixed Volume Profile" FRVP (located on the sidebar, in the Tools for Measurement and Forecasting cell).
Here I stretched it for the period from November 14, 2020 to August 03, 2023 POC the orange line in my case (it's so convenient for me) shows the same maximum volume, and if you put a horizontal line with a price display in its place, we will see the price of 16752.88 - this is the price of volume.
That is, the largest volume was traded at this price.
A fixed volume profile can be applied on any segments of the chart, for example, from high to low, or from low to low, or from high to high, or in the sideways.
What does this give us?
Firstly, we understand at what price large capital gained or gave away its position.
Secondly, it forms the most powerful level for a certain time period (time frame).
And finally, the volume has a price.

Todays Agressive trade on GJ i have found using the fixed volume profile and DR to be extremely effective.
the DR indicator is from @TheMas7er

Key levels for ESCME_MINI:ES1! is breaking the 10 day trend line. Key levels to watch for as shown
3933 - 10 D POC level
- if this holds, this trendline break might be considered a false one and we might see a bounce higher
- otherwise, I see a lots of trapped longs above this level. We might head towards 3890

TOTAL Crypto Market Cap 1 HR TOTAL - Total Crypto Market Cap 1 HR
Volume coming in! Above the 200 MA and holding for now...
Peeps buying #Bitcoin and Crypto.... <---
Banks are Failing.... <---
Silvergate - Silicon Valley ...
#DoYourOwnReasearch
Lets See what happens this week!
Gonna be interesting...
Good Luck Out There!
