Chart structure reacts to memory. Momentum + reaction zones! BTCWhat you're seeing isn’t just price action—it's memory in motion.
🟥 Prior momentum shifts marked critical turning points where sellers temporarily dominated.
🟩 Support responses signaled reactive strength, giving early signs of accumulation.
📘 Consolidation zones show where price "remembered" to pause—these often act as launchpads or traps.
🟧 Swept demand cleared out weak hands before a sustained move.
📈 Historical resistance, once broken, becomes memory-based support.
Each label isn't a signal—it's a story.
This chart reminds us:
👉 Before price moves, it tests memory.
👉 Before breakouts, it absorbs emotion.
👉 And before trends, it reacts to old battles.
🧠 The more you study structure, the more you see intention—not randomness.
Volumeanalysis

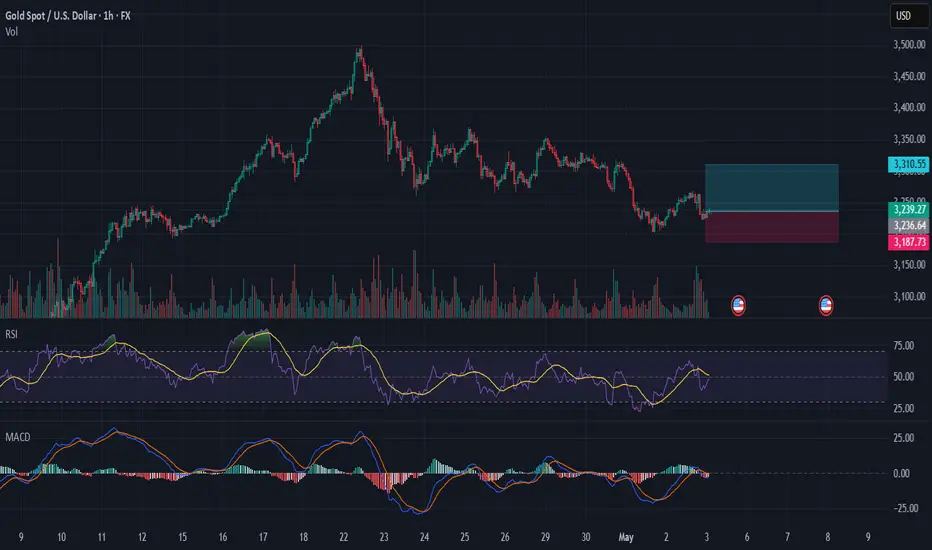
Gold (XAU/USD) Long Setup: Capitalizing on Key Support LevelsThis setup is based on a combination of technical indicators and key support levels, which suggest a potential bullish movement in the near future.
Chart Analysis:
Price Action: The price of gold has been consolidating around the $3,230 level, forming a potential support zone. This consolidation phase often precedes a breakout, and we are looking for a bullish breakout from this range.
Volume: The volume indicator shows a decrease in selling pressure, which is a positive sign. Increased volume on upward price movements would confirm the bullish sentiment.
RSI (Relative Strength Index): The RSI is currently hovering around the 50 level, indicating a neutral momentum. However, a break above 50 would signal bullish momentum, and we are looking for a move towards the overbought zone (above 70).
MACD (Moving Average Convergence Divergence): The MACD line is approaching a bullish crossover with the signal line, which is a strong indication of a potential upward trend. The histogram is also showing positive divergence, adding to the bullish case.
Support and Resistance Levels: Key support levels are marked at $3,187.75 and $3,236.44. A break above these levels would confirm the bullish setup. Resistance levels are at $3,310.55 and $3,379.27, which could act as targets for the long position.
Trade Setup:
Entry: Look for a bullish breakout above the $3,236.44 support level.
Stop Loss: Place a stop loss below the recent low at $3,187.75.
Target: Aim for the resistance levels at $3,310.55 and $3,379.27.
I invite all traders to share their thoughts and insights on this setup. Your feedback and additional analysis can help refine this strategy and improve our collective understanding of the market. Let's discuss the potential outcomes and any additional indicators or patterns that could support or contradict this setup.
Don't forget to follow me for more detailed analyses and trade setups. Together, we can navigate the markets and capitalize on profitable opportunities.
Happy Trading! 🚀💸
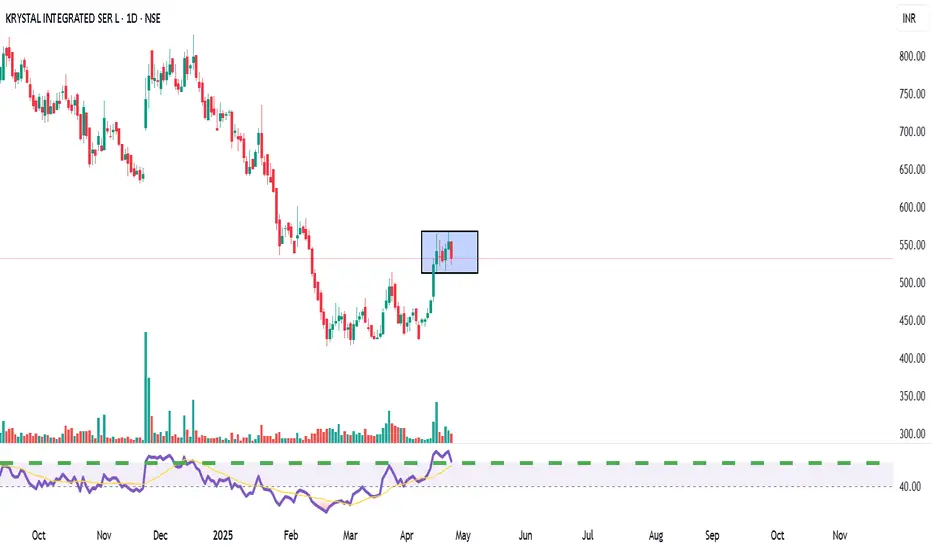
KRYSTAL Integrated Services LtdTechnical View: KRYSTAL is consolidating between ₹520–₹550 after a rally from March lows. A breakout above ₹560 could target ₹600+, while a dip below ₹500 may weaken momentum. RSI shows moderate bullishness.
Fundamental View: FY24 revenue grew ~44% YoY to ₹981 Cr; net profit rose ~26% to ₹48 Cr. ROE ~18%, ROCE ~20%. Recently secured a ₹349 Cr 3-year contract from Tamil Nadu Medical Services.
Action Plan:
Short-term: Buy above ₹560, target ₹600.
Long-term: Attractive valuation; accumulate on dips ₹450–₹500 zone.
Gold 4H – Big vs Little: The Conflict That Created ClarityJust price, structure, and volume — tracked in real time.
🧠 Chart Breakdown:
✅ Trend Reclaim (Early March) — Entered just after price bounced from the 200 EMA. Both systems aligned: Big Brother reversal and Little Brother trend crossover. I trusted the signal and it ran clean.
⛔ False Top (Late March) — Big Brother printed a red arrow under resistance. Little Brother still looked bullish, but I paused. That caution kept me out of the trap.
✅ Re-entry Confirmation (Early April) — Green triangle fired again after a textbook pullback. Bullish volume returned, and Little Brother confirmed. I re-entered long.
⛔ True Top (Mid-April) — Volume faded. Big Brother gave a second red warning. I exited longs here — structure rolled over fast after that.
🚨 Breakdown Confirmed (May 1–2) — The flush sealed it. Both systems aligned bearish. Structure broke. No more guessing — this trend has shifted.
This is how I trade with conviction. Tools don’t replace decisions — they sharpen them.

Gold 1H Breakdown: Top Confirmed, Trend ReversedJust price, structure, and volume — tracked in real time.
🧠 Chart Breakdown:
✅ Trend Start / Structure Reclaim — Price regained key support and moving averages with momentum. Structure flipped bullish and trend began.
⛔ Top Exhaustion — Price reached new highs but began to stall. Volume dropped, and candles began curling — signaling a loss of momentum.
⚠️ Bounce Setup — After the pullback, buyers attempted to step back in — but structure never confirmed. No follow-through = no entry.
🚨 Breakdown Trigger — Sellers regained full control. Price broke below key levels with conviction. Volume confirmed the shift.
👀 Current Move — Price is pushing into new lows. Breakdown structure remains active until proven otherwise.
Always happy to be helpful.

Gold: Breakdown in Motion (15m Chart)Just price, structure, and volume — tracked in real time.
🧠 Chart Breakdown:
✅ Momentum Long — Price broke out from a base with clean volume. MA structure aligned, and bulls had control early.
⛔ Top Reversal — Price peaked and printed a clean rejection. Volume faded. Sellers rotated in.
⛔ Lower High Rejection — Attempt to reclaim highs failed fast. Fib and MA structure stacked against continuation.
⚠️ Temporary Recovery Attempt — Brief bounce off support, but no structure regained. No follow-through = no entry.
🚨 Breakdown Confirmed — Price lost all support levels with conviction. Volume backed the flush. Breakdown held and extended.
👀 Current Pressure Point — Price still pressing lows. Watching to see if momentum continues or if we get exhaustion behavior.
Always happy to be helpful.

SPX Play-by-Play: From Trap to Trend and Back AgainJust price, structure, and volume — tracked in real time.
🧠 Chart Breakdown:
✅ Early Short Trap / Failed Breakdown — Sellers tried to press lower early, but price held key levels and reversed. That shift became the foundation for the entire move that followed.
✅ Breakout Long Trigger — After reclaiming structure, price drove into new highs with strong follow-through. Volume confirmed the breakout.
⛔ Top Rejection — Price pushed into resistance but couldn’t hold. Momentum faded, candles hesitated, and sellers stepped in.
✅ Fib-Based Bounce — After the pullback, price responded cleanly off fib-based support. The bounce was sharp, and volume backed it.
✅ Steady Uptrend Structure — Price moved in an orderly fashion. Small pullbacks held structure, and volume stayed supportive — a textbook controlled climb.
⛔ Range Resistance — Price returned to a previously rejected zone. Wicks and hesitation reappeared.
👀 Current Breakout Watch — Price is testing that resistance again. A reclaim with strength signals continuation. Another fade? Let it go.
Always happy to be helpful.

XRP/USDT — Structure-Driven Strategy (1H Chart)Just price, structure, and volume — tracked in real time.
🧠 Chart Breakdown:
✅ Reversal Buy — Price flushed, then snapped back into the range with follow-through. That became the base structure for everything that followed.
⛔ Top Exhaustion / Rejection — Clean reversal after a strong rally. Volume dropped off, candles showed hesitation, and sellers stepped in.
⚠️ Small Rejection Mid-Range — Structure failed to push higher. This area marked a trap — no volume confirmation, no continuation.
🚨 Major Breakdown & Recovery Setup — Price dropped hard but reclaimed key levels quickly. The recovery candle and volume spike were the first clues buyers were stepping in again.
👀 Current Watch Point — Price is now pressing back into that same resistance zone. The structure here is everything — a clean reclaim could mean trend continuation. But hesitation again? Fade it.
Always happy to be helpful.

Is Nasdaq still bullish? Steep correction today as expectedIf you look at my last post, you can see where I explained the expectation.
As range theory would state, the rejection from the bottom of a range creates a target in the high of the range. I have identified the candle top that I believe is the target for this rally.
If the bearish imbalance is stacked with too many orders we will not make it there. We are sitting right around the 50EMA for hourly as well as retesting the break point and bottom of the hourly bearish orderblock as I have marked.
It is in my opinion that the Void will act as a magnetic anomaly and assist in pulling price up as many institutional orders will be in that range, but we'll see 🔑
Share with a friend in need of real guidance 🫡

#BEARISH MOVE EXPECTEDIn this analysis we're focusing on 1H time frame for gold. In this analyze we are using downward trendline along with the combination of price action. When price enter in our supply area, so our first step is to observe how price will react and if price give any bearish confirmation then we'll execute our trade. Confirmation is very important.
Always use stoploss for your trade.
Always use proper money management and proper R:R ratio.
This is my analysis not a financial advice.
#XAUUSD 1H Technical Analysis Expected Move.

GOLD ANALYSISIn this analysis we're focusing on 1H time frame for Gold. Today I'm expecting bullish momentum and my bias was bullish. On the basis of SMC concept and price action when price reach my zone and give any bullish confirmation, after observing strong confirmation. I'll trigger my trades. Let's see what happens and which opportunity market will give us.
This is a higher time frame outlook. Let's analyze more deeply in smaller time frame for finding ideal and crucial entry point. Confirmation is very important.
Always use stoploss for your trade.
Always use proper money management and proper risk to reward ratio.
This is just my analysis.
#XAUUSD 1H Technical Analysis Expected Move.

TSLA: Low Is In , Rally IncomingTSLA is showing signs of strong accumulation, with buyers consistently stepping in and volume expanding on up-moves. Price structure is improving, breakouts further confirm strength, increasing the likelihood that bears have been left behind. Based on the price action and volume alone, TSLA looks ready for a potential sustained move higher.

#XAUUSD 1H ANALYSISXAUUSD 1H Supply & Demand Analysis
In this analysis we're focusing on 1H time frame, for finding upcoming movement and changes in Gold prices. Price action shows a clear bearish structure following a strong upside move that was met with resistance near the 3370–3380 supply zone. After two Breaks of Structure (BOS), price is retracing toward a premium level where supply is expected to be reactivated.
Marked areas:
🔴 Supply Zone: 3370–3380 (potential short-entry zone)
🔵 Demand Zone: 3260–3290 (reversal or TP zone)
Target 1: 3315
Target 2: 3305
Target 3: 3292
This setup suggests an ideal Sell from Supply once price reacts and confirms bearish intent with internal structure shifts. Patience is key wait for price to tap the zone and show signs of weakness before entering. Confirmation is very important.
Always use stoploss for your trade.
Always use proper money management and proper risk to reward ratio.
This is just my analysis not financial advice.
#GOLD 1H Technical Analysis Expected Move.

LINK’s Swing Setup Could Push Past $15LINK bounced right off the $10 mark, charging upward toward the monthly open before slamming into resistance around $13.25. But now what?
Let’s break it down — because the next high-probability setup is taking shape, and it’s one you don’t want to miss.
The Current Situation:
LINK is:
Below the Point of Control (POC) of this trading range (~$11.35).
Below the monthly open at $13.5.
Still in a bearish trend on the 4H, showing lower highs.
Facing decent rejection from the monthly level.
We’re currently trading below the weekly open at $12.62, now sitting right on the Value Area Low (VAL) at $12.36. That puts us in a precarious spot and sets the stage for the next move.
Bearish, bearish, bearish. When bullish sir? Staying patient and waiting for a real shift in market structure is key.
The Bearish Play: Liquidity Grab Incoming?
There’s a liquidity pocket waiting below at $11.68, the most recent swing low. If LINK loses VAL and bearish pressure kicks in, this becomes the next logical target.
But here's where things get interesting...
The Bullish Setup: Confluence-Backed Long Opportunity
This isn’t just any random support zone — there’s a perfect confluence stack forming:
Swing low: $11.68
Daily support level: $11.45
Weekly support level: $11.28
POC of trading range: ~$11.35
0.618 Fibonacci retracement lands in this zone as well
That’s four layers of support in one tight cluster. This is where we want to scale into longs.
The Play: Scaling In
Entry: Ladder long positions from $11.68 down to the 0.786 fib (near $11.2)
Stop Loss: Below $10.35 for invalidation
Target: 0.786 fib retracement of the previous downward wave at ~$14.5
R:R: Approx. 3:1, with a potential +30% gain
The trend remains bearish but the chart is setting up a prime reversal zone. Patience is key here.
🔔 Set alerts. Watch for volume spikes. Look for SFPs or bullish engulfing candles etc.
The next move on LINK could offer one of the best swing setups especially since this trade could extend past the $15 mark, putting you ahead of the curve.
💬 Found this helpful? Drop a like and comment below. Want TA on another coin? Let me know and I’ll break it down for you.
Happy trading everyone! 💪

Ethereum Hits Support – Time to Load Up?🎢 The Great 112‑Day Drop
What happened? Over the past 112 days, ETH tumbled –66%, sliding from $4109 down to $1383 and oh yeah, it even poked its nose below the January 2018 all-time high. 7 years ago!
Support Zone: 0.786 + Volume Profile
0.786 Fib: $1,570.85 (drawn from the 2022 low $870.80 to that $4109 high).
5‑Year POC: $1565
Hold Tight: For 2 weeks, the 0.786 level has acted as support, bouncing price right back up.
Sell in May and go away? Rather buy in May and grab some gains on the way?
Trade Blueprint: Your Ethereum Game Plan
Entry Zone: $1570.85
Stop Loss: Below $1369.79
Profit Targets: $1800, $2000 ,$2500, $3000
Risk/Reward: Risk ≈13%, Reward ≈91%, a solid 7:1 R:R
DCA
Missed the perfect entry? No drama... dollar‑cost average between $1700 and $1500.
Keep an eye on the monthly open at $1822. Bulls need to break this resistance zone.
Bottom Line
Ethereum’s –66% dive has handed us a golden ticket at the 0.786 fib and 5‑year POC. This is one of those “buy the dip” moments.
________________________________
💬 Found this helpful? Drop a like and comment below. Want TA on another coin? Let me know and I’ll break it down for you.
Happy trading everyone! 💪


KIMSKIMS has given inverted H&S breakout with decent volume. The depth is around 28-30% from neckline to bottom of the head. So if we add it to breakout line then we may see the same move on upper side. If we look at weekly timeline then also it has given resistance breakout. Seems very promising.

GOLD 30M ANALYSISIn this analysis we're focusing on 30m time frame for GOLD. To identify the best buying area and POI for our buy trade setup. In this chart price is creating trendline support and also price break it's previous high. So overall market trend was bullish. According to the market trend my Bias was also bullish. Let's see when price retest and come to our entry zone. Once price comes observe the behavior of price and if price give any bullish confirmation then we'll execute our trade. Let's delve deeper into these levels and potential outcomes.
Always use stoploss for your trade.
Always use proper money management and proper risk to reward ratio.
This is just my analysis.
#XAUUSD 30M Technical Analysis Expected Move.

EURUSD ANALYSISEUR/USD – 2H Bullish Continuation Play
Following a sharp breakout, EUR/USD is gracefully pulling back toward the 1.1095–1.1149 demand zone, now acting as support. This zone holds significance as a potential launchpad for the next bullish wave.
A higher low formation here could ignite continuation toward 1.1471, with extended upside into 1.1605, presenting a clean and favorable risk-to-reward opportunity.
The structure is clear, the momentum is aligned, and the setup reflects a well-composed bullish scenario ideal for patient and precise execution.
▫️ Impulsive breakout
▫️ Retracement to demand zone (1.1095–1.1149)
▫️ Looking for higher low → continuation
🎯 TP1: 1.1471
🎯 TP2: 1.1605
🛡️ Clean R:R, perfect for trend followers.
#EURUSD 2H Technical Analysis Expected Move.

Ranging? Not Really. The Big Guys’ Plan Is Already Set…Ever wondered what the crowd is really doing behind the candles?
This video breaks down how to read Cumulative Volume Delta (CVD)—
from retail behavior to sentiment charts, and why the market doesn’t always follow logic.
✅ When price moves one way but the crowd trades the other...
✅ When sideways markets aren’t as neutral as they look...
✅ When emotions take over—and how to spot it in advance.
We’re lifting the hood. The engine’s running. Let’s see what drives it.

ICICI Prudential Life – Turning the Corner?After months of steady decline inside a falling channel, ICICI Prudential Life is showing early signs of reversal. The stock has recently broken out of its channel with a strong bullish weekly candle, closing at ₹571.70 with a +4.5% gain. Volume is picking up, and RSI is curling up above 40 with a bullish divergence—indicating momentum is building. Price is now near a key resistance zone (~₹590–₹610); a clean breakout here could confirm trend reversal.
📊 Financial Snapshot
Net Premium Income: ₹10,169 Cr vs ₹9,465 Cr ⬆️
PAT: ₹226 Cr vs ₹221 Cr (flat YoY)
VNB Margin: Healthy at 26.7%
Embedded Value: ₹47,020 Cr
Solvency Ratio: Strong at 211%
AUM: ₹2.88 Lakh Cr
💡 Why Consider Buying?
Reversal setup after long correction
Attractive risk-reward near base
Steady premium growth, strong solvency
Long-term growth play on India’s underpenetrated life insurance sector
🚫 Risks / Why to Wait:
Resistance at ₹590–₹610 still intact
PAT growth has been flat
Sector sentiment can be sensitive to interest rate trends
🎯 Trade Setup:
Buy Zone: ₹565–575
Target 1: ₹610
Target 2: ₹660
Stop Loss: ₹540
for educational purposes only

ALRS 1D Long Investment Aggressive CounterTrend TradeAggressive CounterTrend Trade
- short impulse
+ volumed T1
+ support level
+ biggest volume Sp
+ weak test
+ first bullish bar close entry
Calculated affordable stop limit
Take profit
1/3 - 1 to 2 R/R
1/3 - 1D T2 / 1M T2
1/3 - 1/2 of 1Y
Calculated affordable stop limit
Take profit
1/3 - 1 to 2 R/R
1/3 - 1D T2 / 1M T2
1/3 - 1/2 of 1Y
Monthly CounterTrend
"- short impulse
+ volumed TE / T1
+ support level
+ volumed Sp
+ test"
Yearly Trend
"+ long impulse
+ 1/2 correction
+ T2 level
+ support level
+ manipulation"

GBPUSD. Weekly trading levels 14 - 18.04.2025During the week you can trade from these price levels. Finding the entry point into a transaction and its support is up to you, depending on your trading style and the development of the situation. Zones show preferred price ranges WHERE to look for an entry point into a trade.
If you expect any medium-term price movements, then most likely they will start from one of the zones.
Levels are valid for a week, the date is in the title. Next week I will adjust the levels based on new data and publish a new post.
! Please note that brokers have a difference in quotes, take this into account when trading.
The history of level development can be seen in my previous posts. They cannot be edited or deleted. Everything is fair. :)
----------------------------------------------
I don’t play guess the direction (that’s why there are no directional arrows), but zones (levels) are used for trading. We wait for the zone to approach, watch the reaction, and enter the trade.
Levels are drawn based on volumes and data from the CME. They are used as areas of interest for trading. Traded as classic support/resistance levels. We see the reaction to the rebound, we trade the rebound. We see a breakout and continue to trade on a rollback to the level. The worst option is if we revolve around the zone in a flat.
Do not reverse the market at every level; if there is a trend movement, consider it as an opportunity to continue the movement. Until the price has drawn a reversal pattern.
More information in my RU profile.
Don't forget to like Rocket and Subscribe!!! Feedback is very important to me!
