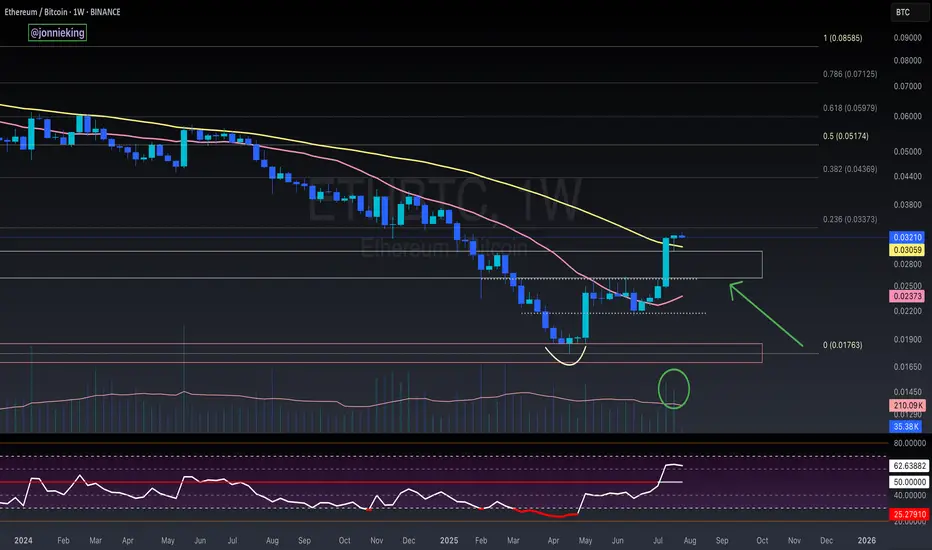
$ETH 2nd Weekly Close Above 50MA = Alt Season2nd Consecutive Weekly Close
above the 50MA for CRYPTOCAP:ETH
✅ Volume to confirm the breakout.
✅ RSI has bottomed.
WHAT TO WATCH 👀
┛Bullish Cross on the 20/50MA to confirm the next leg up.
┛Approaching some resistance ahead at the .236 Fib
┛Expect a small pullback in the next week or two so make sure to get your bids in.
Remember the rotation:
✅ BTC > ✅ ETH > Large Caps > Mid Caps > Micro Caps.
VOLUMEBREAKOUT
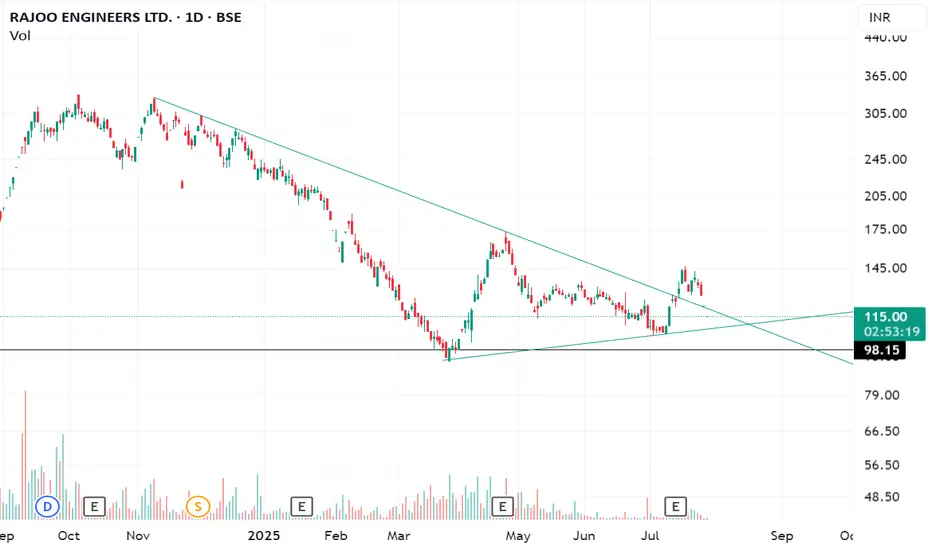
Symmetrical Triangle Pattern BreakoutThe stock has broken symmetrical triangle pattern with 3.5x volumes on 14July and now has retraced and is at a massive support. Buy at 115 for a target of 327. Use a 1:3 risk reward ratio
MRPL, Bullish Momentum, Large Volumes, Long, 1DMRPL is showing very Bullish momentum with large volumes. If it breaks 160 with Bullish candlesticks then enter in the trade for the target of 170 and 180.
Entry: 160 (only on Bullish CandleStick)
Target1: 170
Target2: 180.

BAJAJ HOUSING FINANCE LTD GOOD TIME TO PICK IT Bajaj Housing Finance Ltd. (BHFL) is a prominent non-banking financial company (NBFC) in India, specializing in housing-related finance. It's a subsidiary of Bajaj Finance Ltd., and has been classified as an Upper-Layer NBFC by the RBI under its Scale-Based Regulations.
📊 Latest Financial Highlights (Q1 FY26 Preview)
- Assets Under Management (AUM): 1.2 lakh crore, up 24% YoY and 5% QoQ
- Loan Assets: 1.05 lakh crore, up 24.2% YoY
- Disbursements: 14,640 crore, up 22% YoY
- Net Profit (PAT): Expected to rise 19–21% YoY to 574–584 crore
- Net Interest Income (NII): Estimated to grow 24–28% YoY to 827–851 crore
- Net Interest Margin (NIM): Projected at ~3.2%, slightly compressed due to rate cuts
The company is well-positioned to benefit from the rising demand for housing loans, as more people seek to buy homes. With a focus on technology and customer service, BHFL is likely to enhance its operational efficiency, attracting more clients and growing its market share. As a result, the stock price of BHFL could rise, with steady growth by its expanding loan portfolio and strong brand recognition. In 2026, its share price target would be 253, as per our analysis.
SHORT TERM VIEW
entry - 119.50-123
stop loss - 117.60
target - 135-140

GMDC, Long 1D, Breakout, VolumesGMDC has shown a good volume in the stock today and has taken support from the previous low. If it breaks its recent high of 428 with Bullish candlestick patterns like Bullish Engulfing, Hammer & Inverted Hammer, Piercing Line, Morning Star, Three White Soldiers, Tweezer Bottoms or Bullish Harami, then take a long trade on this stock.
Entry: 428 (on Bullish candlestick pattern)
Target1: 445
Target2: 450 till 480.

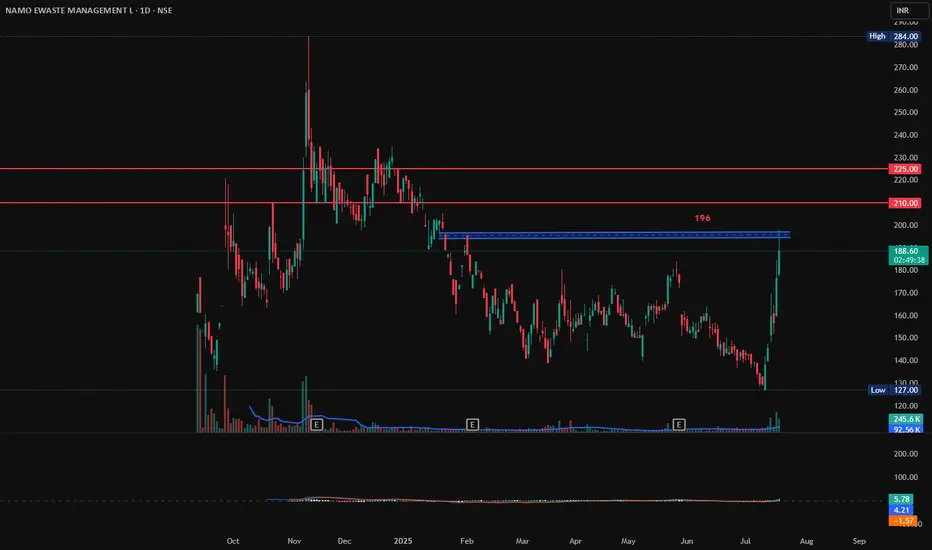
NAMO EWASTE MANAGEMENT, Long, Breakout, 1DNAMO EWASTE MANAGEMENT has gain 6% today with good volumes. If it breaks and sustains 196 with Bullish candlestick patterns like Bullish Engulfing, Hammer & Inverted Hammer, Piercing Line, Morning Star, Three White Soldiers, Tweezer Bottoms or Bullish Harami, then there are good chances for it to go further up from here. First target will be 210 and second target 225.
Entry: 196 (on Bullish candlestick pattern)
Target1: 210
Target2: 225.
SL: 185
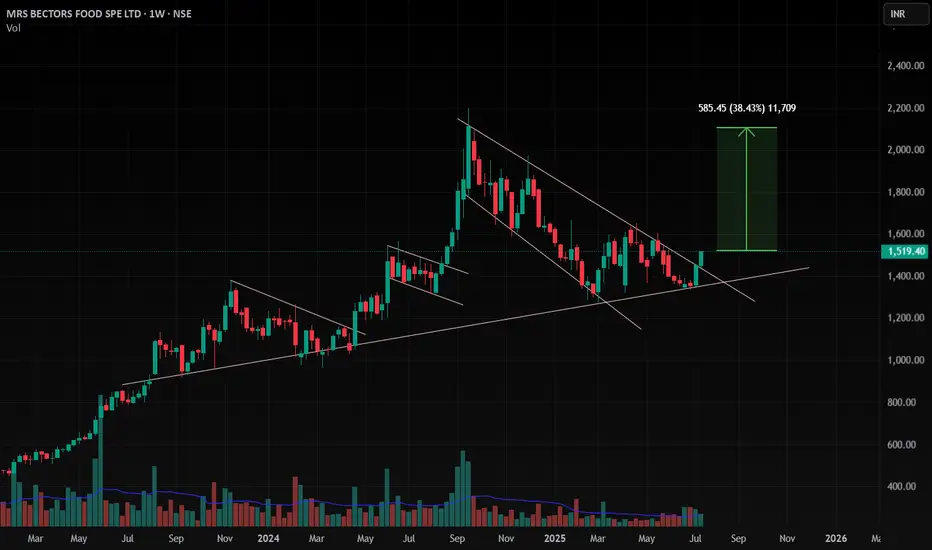
BECTORFOOD , 1W , Bullish As the trendline is giving support at below and formed a good pattern and given breakout with good close in weekly and daily .
This stock is ready to enter into this
Follow for more Ideas like this
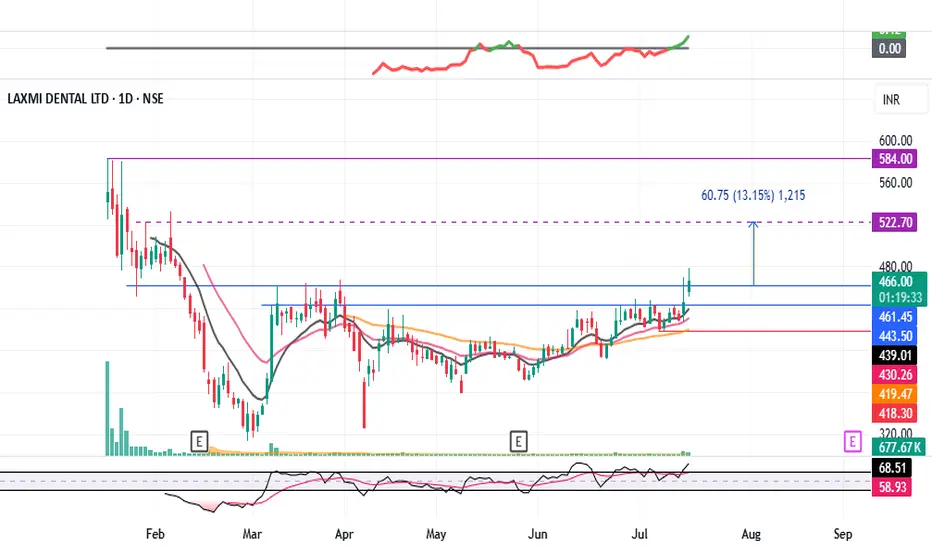
LAXMIDENTL : Consolidation Breakout#LAXMIDENTL #breakout #breakouttrading #ipostock
LAXMIDENTL : Swing Trade
>> Consolidation Breakout
>> Volumes Building up
>> Stock in Momentum
>> Good Strength in stock
>> Trending setup
Swing Traders can lock profit at 10% and keep trailing
Pls Boost, Comment & Follow for more analysis
Disc : Charts shared are for Learning purpose not a Trade Recommendation, Take postions only after consulting your Financial Advisor or a SEBI Registered Advisor.
Positional Swing Trade Idea – GFL LTD 📌 Positional Swing Trade Idea – GFL LTD | Cup & Handle Pattern + Accumulation Zone
**GFL LTD (NSE\:GFL)** is showing a well-formed **Cup and Handle** pattern on the daily timeframe, with price action consolidating in a narrow range—indicating strength before a potential breakout.
🔍 **Technical Observations:**
* A well-rounded **cup base** has developed, signaling strong accumulation over time.
* A classic **handle** is now forming, showing controlled consolidation.
* The stock is currently **accumulating between ₹72.50–₹72.55**, creating a narrow resistance zone.
* Sustained movement and a breakout above this zone may lead to a **boombastic upside** move, backed by volume confirmation.
📈 **Trade Setup:**
* **Breakout Level to Watch:** ₹72.55+ on volume
* **Accumulation Range:** ₹72.50–₹72.55
* **Support:** Handle base and recent consolidation low
* **Potential Targets:** Based on pattern depth and momentum
The structure looks promising for a **positional swing trade**, especially if the price holds above the accumulation zone with strength.
⚠️ **Disclaimer:** This analysis is for educational purposes only. Please conduct your own due diligence before entering any trade.

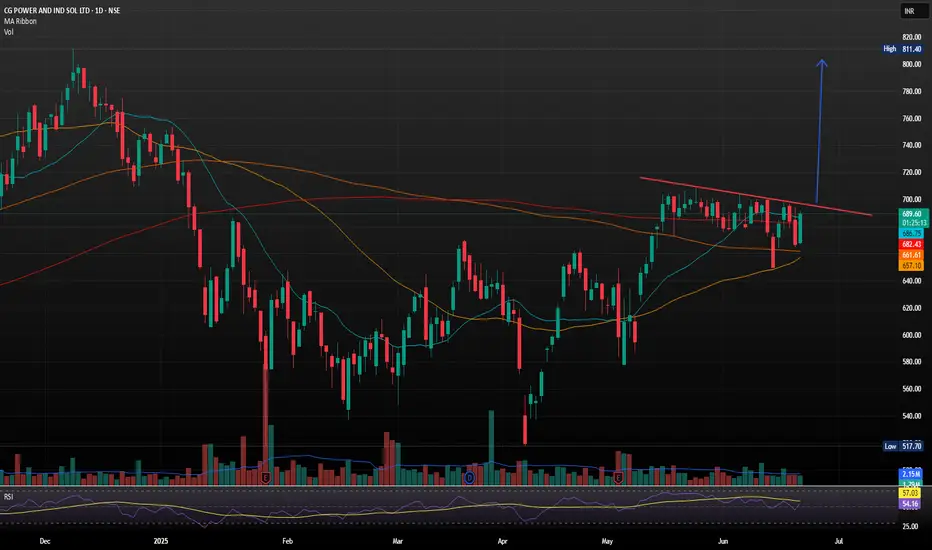
CG Power and Industrial Solutions with Strong Bullish Flag SetupCG Power and Industrial Solutions just landed its largest-ever single order a 641 crore contract from Power Grid Corporation of India Ltd (PGCIL) for high-voltage transformers and reactors
The company, now under the Murugappa Group, reported consolidated FY25 revenues of 9,909 crore. However, annual profit dipped to 972.98 crore from 1,427.61 crore in FY24, despite a strong Q4 showing with a 17% YoY rise in net profit to 274.26 crore.
- Inverse Head & Shoulders Breakout: The stock recently broke out of an inverse H&S pattern, a classic bullish reversal signal, with strong volume confirmation. Holding above 690 could push it toward 750 TO 800.
Support & Resistance Levels
- Support: 663–679 demand zone
- Resistance: 694, 704 and 712
Trend Summary
- Short-Term: Neutral to bullish
- Medium-Term: Bullish bias if it sustains above 690
- Volatility: Elevated, so expect sharp swings
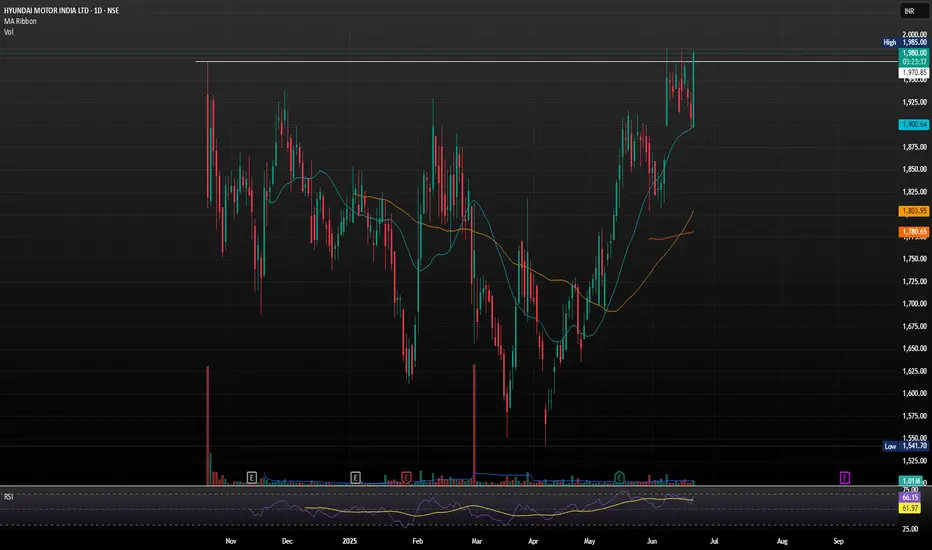
HYUNDAI MOTORS LTD BREACHING ATHHyundai Motor India is one of the leading car manufacturers in the country, known for its wide range of vehicles—from hatchbacks and sedans to SUVs and electric cars. Some of its most popular models include the Creta, Venue, Verna, and the all-electric Ioniq 5.
If Hyundai Motor India has broken past the 2000 mark it may setting their sights even higher. UBS has issued the most bullish call so far, with a target of 2350, citing strong capacity expansion, export momentum, and premium product positioning. Other projections suggest a broader range between 2291 and 2328, depending on market conditions and quarterly performance.
Potential Cup and Breakout in Jubilant Ingrevia 1. Volume Breakout
2. Possible Cup and Handle Breakout on Monthly timeframe
3. MACD signal getting positive
4. RSI above 50

Momentum Trade in Suprajit1. RSI over 70
2. MACD turning green
3. Volume Pop up
4. Breakout above resistance
5. Round Bottom Breakout

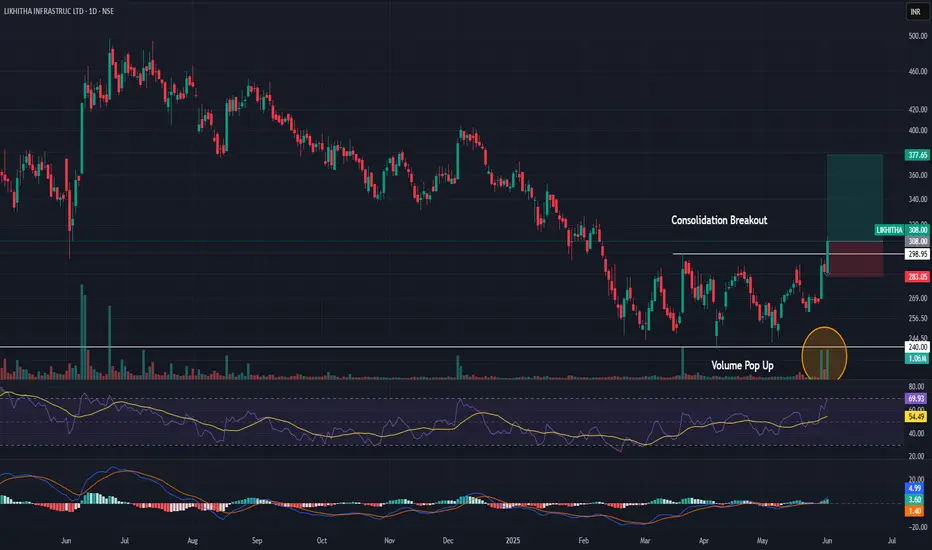
Momentum Trade in Likhitha Infra1. Positive Divergence on RSI
2. Good Volume
3. Consolidation Breakout
4. RSI near 70
5. MACD signal turning green
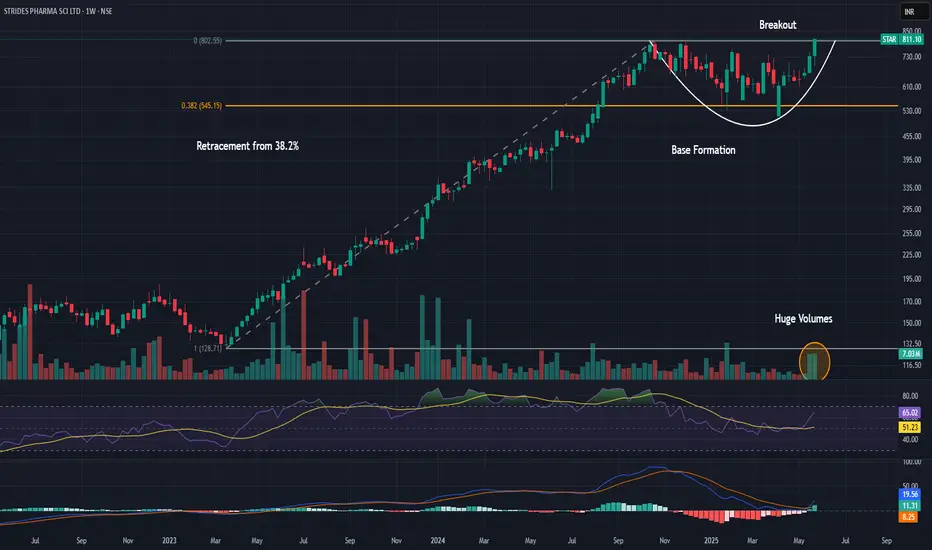
Round Bottom Breakout in Strides Pharma1. Reversal from 32.8% retracement (strong up-move)
2. Good Volume
3. Round Bottom Breakout
4. RSI above 50
5. MACD signal turning green
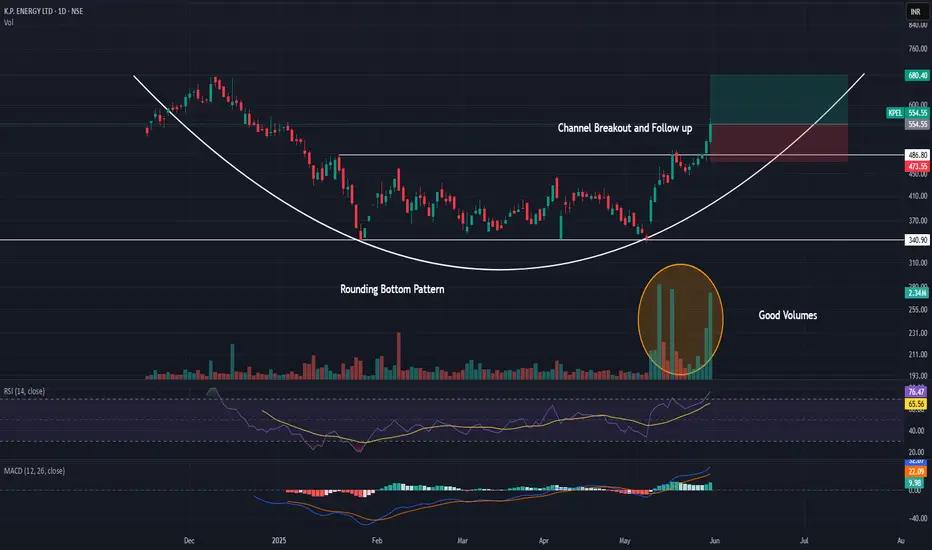
Momentum Breakout in KPEL1. Rounding Bottom Pattern Breakout
2. Channel Breakout and Follow Up
3. Good Volume
4. RSI above 70
5. MACD is green
Momentum Trade in Saksoft Limited1. Reversal from 61.8% retracement
2. Good Volume
3. HH-HL Structure
4. RSI above 50
5. MACD signal turning green

Follow the Flow: Trading with Liquidity ZonesLiquidity is where the market breathes. The Liquidity Zones indicator by BigBeluga helps traders visualize where large players may be hiding orders—revealing the zones where price is most likely to react, reverse, or accelerate.
Let’s break down how this tool works, how we use it at Xuantify, and how you can integrate it into your own strategy.
🔍 What Is the Liquidity Zones Indicator?
This open-source tool identifies pivot highs and lows filtered by volume strength and plots them as liquidity zones —highlighting areas where buy/sell orders are likely to accumulate.
Key Features:
Volume-filtered pivot detection (Low, Mid, High)
Dynamic or static liquidity zone boxes
Color intensity based on volume strength
Liquidity grab detection with visual cues
These zones act as magnets for price , helping traders anticipate where reactions, reversals, or stop hunts may occur.
🧠 How We Use It at Xuantify
We use Liquidity Zones as a contextual map for structure and execution.
1. Entry & Exit Planning
We align entries near untested liquidity zones and use them as targets for exits—especially when confirmed by structure or momentum.
2. Liquidity Grab Detection
When price pierces a zone and reverses, it often signals a liquidity sweep . We use this as a trigger for reversal setups.
3. Volume Context
Zones with higher volume intensity are prioritized. These are more likely to attract institutional activity and generate stronger reactions.
🧭 Dynamic vs. Static Zones
The indicator offers both dynamic and static zone modes:
Dynamic : Box height adjusts based on normalized volume, showing how much liquidity is likely present.
Static : Consistent box size for cleaner visuals and easier backtesting.
Why this matters:
Dynamic zones reflect real-time volume strength
Static zones offer simplicity and clarity
Both modes help visualize where price is likely to “grab” liquidity
⚙️ Settings That Matter
To get the most out of this tool, we recommend:
Volume Strength = Mid or High for cleaner zones
Enable Dynamic Mode when trading volatile assets
Use Color Intensity to quickly spot high-liquidity areas
🔗 Best Combinations with This Indicator
We pair Liquidity Zones with:
Market Structure Tools – BOS/CHOCH for context
Momentum Indicators – Like RSI or MACD for confirmation
Fair Value Gaps (FVGs) – For precision entries near liquidity
This layered approach helps us trade into liquidity , not against it.
⚠️ What to Watch Out For
Liquidity zones are not signals —they’re context . In fast-moving or low-volume markets, price may ignore zones or overshoot them. Always combine with structure and confirmation.
🔁 Repainting Behavior
The Liquidity Zones indicator is designed to be non-repainting . However, due to waiting for pivot confirmation, the zones are plotted in hindsight. This makes it suitable for real-time execution .
⏳ Lagging or Leading?
This tool is partially lagging —it waits for pivot confirmation and volume validation before plotting a zone. However, once plotted, these zones often act as leading levels , helping traders anticipate where price may react next.
🚀 Final Thoughts
The Liquidity Zones indicator by BigBeluga is a powerful visual tool for traders who want to understand where the market is likely to move—not just where it’s been. Whether you’re trading reversals, breakouts, or mean reversion, this tool helps you stay aligned with the market’s hidden intent.
Add it to your chart, test it, and see how it sharpens your edge.

Technical Analysis with Elliott Waves: A Combined ApproachHello friends, Welcome to RK Charts!
This Educational Post is based on technical analysis, specifically how to initiate analysis on a chart, and what points to consider. This is purely for Educational purposes.
This is not a trading or investing tip or advisory. Rather, it's a comprehensive guide on how to easily analyze a chart, intended for educational purposes. I hope that by reading and understanding this post, you'll gain valuable knowledge and insights. Your focused effort to understand this will surely provide you with something valuable and easy to grasp.
Let's dive in, During technical analysis, what we had observed certain points in this chart, I'm highlighting them here:
1. Resistance line breakout, where the price has closed above it.
2. The volume within that breakout.
3. The price closing above Weekly Exponential Moving Averages.
4. Elliott Wave Counts.
5. Projected Target along with Invalidation level as per Elliott Wave theory.
6. Projected Duration for Projected Targets.
Breakout of Resistance zone with Good Volume intensity:
So, friends, here we can clearly see on the chart that this is a weekly time frame chart of Shipping Corporation of India Limited. Over the last eleven months, from July 2024, the price has been falling, remaining largely bearish, but has now broken out of Curved Resistance Trendline for the first time with a bullish candle on Weekly (Closing basis), accompanied by good volume intensity.
Alongside this, the price has sustained and closed above Major EMAs:
- 50-Weekly Exponential moving average (red line plotted on the chart)
- 100-Weekly Exponential moving average (blue line plotted on the chart)
- 200-Weekly Exponential moving average (black line plotted on the chart)
on the weekly time frame.
Elliott Wave Theory:
Considering the Elliott Wave structure, if we look at it theoretically, the top it made on July 2024, was the completion of Wave III. After that, it completed Wave IV in 7 swings (WXY) and is now possibly moving higher, making higher lows. It has closed above the moving averages, broken out of the Curved Trendline, and has strong volume. So, possibly, we are unfolding an impulse Wave V.
In Elliott Wave Theory, the invalidation level means that the price should not go below that level, which in this case is the low of Wave IV at ₹130. If the price goes below that level for any reason, even by a single point, our wave counts will be invalidated, and we'll have to re-analyze the chart.
That's why we call it the invalidation level. Analysts and traders also refer to it as a stop-loss level. So, in Elliott Wave Theory, our wave counts remain valid as long as the price stays above the invalidation level and doesn't trigger it.
Now, regarding the target, if we take the measurement of Wave IV and calculate its 1.236 level, the target for Wave V should be above the high of Wave III. According to Elliott Wave Theory, the projected target for Wave V is near ₹440, which is the 1.236 Fibonacci level.
Projected Duration for Projected Targets:
In the chart analysis we conducted, where we prospectively projected a target, if everything goes right and the invalidation level is not triggered, what could be the duration of this target? It will definitely take more than a medium-term duration, maybe even a long-term duration.
This is because each candle represents a week, and we're currently looking at the weekly time frame. Since the fourth wave has just ended and the fifth wave is upcoming, it will take a long-term duration
I am not Sebi registered analyst.
My studies are for educational purpose only.
Please Consult your financial advisor before trading or investing.
I am not responsible for any kinds of your profits and your losses.
Most investors treat trading as a hobby because they have a full-time job doing something else.
However, If you treat trading like a business, it will pay you like a business.
If you treat like a hobby, hobbies don't pay, they cost you...!
Hope this post is helpful to community
Thanks
RK💕
Disclaimer and Risk Warning.
The analysis and discussion provided on in.tradingview.com is intended for educational purposes only and should not be relied upon for trading decisions. RK_Chaarts is not an investment adviser and the information provided here should not be taken as professional investment advice. Before buying or selling any investments, securities, or precious metals, it is recommended that you conduct your own due diligence. RK_Chaarts does not share in your profits and will not take responsibility for any losses you may incur. So Please Consult your financial advisor before trading or investing.

TBO TEK LTD – 19 May Trendline Resistance Test Incoming 📌 Trade Plan (Aggressive Swing Setup):
Buy above: ₹1,250 (on breakout + volume confirmation)
Stoploss: ₹1,195
Target 1: ₹1,310
Target 2: ₹1,385
Sell Below: ₹1,180 (if price rejects the trendline with high volume)
🔎 Technical Insights:
Strong volume buildup near resistance
RSI trending upwards with bullish momentum
Trendline acting as dynamic resistance since Nov 2024
For Education Purposes Only

SWIGGY MAY DELIVER ON TIME Swiggy's stock has been facing challenges recently, with its share price hitting an all-time low after the IPO lock-in period ended. The company has been struggling with profitability, and its losses widened to ₹1,081 crore in Q4FY25, compared to ₹555 crore in the same period last year. Despite this, analysts remain cautiously optimistic, with 13 out of 20 maintaining a "buy" rating on the stock.
Swiggy's food delivery business has shown strong growth, but its quick commerce segment, Instamart, has been underperforming compared to competitors like Blinkit. The company has been aggressively expanding its store count, but rising expenses have impacted its bottom line. Some analysts believe Swiggy is following a similar path to Paytm, struggling to convert losses into sustainable profits.
- Revenue Growth: Swiggy's revenue has been increasing steadily, with a 45% year-on-year growth.
- Profitability Concerns: The company reported a net loss of ₹1,081 crore in Q4FY25, nearly double the previous year.
- Market Sentiment: Analysts remain cautiously optimistic, with some maintaining a buy rating despite recent stock declines.
- Stock Price Target: The average long-term price target for Swiggy is ₹600, representing an 87.32% upside from its current price.
- Competitive Position: Swiggy continues to dominate the food delivery market, but its quick commerce segment (Instamart) faces stiff competition.
- Market Sentiment: Despite recent losses, Swiggy remains a midcap stock with strong investor interest.
Overall, Swiggy's stock is facing selling pressure, and traders may want to watch for breakout signals before making a move
BUT PERSONALLY I WILL ADD SOME QTY AT CURRENT LEVELS.

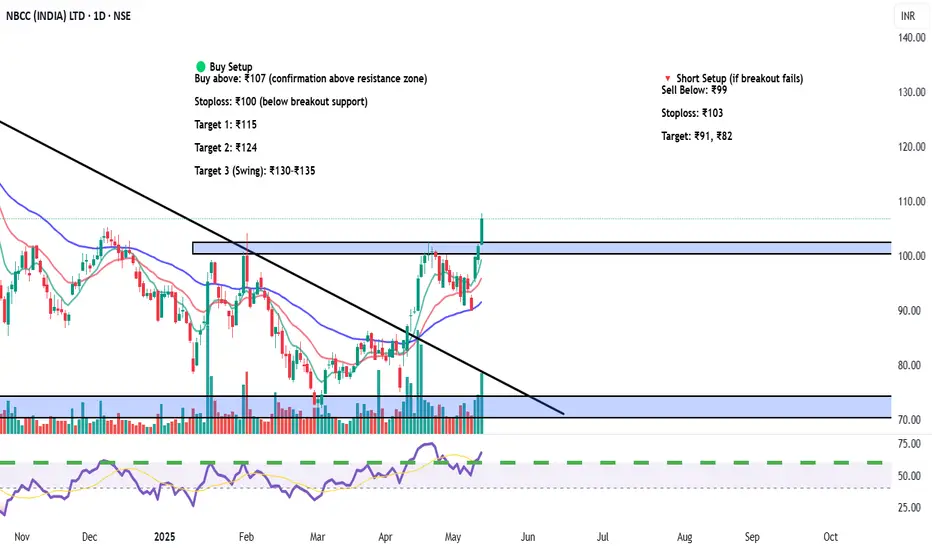
NBCC (India) Ltd (NSE: NBCC) – Breakout Trade Setup🧾 Equity Research Summary – NBCC (India) Ltd.
Sector: Construction & Infrastructure – Government PSU
Technical Setup: Trendline breakout + Base retest + Volume surge
Support Zone: ₹68–₹75
Breakout Zone: ₹100–₹103
Upside Potential: Strong move expected due to order book + infra push
Catalyst:
Government infrastructure spending
Order wins from CPWD, NBCC contracts, redevelopment projects
📅 Timeframe: Short-to-Medium Term (2–4 weeks)
📊 Risk-Reward: 1:2.5
🟢 Buy Setup
Buy above: ₹107 (confirmation above resistance zone)
Stoploss: ₹100 (below breakout support)
Target 1: ₹115
Target 2: ₹124
Target 3 (Swing): ₹130–₹135
🔻 Short Setup (if breakout fails)
Sell Below: ₹99
Stoploss: ₹103
Target: ₹91, ₹82
For Education Purposes Only
SBFC FINANCE Breakout from Long Consolidation | Strong Volume✅ Recommendation: Buy (Post-Breakout Strategy)
CMP: ₹108
Buy Zone: ₹106–₹108 (current price is still within a safe buying range after breakout)
Target 1: ₹120
Target 2: ₹135
Stop-Loss: ₹98 (just below breakout zone)
Risk-Reward Ratio: ~1:2 (ideal)
⚠️ Caution
Don’t chase if the price shoots up quickly from here. Wait for minor dips toward ₹106 to enter.
If price closes below ₹98 with volume, the breakout may fail — consider exiting.
for educational purposes only
