FORD fell after good earnings - now reverses LONGFORD on the 2H chart double topped in mid July and then descended as it had reached
the second deviation line above the mean anchored VWAP. It continued the fall had a bit
of pre-earnings run up and then paradoxically fell with very decent top and bottom line
earnings. If you know why please let me know. After earnings and the fall, FORD reached
the long-term mean VWAP and reversed as can be seen on lower time frames. I see this
as a VWAP bounce, the favorite place for institutional traders to make their trades. A volume
profile and its POC line find the highest trading volumes of the time interval. the MACD
and Price Momentum Oscillators are confirmatory with reversal signals. I will take a long
trade here. The stop loss will be 13 below VWAP. Targets are 14 (25%) 14.5 (50%) and 14.85
(25%). This is a simple trade with $0.25 risk which will be eliminated once price gets
to $13.5 making it risk and stress-free. I have an options trade in mind. Comment if
you want my specifics.
Volumeprofileanalysis

AMSC 57% July rise AI tech ( chips) upcoming earnings LONGAMSC has had a great rise since the beginning of the AI revolution. From the overlay of
the anchored VWAP this would be a VWAP breakout that closed the last trading day
with a correction pullback and then a bounce off the POC line of the volume profile.
The natural stop loss for a long trade is directly under the POC line. As a strong bull run stock,
the MACD just showed another line cross above the histogram. Amplitudes are rising. This
sector is scorching hot. Some will call it overextended and overvalued. Buy weakness - yeah for
sure unless its going to get worse. Buy strength when you determine the probability that
it will go higher. This long trade will not wait for me. I will take it and be watchful
for signs of reversal. I do not think that I will see them anytime soon. With earnings coming
this week and trader interest peaking. I will jump in here and watch for good action.
To be safe I will take off part of the position before the earnings.

Bitcoin Range Breakout - Trade PlanThe volume profile for Bitcoin over the past 4 months shows a key level at around $28,040. Historically, after Bitcoin breaks out of a trading range, it tends to spike up, get traders excited and buying, before crashing back down to retest longer timeframe volume profiles.
We've been ranging above $30,000 for a month now, causing many to forget about this $28k volume shelf. Psychologically, traders get used to above $30k prices. So when the price dives below, it sparks panic selling.
Currently, there is the potential for a short squeeze if Bitcoin spikes up toward $29,300, where there are high short liquidations waiting. This could provide a textbook short opportunity around $28,850.
On the flip side, if the price continues falling, we could see a high volume long squeeze which would lead us to one of the best long trades this year opened around the key $28,040 level.
Either way, keeping an eye on this zone and watching for liquidation spikes will be key. We should be prepared for both scenarios and have a plan ahead of time - either a long squeeze occurs and we look to short around $29,850, or we wait patiently for price to break down to our target of $28,040 to enter a long position.
The market is about to react violently and it will be important to keep emotions in check and remain stoic through the volatility.

UPST mid-term VIEW Pre Earning LONGUPST on the daily chart with 2022-2023 in range shows a downtrend of more than 70% and
now a round bottom reversal. The volume profile shows the high volumes of the high volume
area which is relatively thin and mostly below the current price. That is to say, UPST has a
lot of volume voids to fill on its way back to $162 . The Triple EMA ( 200,100,50) shows
a convergence over a long interval followed by the reversal and now divergence. The
MACD indicator is upgoing as are the trends of the dual RS lines of the RSI indicator. I see
this as a long swing trade or investment while UPST is awaiting earnings next month.
For targets, I plan the red lines generated by the volume profite and so $94 and $161.
UPST is on my current favorite stock list. My current holding includes an option striking $51
for 8/4. I will roll that option over about 8/2 to avoid time decay. Additionally,
I will buy another option striking $75 and expiring on 9/15 costing about $950 at the
market price with the bid/ask spread of about 4%. I expect the combined two call optins
will yield on average 5-7% per trading day and may hold them through the earnings period.
The only downside risk is that an earnings beat is somehow already priced into UPST
and that the momentum will decelerate and fade. Buying the contact cheap and out of
the money seeks to manage that risk.

DISH a TV penny before earnings LONGDISH has earnings on 8/2. On the 2H, price just bounced off the support of the longest of the
three EMAs (35/70/280) and tested the POC line of the volume profile again showing buyer
support at a high trading volume and volatility area. the MACD indicator shows a bullish
line crossover and negative to positive on the histogram where convergence ended and
divergence took over. The dual RSI indicator shows the lower time frame green line in a
dip for a few days and then a rise above the 50 level and the higher time frame black line.
DISH has volume voids above the current price and the near-term pivot high is above. If that
cracks, price momentum could accelerate.
DISH is suitably set up for a long trade as traders anticipate the earnings. I will take it.
I may trade a sizeable trade of stocks or alternatively options striking $8 for 8/11.

OPEN OpenDoor a Penny Real Estate LONGOPEN has earnings upcoming on 8/3. An analysis of the 4H chart with overlays shows
bullish momentum in the set of zero lag EMA lines as well as upgoing anchored VWAP
landlines. Price crossed over the mean VWAP ( thin black) and the POC line of the
volume profile one month ago. The MACD shows bullish momentum since July 24th.
The dual RSI indicator shows the low time frame green line rising and then crossing the
steady higher black time frame line the past trading day and both being at the 60
level.
OPEN is a long trade setup with earnings around the corner. I will take it.

SNOW another technology company tolerating Bidenonomics LONGSNOW on the 4H is seen trending from from earnings in May with the great top line
and okay bottom line with a big uptrend into a sideways wide range channel.
It is now low in the channel but still above the long term anchored mean VWAP which
is the logical stop loss for any long trade setup. Confluent support is the POC line
of the visible volume profile with the upper high volume profile providing the
the expected range of a long trade. The Volume Price Trend indicator
and the MACD are synergistic in their confirmation. Fundamentally, SNOW is in
the AI revolution and its role in streamlining processes and lowering costs for the government
and businesses. The logical target here, the second deviation above mean VWAP presently
at the 193.45 price level. This line pushed the price back down 4 times in the past 8 weeks.
I see the quick 10% upside as good for a long trade knowing well-managed options
trade could produce 100-150% easily in capitalizing on AI software tech and the heavy
hitters of the new NASDAC leading the index higher and faster. What a great concept
more snow while the climate heat wave is unrelenting. I will enter here with a sizeable
stock trade while considering a 10-30 DTE call option to catch the ride toward the
target mentioned here.

UPST ready to run higherUPST on the daily chart is 65% below its highs of March 22 . It rose above the long term POC
line of the volume profile two months ago after a favorable earnings report. Another earnings
will report in a month. There has been very little trading above the current price in the visible
range. This means there is little volume resistance to price rise. Price is presently at the
longterm mean VWAP anchored 16 months in the past and got there by rising from the support
of the line one standard deviation below the mean aVWAP. On the zero-lag MACD, the lines
have first crossed under the histogram and then ascended in parallel above the zero line in
yet another sign of bullish momentum. Lastly, the three in one indicator including money
flow is all green.
I readily conclude that UPST is set up well for a long swing trade targetting just below the
mentioned swing highs and so $160 or so. This would be about 200% while setting a stop loss
at $50. I believe the trade offers a great potential reward to risk and so will open this
position while identifying an entry on the 15-30 minute chart looking for a pivot low.

GOEV a niche EV manufacturer LONGGOEV does not compete with TSLA. It makes special use electric vehicles
including a NASA contract apparently for vehicles to be used upon the return
to moon exploration. As a penny stock, GEOV has weak fundamentals
coupled with high trader and investor interest. Large capital institutions
have a predominant portion of the shares.
On the 15 minute chart. GOEV trended up from July 14th to Ju;y 19th and
then down to about the same price as before then trend. This was a range
of 50% demonstrating the typical high volatility of penny stocks. Based on
a set of anchored VWAP bands originating in mid- April, GOEV is currently
near the mean long multi-session VWAP. Since many shares are held by
institutions this is a price level where trading volume and volatility are
expected.
I will take a long trade here. The stop loss is the recent swing low at $0.59
with a target at $0.737 just below the POC line of the related
volume profile from an entry-by-limit order at $0.613 making for a projected
profit of 20% with a much lower risk. For chartists who follow chart patterns,
in the interval under analysis, GOEV fell from a head and shoulders pattern.
My target is the neckline of that pattern.
GOEV benefits from the general interest and trading volumes in the EV sector
at large as well as its niche with little competition.

📉🛢️ Crude Oil Technical Analysis: Bearish Setup in Focus 📈🐻🚨 Oil traders, exciting times ahead! A compelling bearish opportunity has emerged in the 4-hour timeframe. The price of Crude Oil has recently encountered a crucial supply zone, where a strong rejection was formed.
Adding to the bearish outlook, the RSI indicator reveals a bearish divergence, supporting our thesis for a downside move.
As traders, you have two strategic options to approach this setup:
1️⃣ Enter a short position right from the supply zone, utilizing the proven supply zone strategy to capitalize on the rejection and potential decline in price.
2️⃣ Exercise patience and wait for a breakdown of the trendline, which will provide additional confirmation to the bearish scenario before initiating your short position.
For both approaches, the first take profit level awaits at approximately 73.50, and our ultimate target stands at 71. This is a significant level where a large pool of orders is anticipated, making it an attractive target for taking profit.
Feel free to share your toughts in the comments section, follow me for updates and don't forget to press the like button if this insight was helpful !🚀

NFLX builds more momentum LONG for nowNFLX has been trending up for three weeks. If the trend is getting old it is now showing.
Based on a set of two anchored VWAP bands originating June 1 and June 15, Netflix is
breaking through VWAP bands from the lower -2 standard deviation lines to the +2 standard
deviation lines and nearly the third upper deviation lines. This is a clear and convincing
VWAP breakout with buyers in overwhelming control Trading volume today is about 4 or 5
times the running average and about 1M. Volume support for price action is obvious.
The dual time frame RSI shows 1 hr TF RSI (blue line) shot up crossed over the daily TF RSI
(black line) and is retreating a bit. The daily RS is below 80 and still trending up.
The MACD shows a classical bullish momentum pattern with the lines well above the histograms.
Overall NFLX has the risk of overextension and possible topping with a fade afterwards.
The mass index indicator shows a value into the reversal zone but until the value rises and the
drops to 26.5, the trend is still intact. I will take a long trade here, hoping for a quick
5% ROI between now and the end of the week and about 50% on an options trade with
a strike of $500 expiring July 28th which I will close upon a confirmed reversal and use
the profits realized therefrom to buy a put option to take a ride down.

AGQ- A Silver on steroids ETF LONGAGQ a leveraged ETF of silver and its futures, spent mid-March to mid-April on a great
uptrend from which it pivoted down in a 50% Fib. retracement which took two months
to complete. After a bit of consolidation and sideways channeling, it has finally launched
into bullish continuation as shown on the daily chart. The Lorentzian AI machine learning
indicator printed a buy signal today as it reacted to a green engulfing candle crossing the
mean VWAP anchored from the pivot low of mid-March. This indicator has extreme accuracy
in its signals as demonstrated on its tables. On the MTF RSI indicator, the low TF RSI has been
riding above the higher and crossed the 50 level one week ago. The zero-lag MACD is
confirmatory. Overall AGQ is ready for a swing long trade which I will take. I will zoom
into a 30-60 minute time frame and look for a pivot low from which to enter. My target
is the line showing two standard deviations above the anchored mean VWAP presently
about 36.3 representing at least 20% potential upside and profit. The stop loss will be
narrow with the price presently at the mean VWAP and POC line of the visible range
volume profile I will set it at 29.85. ( The risk to reward is approximately 1:40 )
DYODD !

DPST- Banks will thrive if rate hikes are over LONGDPST is shown here on the 15- minute chart- This triple leveraged bank stock hit
a double bottom in late June and early July with a double bounce from the lines one
standard deviation below the mean VWAP lines anchored at pivots in mid-May. These
lines provide dynamic support and resistance unlike vertical lines from pivots. From
the VWAP breakout, price has crossed over the mean VWAPs and is not at the level of
the volume profile's POC line and the one standard deviations above the mean VWAP.
The two time frame RSI indicator shows the lower time frame rising from below 20
to over 50 and crossing over the higher black line TF RSI is for me a clear and convincing
sign of bullish momentum in its extreme form.
Fundamentally, bank stocks are gaining in the federal news data regarding CPI and PPI.
Based on this analysis, I will take a long trade here targeting the second deviation lines
at about $70.5 representing about a11% upside in one week or less.

JNUG- Gold is Going Higher ( LONG)Gold is rising and so also JNUG the triple-leveraged junior miner ETF which has components
of miners that have the most to benefit from rising. On the daily chart, price dropped from
a winter pivot high with a head and shoulders pattern into a trend down with a bounce off
the lows in early March followed by a YTD pivot high in mid April followed by a trend down
into the July 4th holiday where the reversal from the low into the current price movement
is supported by the MTF RSI indicator showing both the low and high TF RSIs crossing the 50
level. The zero-lag MACD shows the histogram going negative to positive simultaneously
with the K /D lines crossing from underneath and beginning to rise. Importantly the Lroentzian
machine learning AI indicator using a variety of indicators and factors printed a buy signal
earlier this same trading day. I will go long in a swing trade expectant of great profit. I can see
that price is approaching the long term mean VWAP and has crossed over the POC line of
the lower high volume area. The target of 43.2 is the POC line of the upper high volume
area confluent with the first standard deviation above that mean VWAP and also the neckline
of the H & S this past winter. The analysis is strong from the confluences and so
expectant of 15-20% profit.

AUDUSDThe tight space between important levels of Aussie makes it so hard for me to open medium-term trades.
I suggest if you are not into short-term trading avoid decision making before breaking of the two levels.
After breaking the stronger levels I'll expect an almost sharp move.
The United States CPI announcement could be a fuel to a level-breaker market move.

UAL United Airlines Pre Earnings LONGUAL has been in a persistent trend up for a couple of months after great earnings were reported
in early May with another due on July 19th. The airports have been quite busy with vacation
travel and UAL has been part of that action. On the 1H chart, price has been supported by
the mean VWAP and has oscillated to the one standard deviation line above that. I see a target
as 56.80 where the the second deviation lines above the mean aVWAP while placing a stop loss
just under the blue line of one STD above VWAP. The price is below the POC line of the volume
profile which should act as a magnet pulling the price higher. The MACD indicator shows 4
the lines in parallel and above the zero horizontal line with a positive histogram. The relative
volatility indicator shows sufficient volatility to support momentum trading.
I will take a long trade going into earnings. I will do this with ten call options contracts
with a strike at $57 expiring on July 21st. On the last trading day, this contract had
a low of $ 0.95 and a high of $1.32 for a range of 35% in a single day. I expect similar
price action as the earnings date approaches. I expect to pay about $1320 for ten contracts
and the profit expectation is 100% over the next 10 trading days.

Can USD/JPY rally through this 300-pip liquidity gap?Divergent monetary policies between the Fed and BOJ have allowed USD/JPY to extend its bullish trend on the daily chart. Whilst the Fed are very close to their terminal rate, they have to keep the threat of further hikes on the table to tame inflation expectations. When coupled with the ultra-easy policies of the BOJ, we've seen USD/JPY return to its cycle highs.
However, the current resistance level around the November high marks the lows of a ~300-pip liquidity gap - and such areas can see prices move swiftly through them if revisited.
Soft US inflation data last November sent USD/JPY aggressively lower on the day, and left the liquidity gap to potentially be filled. The question now is whether bulls can persist and send prices within it, which could see USD/JPY head for the range highs around 145.
Of course, a building threat for bulls to keep in the back of their mind is that Japan's Ministry of Finance or the BOJ could become vocal about yen volatility to spook JPY bears. But until then, we prefer to buy dips on the daily chart or seek bullish continuation patterns on lower timeframes.

GBPUSD : The most likely scenariosI can imagine three different scenarios for GBPUSD.
Set different TP points and entering condition in order to reach best money management possible.

NQ Futures Hitting June 22nd LevelsCME_MINI:NQU2023
With the help of USA news release during NY session, price action reached the upper highly traded levels of June 22nd
Trade Well
Trade Smart

UNG continues to rise UNG the ETF that tracks natural gas futures has continued on a significant uptrend since June
1st The 2H chart suggests to be that the trend will continue this upcoming week. UNG is now
above the POC line of the long multi-session volume profile. UNG has had support from the
VWAP line representing two standard deviations below the mean. In recent days, price has
crossed that mean VWAP in a sign of bullish momentum. The volatility oscillator indicator
is showing bullish volatility while the RSI is high above 80 and staying there without any fade
to suggest bearish divergence. Overall, I will continue to run my position without any partial
take profit. My target is the VWAP line that is two standard deviations above the mean
anchored VWAP and so presently about 7.85. Any new trade would have the same target
while setting the stop loss just below the POC line.

Is UADUSD turning down?UADUSD rose over 6% since the end of May. Can it go higher? Analysis on the 2H chart suggests
that it cannot. It is presently deep in the resistance/demand zone as delineated by the
luxalgo indicator. A long mult-session volume profile shows the high volume area fairly s
symmetrical about a POC line which roughly corresponds to a 50% Fibonacci retracement of
the uptrend which occurred from May 31st to June 16th. On the MACD the lines have crossed
and are trending down. I can easily conclude that the pair is likely to retrace. I will take a
short selling forex trade.

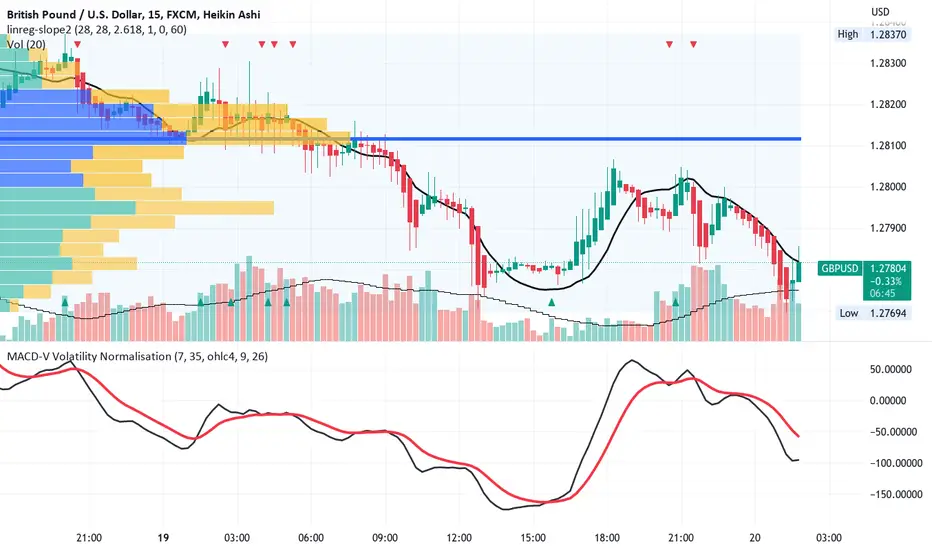
GBPUSD possible reversal from a double bottomWith recent Bank of England actions it makes sense the GB pound might strengthen a bit.
On the 15 minute- chart, the pair appears to be rising from a double bottom far below the
high volume area of the multi-session volume profile. On the MACD indicator, the MACD line
is downgoing but appears to be curling toward a reversal and is considerably below zero.
Overall, I will take a long forex trade with moderate leverage targeting 1.281 which is below
the POC line of the volume profile and so the value where the greatest volume of trades
took place recently. The stop loss is the pivot low at 1.2772.
EURUSDEURUSD is Bullish in the big time frame, but first some imbalances need to be filled, and as price break previous structure we can take this good opportunity.
