CAD/JPY: Short entry triggeredHey guys,
Just wanted to share the trade I took this morning, it's on CAD/JPY.
I have spotted a strong divergence on volumes as price was going up.
My short entry was triggered and I am targeting now the bottom of the structure.
Even though we are above the cloud on higher timeframes I believe the pair is overbought and is currently pullingback.
We've got high impact news this afternoon so I don't think I will keep the trade if it doesn't reach my target by then.
*** Trade at your own risk ***
Volumes

ETH can't keep this trend up! Here's why I believe that.The panel on the left shows you an ETH chart, and the one on the right shows you the RSI and volume.
RISK: MEDIUM
I personally don't see ETH going back up, it wouldn't make much sense for it to keep going up without at least a tiny drawback, considering that it isn't driven by anything in particular to go up, the volume seems to be not corresponding with the current, rapid upwards trend.
Leave your opinion on this in the comments and I'll make sure to go through all of them.

AUDCAD Explained Analysis!Sorry for the poor speaking quality, this was my first ever video analysis, so don't expect to much.
Anyway, the AUDCAD is in a perfect zones parallel channel, so please wait for a confirmation before buying this.

USDJPY short now! - DEC/JAN 2020Hello everyone, as we can see there is a key volume level near the support zone... I suggest to short now and take profit in 1 moth maximum.
Happy trading to all!

BTCUSD - W - Ready for the breakout?Price is compressing in a triangle pattern, volumes are decreasing meaning that we are almost ready for the breakout.
RSI shows a downtrend and the continuation or breakout of that dynamic resistance, with high volumes, may be the hints we are looking for.
1st scenario:
RSI continuation of the downtrend and breakout of the price downwards.
First TP@7390
2nd scenario:
RSI breakout of the downtrend and breakout of the price upwards.
First TP@16200

S&P500 short at brake of support 2635, targeting POCif price brakes the very important support of 2635 will resume bearish trend enter short trade.
I want to see it brake Pivot P first, in S&P500 (not SPX) this is at 2634
Stop Loss at recent high 26442
Target at POC from 17th of Jan 2605

S&P500 short on Savius Slope rider strategythe slope rider signal has fired on the 15' chart.
today markets are stuck in a range due to all the news that came out in the past days.
Keep Stop Loss above last high in price at 2720 (ESZ8 price, not SPX500).
Take partial profit at 2702: very high volumes here yesterday.
Target 2686: the last unmet Point Of Control from 28th of Nov.

GOLD Long ONLY if breaks above Pivot PGold is signalling a strong divergence in 3h 1h and 15' chart.
But the bearish trend from yesterday was too strong to ignore.
Price is bouncing off Daily MA 52 and 104.
I will enter a long order when price breaks above and close a candle above Pivot P.
Target to R1.
Stop will depend on chart, below previous low should do.

GOLD short on Slope RiderGold seems to be holding at the top of the Regression Band
Slope rider has signalled 3 candles for diversion already.
1226 is a strong volume level that may be holding, my stop loss is above that.
Stop Loss is a tight 10 ticks.
Target is at S1 for a very high reward.
tomorrow is Thanksgiving in the US so price may just not be moving anymore...who knows...
don't take high risks today!

#GUP - BUY opportunity - 300% potential#GUP - BUY opportunity - 300% potential
Vol increased, bullish triangle, end of correcrion
BUY: SL 0.00003634
TP 0.00014223
SL 0.00002400


IOTA: IS THE HIBERNATION OVER?After a huge bearish phase, the price has generated a simmetric triangle that is to be seen as the result of the congestion of the fluctuations. Both R.S.I and Stochastic haven't reached the overbought zone. However, I suggest paying attention to possible bearish crosses in the aforementioned second oscillator. The breakdown of the support or of the triangle resistence will give rise to a strong directional movement. This one will be matched with a growth of the volumes which have been flat so far. That fact means that the trade is facing a contraction and reload phase, then entering a high volatility area. We may get surprises.

BTCUSD - good opportunity to buyHi, friends.
It's funny to read different analysts prediction about the price of $3000 per 1 BTC or $25,000 per 1 BTC. The real fact is that no one knows this. We do not have to guess what the price will be in the future, we must to trade the present, the current market conditions and enter into the market in the same direction as Big guys (Smart money, Big Money, whatever).
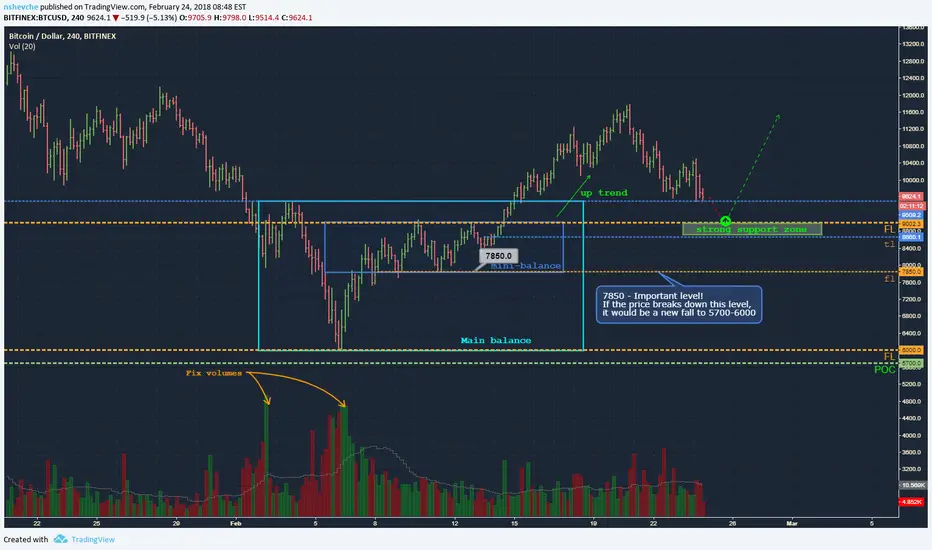
The structure of the market is the same as 100 years ago. First - the price accumulates in a wide corridor, and then goes into a trend. When the large players close their positions (fix), then and a new consolidation begins. It's a cycle.
What we have now on BTCUSD?
Bitcoin is in the uptrend. Now there is a correction wave to the upper balance level.
We can open buy position in support zone 8660-9000.
If the price breaks down 7850, that would be a bad signal for BTC and with a high probability we will see a new fall wave to the lower main-balance level 6000.
NZDUSD 4H Chart.Watch price if breakout , buy that , however RSI overbought and low volumes so careful

AUDJPY 4H Chart.Maybe ShortEven if triangle brokeup , price testing resistance , low volumes , divergence , expecting that to drop if it doesn't break the resistance

Bitcoin: Wyckoffs Accumulation Phase E coming soonEdit: In the text inside OBV, there is a mistake, it was meant to be written "to last ST". Sorry for the mistake!
An objective of the Wyckoff Method of technical analysis is to improve
market timing when establishing a speculative position in anticipation of a
coming move where a favourable reward/risk ratio exists to justify taking
that position. Trading Ranges (TRs) are places where the previous move has
been halted and there is relative equilibrium between supply and demand.
It is here within the TR that campaigns of accumulation or distribution
develop in preparation for the coming move. It is this force of accumulation
or distribution that can be said to build a cause which unfolds in the
subsequent move. The building up of the necessary force takes time and
because during this period the price action is well defined, trading ranges
present particularly good trading opportunities with potentially very
favourable reward/risk parameters. To be successful, however, we must be
able to correctly anticipate the direction and magnitude of the coming
move out of the trading range. Fortunately, Wyckoff offers us some
guidelines and models by which we can examine a trading range.
For more about it click the source: www.hankpruden.com
Inspired by CapnOscar's linked chart below.

Bears hidden ahead.Today this stock ran up for +6.37%, which is quite strong movement for any stock. But important moment about this run are volumes, which were extremely low, especially for such a strong movement.
Above there is strong resistance "cushion" between $8.5 and $9.3, which was broken on 01/23/2014 with highest ever volumes, so this one would be strong resistance.
I would suggest gathering of short position starting around $8.50 and higher with stop between $9.5 and $10.
