The last downward wave remainsThree upward compound waves have been completed, and two out of three corrective bearish waves have been made, and one last wave remains, and the corrective decline ends and a new ascent begins.
Volumespreadanalysis

A big corrective wave is comingFive bullish historical waves have been created, and we are at the end of a fifth wave, and three bearish corrective historical waves are in progress.

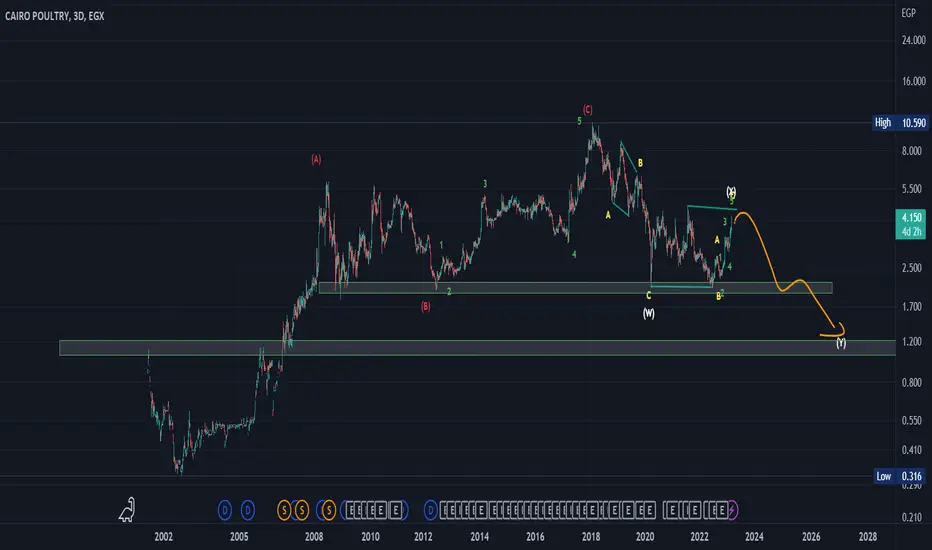
Head and shoulders formationFive historical upward waves were created, after which three corrective waves followed for this rise, and two waves were completed, and a final downward wave remains in order to end the correction and start a new rise.. Let us see

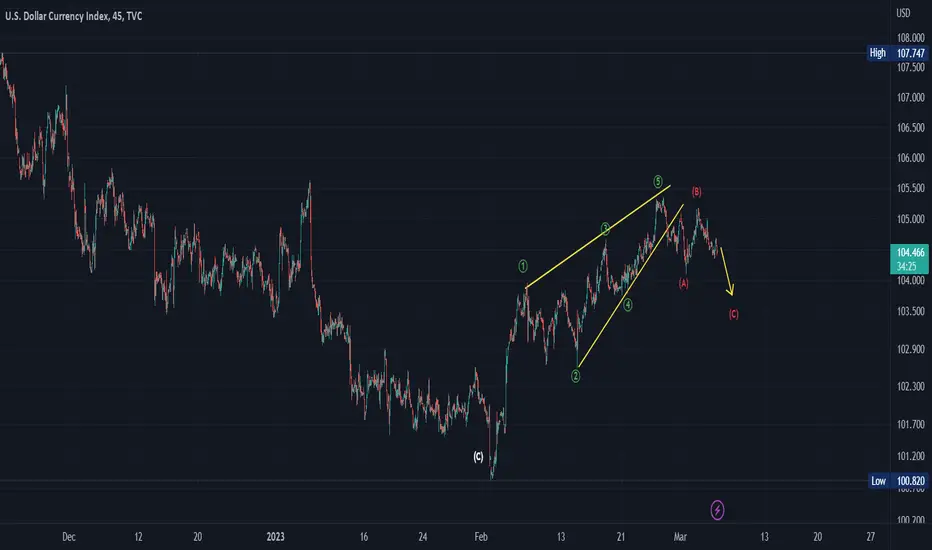
Landing expectedA historical compound rise was made in three waves, followed by a historical correction in three other waves, and we are currently in the second wave nearing its end, and a third and final wave will descend in order for the historical correction to complete and a new impulse to rise at that time.
ETHUSDTIt is expected to drop to the shaded area to close the Wi-Fi wave, waiting for a severe drop that will take the alternative currencies with it

simple lesson in volume analysisWe are waiting for the effort downside bar to break this area and open a strong bearish trend to end the third downside C wave

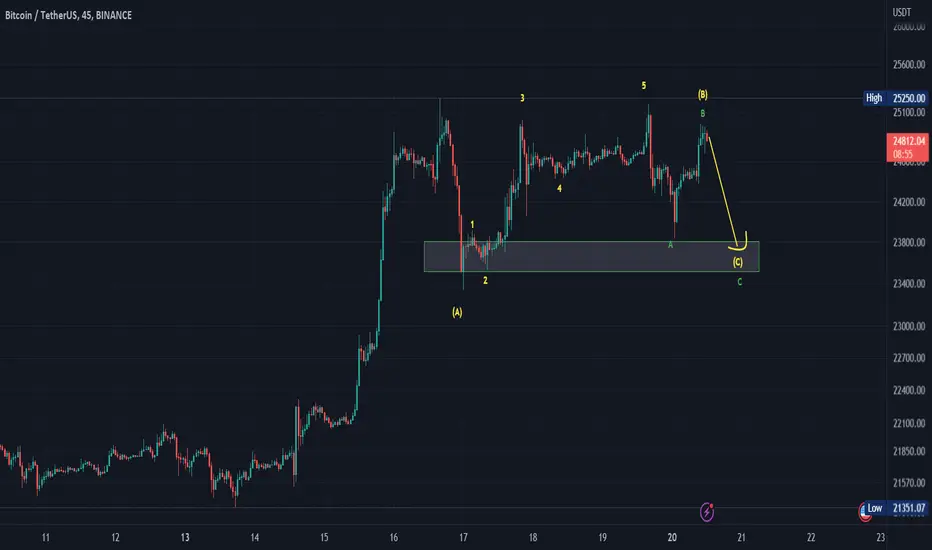
Another Bitcoin analysisBitcoin is moving sideways for a period of time, and this could be a discharge, and it will be a fourth wave, and it breaks the bottom, a simple fracture, and then goes up again, a corrective rise ... so let us see the end of the correct scenario
Note: The old basic scenario is attached, and the new data is expected to give us the correct scenario

correction and then upA first wave has been created, and it is a leading Diagonal. Currently, a triple correction of the first wave is taking place. When the correction ends, it will continue to rise again.
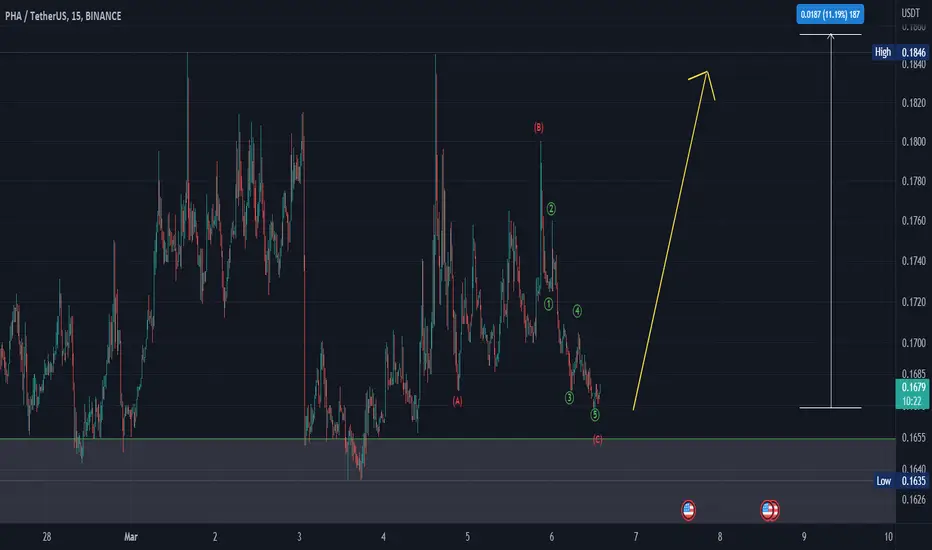
On track to rise above 11%?An impulse wave was formed with a high volume, and a three-wave correction was made, so wait now for a final impulse upward, so let us see
Is it possible to visit the 2300 regions one last time?From my point of view, the coin will make an upward correction before resuming the decline again .. And what I see is that it came down in the form of a corrective decline + a positive divergence, so let's see what will happen

FLSY - Anatomy of a "Good" tradeHi All,
This is just to share on how I would approach a trade (as a trader).
1. Look for signs that the stock is forming a bottom (rounded bottom, inverted Head and Shoulders, Adam and Eve),
rising above 200 day MA, Golden Cross etc.
2. Check out its longer term charts (ie weekly and monthly) as you will likely see a clearer picture of it's direction.
3. Wait for some triggers (eg breaking above neckline especially on strong volume).
FLSY is a good example and had presented several good opportunities for several short term trades recently (could be held for longer term if one had entered earlier around 12.36 (1st Entry in chart) and didn't get stopped out.
1) On 2nd Feb (Initial Breakup), it gapped and broke up above this neckline (as well as it's 200 day MA), everything looks good except volume was just above average.
Well, this initial break up failed! Yes, it happens more often than we cared for, especially during the earlier phases of the trend, hence a conservative trader would prefer to wait for a pullback and long if the neckline proved to be a support.
2) on 13 Feb (1st Entry), FSLY once again gapped above the neckline and 200 day MA, but this time the volume was HUGE. However, this was prior to earnings announcements (2 days later, AMC). There is a possibility that earnings beat had been leaked, so if one decide to enter this trade, then it would probably be wise trade small.
3) on 16 Feb (2nd Entry), the day after earnings, which beat expectations (surprise surprise...LOL), many traders will FOMO into the stock especially as it rose above the previous candle's high around 14.20. This turned out to be a very profitabe trade (intraday).
Next day however, it formed a "Harami" candlestick (aka "inside bar"), showing indecision at this point. I would raise the stop to 15.30, slightly just under this "Harami" candlestick (which is already a 11% SL from its high @ 17.18). Those with a larger risk appetite could raise the stop to entry price (ie 14.20), allowing for larger volatility which could stop one out prematurely but be prepared to give back all profits if wrong.
4) FSLY had a steep pullback after all (due to poor market sentiment during the whole month of Feb) and found support only at 61.8% of it's large AB up swing. This was also within a prior "Resistance" but turned "Support" zone. It began to form small sideway candles (a signal to long if it starts to break above this "consolidation" range)
5) We had a Long trigger again last Friday (3rd Entry) as the stock started to rise decisvely above the consolidation high @ 14.20.
It turned out to be a large candle day, hence I would place initial stop loss just below this large candle (ie 13.55, a 5% initial SL).
There is a good chance this stop will not get hit (although nothing is guaranteed LOL).
Uptrend is underway for FSLY (above 200 day MA, with the shorter MAs (20 and 50) both rising. However, it could still experience large swings along the way and one has to manage the trade and raise the stops from time to time to protect profits. Just because one is stopped out does not mean the stock is spent. Sometimes it could be just periods of consolidation (short or long periods). Keep it on your watchlist as long as the stock has not shown signs of bearishness on a higher timeframe, set alerts for the next trigger.
Disclaimer: Just my 2 cents and not a trade advice. Kindly do your own due diligence and trade according to your own risk tolerance and don't forget that money management is important! Take care and Good Luck!

Is it possible to drop 30%?I see that on a 15-minute timeframe, it finished five downward waves, and indeed it made three upward waves, so it is supposed to make other downward waves for the specific support areas. Let's see

A downward trend is comingThen it made three bullish corrective waves and showed the beginning of weakness. It is expected to drop again, five times below its last bottom, and go to the shaded support area .. Let us see
Today's view on NASDAQHi Traders,
This is my view for today on NQ.
Just a little bit uptrend for today just to reach possible BEARISH reaction zones.
Target around 11870.
I remind you that this is only a forecast based on what current data are.
I really hope you liked this content and I would like to know what do you think about this analysis, so please use the comment section below to give me your point of view.
Pit, Trading Kitchen
DISCLAIMER:
Trading activity is very dangerous. All the contents, suggestions, strategies, videos, images, trade setups and forecast, everything you see on this website and are the result of my personal evaluations and was created for educational purposes only and not as an incentive to invest. Do not consider them as financial advice.
———————————

Live Trading: Price and Volume AnalysisThrough this live trading analysis on price and volume, we are looking at how we took these 2 live trades by a 3 step process analysis using time frame correlation and the 2 bespoke indicators, SMI and VSA.

breaking area test?A strong upward trend has been broken, and a triple corrective action is now being made on the broken trend. It is possible that it will be a test for the breakout area, and then it will return to complete the downward trend? .. let's see

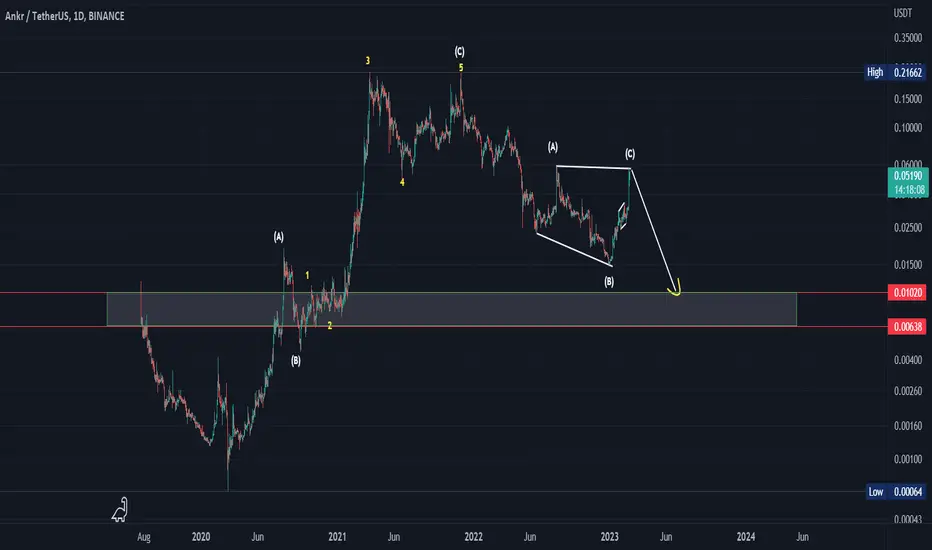
Beware of deception.. corrective riseFive waves rose, then three waves fell, and three more waves rose. This is not a motive behavior, but rather tends to a corrective rise. What is expected is a strong decline that ends this corrective behavior, so let us see.

100% up from here?It is possible that we will see a strong rise to the area specified above for the completion of wave C, and then another decline begins

$QOM Shiba Predator🥂🍾🎆QOM is the Shiba Predator, it is a community token whose function is to flip the Shiba Market cap.
The price of Shiba Predator (QOM) is $0.000000059116 today with a 24-hour trading volume of $1,065,853. This represents a 8.80% price increase in the last 24 hours and a 20.10% price increase in the past 7 days. With a circulating supply of 600 Trillion QOM, Shiba Predator is valued at a market cap of $35,347,787.

btcusdtperpCurrently, this short position can be taken, which is not very interesting for me, but it is a little profitable

AMD - uptrend underwayAMD had a classic breakup (of both a neckline and its 200 day MA) on 1st Feb and then subsequently did a retest back to near it's breakup level on 10 Feb. The retest brought it close to but did not violate the "neckline" before it began to rebound rather strongly again last night. This served to validate that the neckline has now turned "support".
I would go Long with an initial stop loss about $1 below its recent pivot low @ 80.40, and trail stops up at intervals to protect profits.
Disclaimer: Just my 2 cents and not a trade advice. Kindly do your own due diligence and trade according to your own risk tolerance and don't forget that money management is important! Take care and Good Luck!

Big drop coming?My view on the Weavers is that we are at the end of the remaining ascent, a small sub-wave is completed, and from which a large triple decline begins
