WATCH OUT❗ BearRally Correcting Overleveraged MarketsHi Traders, Investors and Speculators of the Chart📈📉
Ev here. Been trading crypto since 2017 and later got into stocks. I have 3 board exams on financial markets and studied economics from a top tier university for a year. Daytime job - Math Teacher. 👩(will be moving to corporate some time in Jan 2023)🏫
Bearish market rallies are meant to look like bottoms - shaking many holders out of their positions. This is because Stop Hunting Algorithms flourish here, hunting out your stop losses with wicks and volatility. In this short analysis, I explore the Total Cryptocurrency Market Cap in depth, using Technical Indicators such as the Bollinger Bands, Volume and Phoenix Ascending.
A formidable resistance zone is currently at 1T for the TOTAL chart, and I would only consider a reversal if we can CLOSE a WEEKLY candle ABOVE 1.1T ⬆ In other words, remember to take profits during a time of upward price action.
IMPORTANT XRP and XLM update coming tomorrow, stay tuned and follow 👀
_______________________
📢Follow us here on TradingView for daily updates and trade ideas on crypto , stocks and commodities 💎Hit like & Follow 👍
We thank you for your support !
CryptoCheck
Volumespreadanalysis

TSLA ready to bounce fastTSLA is probably one of the most famous bubbles that we had in this last bull market. Yes, it's probably one of the future car companies and more, but it was extremely overpriced.
Few months ago the algorithm showed a marvelous Head and shoulders pattern which usually predicts the end of a trend.
This october we had a confirmation of the break of this pattern and then we projected the price objective (black).
The price objective for a head and shoulders pattern is calculated by taking the distance between the head and the neckline (in the case of a top) or the shoulder line (in the case of a bottom) and projecting it downward (in the case of a top) or upward (in the case of a bottom) from the point where the neckline or shoulder line is finally broken. This distance is then added to (in the case of a bottom) or subtracted from (in the case of a top) the breakout point to give the price objective.
Consequently, the price objective for this pattern is between the range of 100-110$ where we also see previous volume and support and resitance levels in the 108$ zone. This worked fine and seems that it started bouncing. We should see the price rallying to 150 or even a bit more if the bounce is hard enough.
Anyway, if the price is back to the 100-110$ range seems a nice moment to buy with low risk and a potential fast return. Take care, this is not yet a bullish reversal for the long term trend, so we could see lower prices in the future but seems a great moment to take advantage of this pattern.

EWY Bullish IdeaLong idea for EWY South Korea ETF. Bullish impulse wave to 66.50 - 68.80 could be possible after actual range.

SOLUSDTFrom my point of view, this ascent is a deceptive ascent. It is only a final test for the fracture area, including a decline again. Caution is required, and do not be deceived by this ascent.

DXYIt finished three downward waves and made an ending daigonol, so it is expected to rise and retest its last peak, from which we will see the reaction. Will it break with another new peak, or will it be a false break and return to the decline again

NIKE SHORTA historical third wave has ended, and its length is less than one historical wave, because the extension occurred in one wave. Currently, we expect that wave 4 will be made in any area of the above, and then a fifth wave will be made that will be less in height than wave three, so that wave three does not become the smallest of waves, of course, according to the rules Eliot

NIKE SHORTI think that the decline has not ended yet and it still has to descend to the shaded area in order to end its decline and start a new upward wave
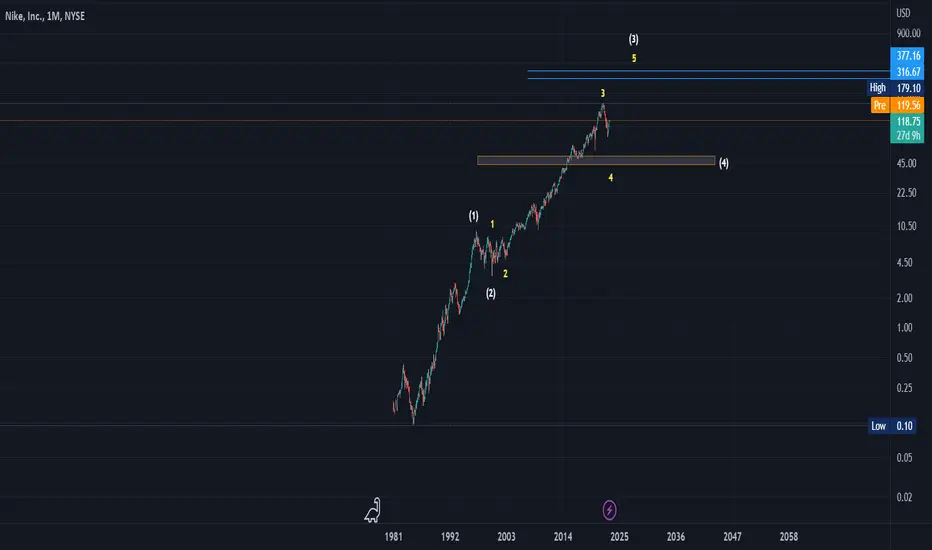
Four wave downA historical third wave has ended, and its length is less than one historical wave, because the extension occurred in one wave. Currently, we expect that wave 4 will be made in any area of the above, and then a fifth wave will be made that will be less in height than wave three, so that wave three does not become the smallest of waves, of course, according to the rules Eliot

It will fall in the long runWave A has been completed, and wave B corrective is ending, and it is a triangle consisting of five small corrective waves inside, and then wave C remains in an upward motive trend

💎 Analyzing the Various Shapes of Volume ProfilesVolume Profile is a tool that shows how much volume (i.e. the number of trades) is happening at different price levels for a given asset.
It is used by traders to analyze order flow and make inferences about market direction, support and resistance, and potential reversal areas.
The patterns in a Volume Profile may appear random at first glance, but there are certain recurring shapes that can be used to make predictions about the market.
🔵 P-Shaped Volume Profile
A P-shaped Volume Profile is a chart pattern that typically occurs when a market experiences a sharp rise followed by consolidation.
The lower part of the P-shaped profile represents low volume rejection, while the wider upper part shows an increase in trading activity at a "fair" price.
These patterns are often seen during uptrends, but can also indicate the end of a downtrend and a potential short covering rally, which is seen as a bullish signal.
🔵 b-Shaped Volume Profile
A b-shaped Volume Profile is a chart pattern that forms when a market experiences a sharp decline followed by consolidation.
It is the opposite of a P-shaped profile and is often seen during downtrends. The upper part of a b-shaped profile represents low volume and an "unfair" perception of price,
while the wider bottom part shows an increase in trading activity and a balance between buyers and sellers.
If a b-shaped profile appears during an uptrend, it could potentially indicate a reversal. These patterns are generally seen as bearish signals, as they often represent longs exiting the market.
🔵 D-Shaped Volume Profile
A D-shaped Volume Profile is a chart pattern that occurs when there is a temporary balance in a market. The Point of Control (POC), which is typically located in the center of the profile,
indicates an equal number of buyers and sellers. Some traders view a D-shaped profile as a sign of a choppy or sideways market without a clear direction,
while others see it as an opportunity to anticipate a potential breakout in either direction as institutional players build up their positions.
🔵 B-Shaped Volume Profile
A B-shaped Volume Profile is a chart pattern that occurs when two D-shaped profiles appear within a specific time period. It is characterized by a single value area and Point of Control (POC),
although some traders may divide the profile into two separate "D-areas" with their own value areas. B-shaped profiles are generally seen as a continuation of a trend,
but it is important to note which POC is more dominant, as this can indicate whether activity was highest at the top or bottom of the profile.
👤 @algobuddy
📅 Daily Ideas about market update, psychology & indicators
❤️ If you appreciate our work , Please like, comment and follow ❤️

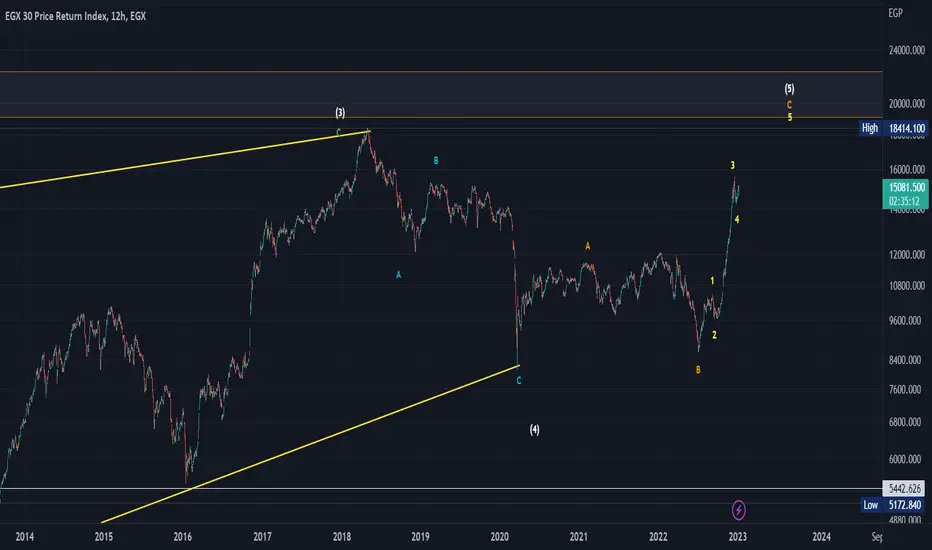
EGXThere remains the rise of a final and final impulse wave, and thus the EGX indicator will be making historical bullish waves and making a leading Digonol pattern.
Another analysis ETHBTCIt is possible to ascend to a final ascending wave, given that it is now forming a triangle after a previous ascending impulse wave, and this indicates that a triple bullish wave, from which it will be drained into another strong decline

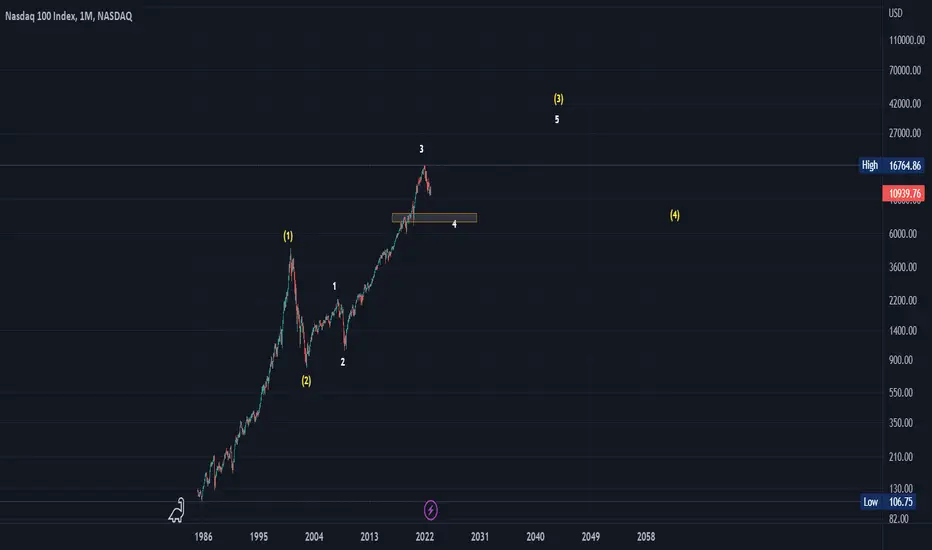
full analysis NDXThe final drop is expected for the shaded area to close wave 4, including an assembly of the rise of a sub-fifth wave
ILMN - inverse H&S breakupILMN has broken up of an inverse H&S neckline last Friday on relatively strong volume.
Let's see if the stock can make a more decisive move to the upside in the coming days.
Otherwise it could continue to be choppy pending earnings release (expected on 3rd November). In any case, it looks like the bottom is in with this base formation
Disclaimer: Just my 2 cents and not a trade advice. Kindly do your own due diligence and trade according to your own risk tolerance and don't forget that money management is important! Take care and Good Luck!

full analysis DFMGIThe UAE stock index.. It is expected to rise to the last small wave to close wave C of a larger model, which is X, including a drop again to the historical bottom in the form of a triple Y.

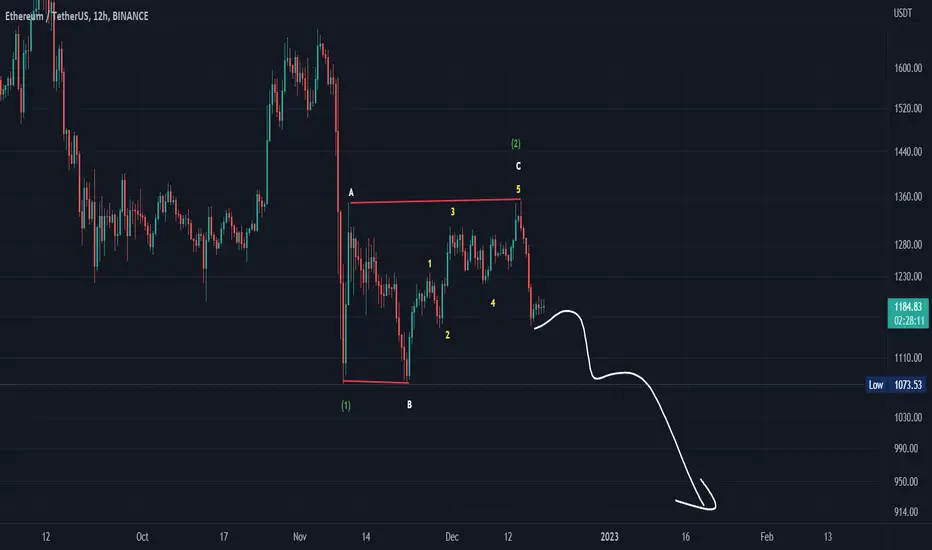
ETHUSDTDrainage is expected in this occasional way, because it came after breaking an important area, then it takes time to drain, and then it completes the decline in this way, so the Ethereum chart becomes very negative
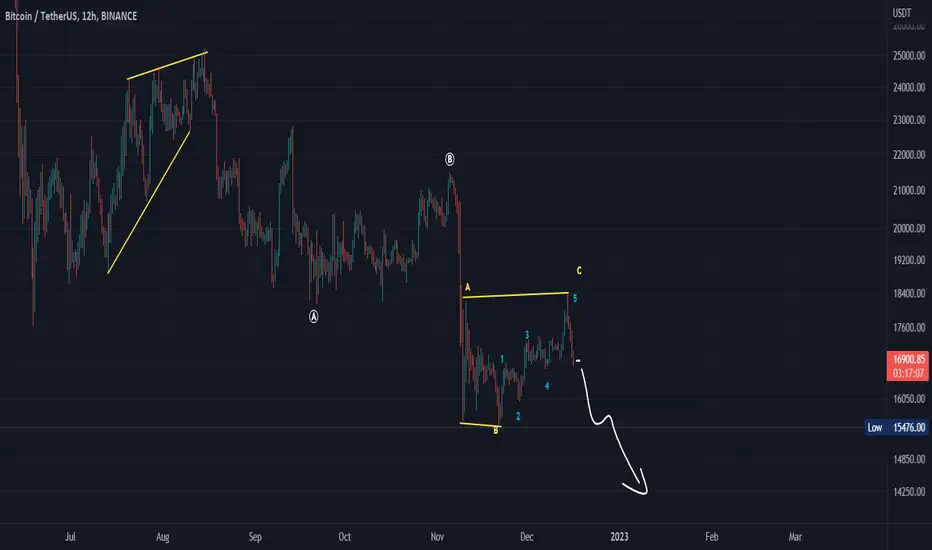
BTCUSDTIt has completed three small internal waves, ascending correction, which will complete its downward targets again
SOLUSDTIt is expected that the decline has not ended yet for this currency, and there are support areas that you must visit, and it is the five-dollar area. We will see if this suffices or descends to the next support for it

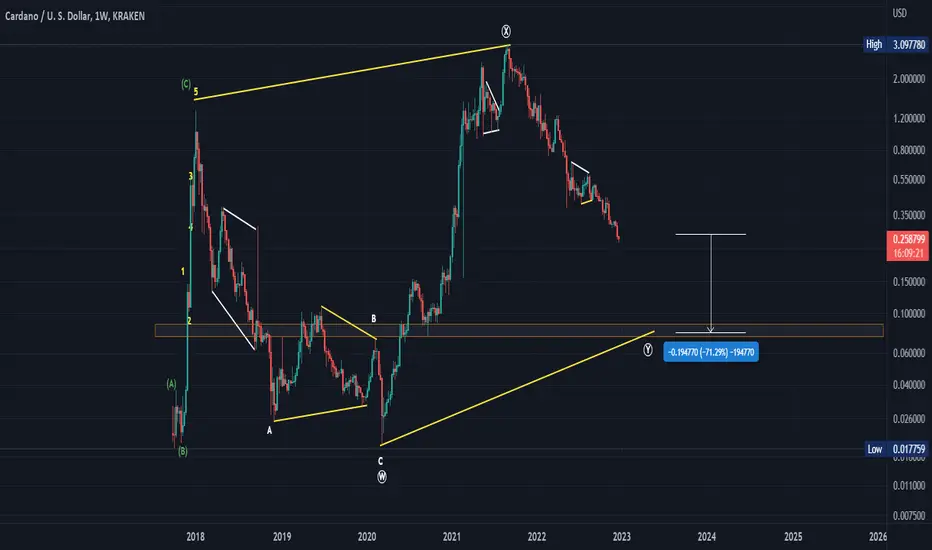
ADAUSDTThe Cardino is expected to fall to the area specified below, to close the bearish C wave, and thus it will end three historical bearish waves that extend over the five years of correction.
ADABTCThe Cardino is expected to fall to one of the two areas specified below, to close the bearish C wave, and thus it will end three historical bearish waves that extend over five years as a correction.

USD JPY SHORT SETUP (VSA STRATEGY)In the chart you can see that USD JPY has break the support with increasing volume and going to retest that support (now resistance ) with low volume and it is better opportunity to sell that pair because it is giving now best risk and reward ratio.

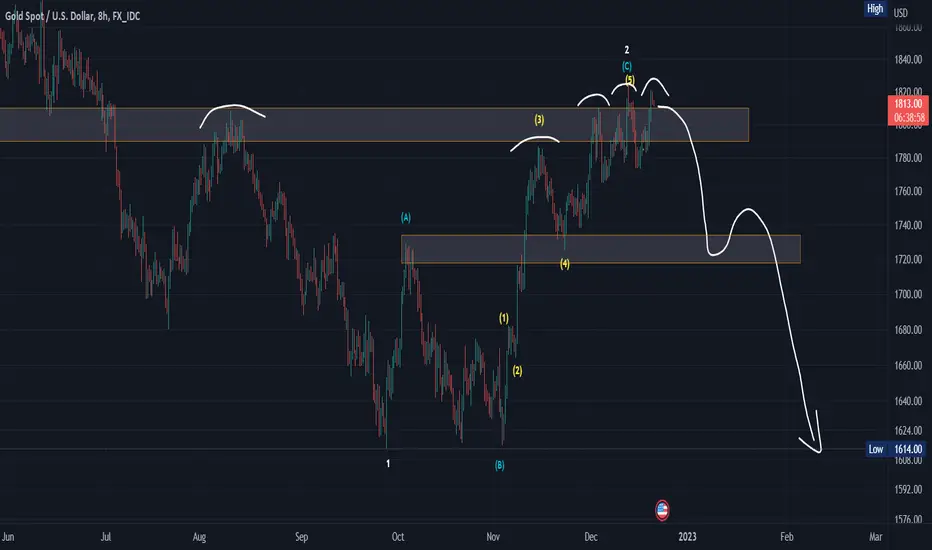
XAUUSDThe area has been tested five times and fake peaks have been made that cannot break upwards, and every time weakness appears in this area, it is expected that this rise will suffice as a two-wave correction and it will start to fall to break support after support