GOLD. Daily Timeframe overview with Initiative AnalysisHey traders and investors!
Daily Timeframe
Market phase : sideways. Seller's initiative.
Boundaries marked with black lines.
Gold followed an alternative scenario from the previous review toward 3435. The buyer played out the 8-9 vector of the range on the daily timeframe, and now the initiative has shifted to the seller. The seller's targets are 3245 and 3201 — areas to watch for potential buy patterns aiming for a new ATH. The price might get stuck in the 3293–3271 zone. If a strong buyer reaction occurs, a reversal may happen in this range.
The ideal area to look for buy patterns is around 3201.
Selling is risky.
This analysis is based on the Initiative Analysis concept (IA).
Wishing you profitable trades!
Volume

SRAD Breakout SetupLets see if this can push out of this range or not
SL 22.8
TP1 25.9
TP2 26.74
TP3 28

ETH Long TradeLooks bullish here for continuation
Futures are higher on holiday
Order flow neutral to bullish

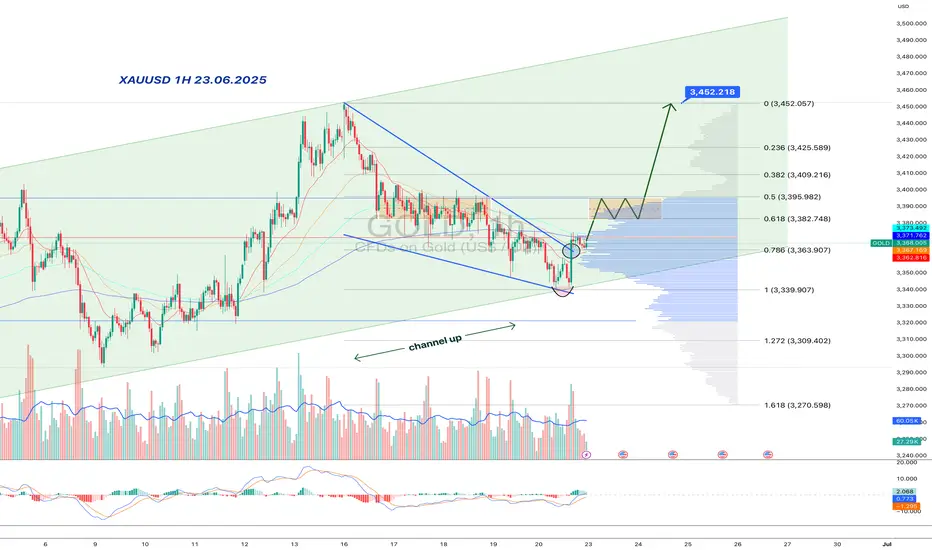
Gold:bullish wedge inside a rising channel-double trap for bearsInside the major upward channel, gold formed a falling wedge — and, of course, faked a breakdown. But the move reversed quickly: price reclaimed the wedge, surged on volume, and held above the key 3363–3368 area. This isn't just a bounce — it's a structural reclaim in line with the broader trend.
Price is now in the upper part of the rising channel and has broken a local downtrend line, reinforcing the bullish signal. Consolidation around 3380–3395 might be the last pause before acceleration. Above that lies a volume gap — no resistance until 3452.
MACD is flipping bullish, RSI turning upward, and volume confirms smart money presence. Classic: trap below, breakout above. As long as 3363 holds — longs remain in control.
Bullish flag on $mstr, consolidating under supply tooNASDAQ:MSTR is in a flagpole position, a bullish one. The measured move target would be $700
Do you agree that MSTR is in a bullish stance?
I guess this really come down to how bitcoin does.

EURUSD -> Bullish Idea 22/06/2025(ICT x Volume Profile)OANDA:EURUSD 🎯 Bias: Bullish
🕒 Timeframe: H1 primary, H15 confirmation
Happy sunday traders!
Following President Trump’s strikes on Iran, I expect an initial bearish reaction in the Asian and London Sessions, then a bullish reaction in the NY sessions as sellers push the USD lower. However, the prevailing trend context remains bullish: the hourly chart has shifted structure (MSS) and broke structure to the upside. I anticipate a liquidity sweep below the recent lows, before a retracement into the 15-minute fair value gap (FVG) which aligns with the volume profile, then continuation higher to target the weak high and into the swing highs marked.

BTC MACRO PLAY - SHORT TRADE SETUP📉 BTC/USDT SHORT TRADE SETUP – WEEKLY TIMEFRAME
🔍 Trade Idea Overview:
We are seeing a bearish divergence between price and volume on the weekly chart — while price makes higher highs, volume is decreasing, signaling a potential reversal or weakening trend.
Further confluence is seen with the VMC Cipher indicator. If a red dot prints, it will confirm the short entry. If not, the trade idea should be abandoned.
📊 Trade Plan:
Entry Zone: Around $106,300–$107,000 (wait for confirmation)
TP 1 🎯: $102,000
TP 2 🎯: $97,500
TP 3 🎯: $93,000
🛑 Risk Management:
Stop-Loss: Above recent highs at $111,800 (or adjusted based on your entry)
⚠️ Disclaimer:
Once TP 1 is reached, move stop-loss to breakeven to protect capital and eliminate risk.
TP 3 may never be reached, but it remains part of the plan to capture extended downside if momentum continues.
If no red dot prints, there is no confirmation — be ready to abandon the trade.

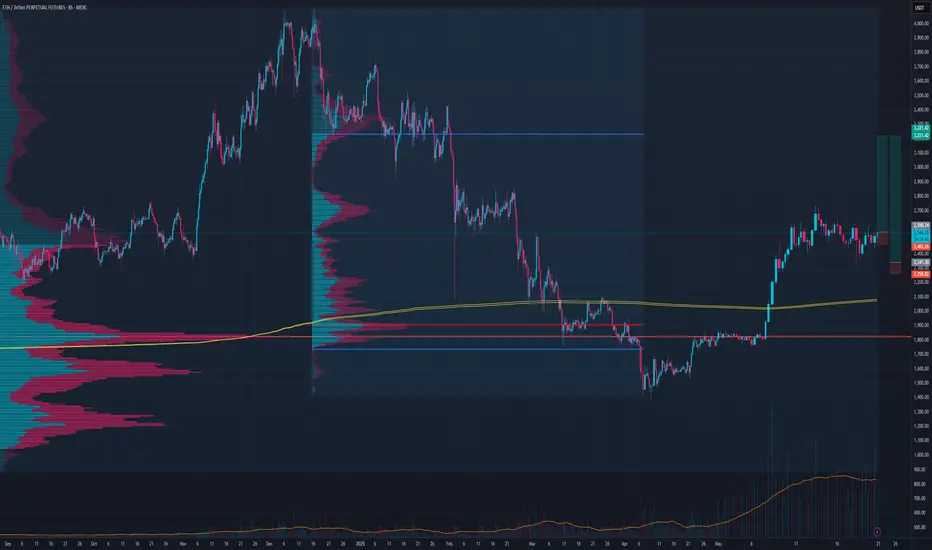
Ethereum – 1D timeframe overview with Initiative AnalysisHey traders and investors!
The price has reached the lower boundary of the range. There is no volume spike.
I expect a further decline toward 2184 and 2100. The 2100 level is a contextual area to look for buying patterns.
As part of a correction, the price could potentially drop to 1800. Monitoring.
This analysis is based on the Initiative Analysis concept (IA).
Wishing you profitable trades!

Swing the TORNTPOWER (NSE)🔍 **Technical Analysis Summary:**
✅ **Trendline Support:**
* The weekly chart shows a **well-respected ascending trendline** stretching from early 2023.
* The current price action at ₹1,390 is approaching this **long-term support zone**, which has consistently provided **bullish rebounds** in the past.
* Price action continues to form **higher lows**, confirming a structurally bullish pattern.
📊 **MACD on OBV (Volume Strength Indicator):**
* The **MACD applied on On-Balance Volume (OBV)** is showing early signs of **bullish divergence**.
* This is particularly important as OBV integrates volume with price movement, and **MACD crossover at low levels** typically indicates accumulation and **potential trend reversal**.
* A bounce in OBV would further confirm strength backed by **smart volume participation**.
⚠️ **Caution Point:**
* The recent candles have shown some **indecision and consolidation**, indicating market participants are awaiting a catalyst.
* **Global cues or negative macroeconomic factors** could temporarily break the trend, but unless a strong bearish breakdown with volume occurs, this trendline remains **technically intact and valid**.
---
💡 **Investment Thesis:**
TORNTPOWER is currently trading near a **strong, multi-touch ascending trendline** that has provided reliable support for over 18 months. The **MACD on OBV** is hinting at a **volume-backed trend reversal**, suggesting a **bullish bounce is likely** if macro sentiment remains neutral or positive.
🎯 **Trading Strategy:**
* **Entry Zone:** ₹1,370–₹1,400 (near the trendline support)
* **Stop Loss:** Below ₹1,300 (on weekly closing basis)
* **Upside Targets:**
* ₹1,550 (short-term resistance)
* ₹1,750+ (medium-term target if the trend continues)
🧠 Final Word:
This setup offers an attractive **risk-reward ratio** for swing traders and positional investors. Technicals favor a bounce — **stay cautious on macro cues**, but the **structure favors accumulation on dips** near the trendline.

BTC 4H SCALPBTC/USDT Scalp Setup – 4H Chart
Entered a scalp position with TP1 aligned at the Fibonacci extension near 105,652. The first take-profit has been secured, and the remainder of the position is being left to ride — no emotional attachment. If invalidated, the trade will be abandoned without hesitation.
Technical Overview:
Price broke out of the local downtrend channel
Watching for a potential green dot on the volume oscillator to confirm upward continuation
VMC Cipher B shows early signs of a shift; confirmation is still pending
That said, short-term caution is warranted.
Bearish Considerations:
On the higher timeframes, there’s a visible bearish divergence between price and volume — price continues to push higher, while volume fades, indicating a potential trend exhaustion.
Thanks for your support.
If you found this idea helpful or insightful, feel free to leave a like or comment, open to your thoughts and perspectives.

BTCUSD 1D | big consolidation
🧠 1. Pattern and Market Structure Identification
✅ Trend and Pattern: Bullish Flag
• Structure: Price forms a descending consolidation pattern (descending channel) after a sharp upward impulse — this is a classic characteristic of a bullish flag.
• Breakout volume occurred from the consolidation zone near the green support area → an early signal that bulls are active.
• However, the price is currently retesting the breakout area and is testing the demand zone again.
📊 2. Volume Analysis
• Volume spikes (purple arrows) occurred at several key points:
• Initial breakout
• Support retest
• High volume during the breakout = valid breakout confirmation.
• Currently, volume is slightly declining = a signal of consolidation and possible accumulation.
📉 3. Support & Resistance Levels
• Strong Support: 96,961 USDT (marked by the blue line and breakout volume).
• Major Resistance: 111,980 USDT (all-time high and projected target from the flag breakout).
• Current Price: 103,272 USDT → sitting between these two key levels.
🎯 4. Potential Price Direction
Bullish Scenario:
• If the 96,961 USDT support holds, price could continue upward → the bullish flag target = projected height of the flagpole.
• Conservative Target: 111,980 USDT (ATH)
• Aggressive Target (if ATH breakout occurs): 115,000+ USDT
Bearish Scenario:
• If price breaks below 96,961 USDT with strong volume, it could invalidate the bullish pattern and drop further to the 92,000 – 90,000 USDT range.

SMCI – Wedge Breakout Triggering Around 46 ZoneNASDAQ:SMCI – Wedge Breakout Watch with Intraday Setup Potential
Super Micro Computer ( NASDAQ:SMCI ) is working on a wedge breakout, and it's pressing right into the key $46 zone — the trigger area for a clean move higher.
🔹 Wedge Structure Clearing
Price has been compressing into a wedge, and it's now testing the upper trendline.
The $46 level is the key breakout point — if it clears and holds, this could unleash serious momentum.
🔹 Intraday Setup Developing
If NASDAQ:SMCI can hold this level intraday and consolidate, I’m watching for an entry signal right at or slightly above $46.
Volume confirmation will be key here — watching the tape closely.
🔹 My Trade Plan:
1️⃣ Entry: Watching for clean hold + setup at $46 zone.
2️⃣ Stop: Below yesterday’s low — keeps the trade tight and risk defined.
3️⃣ Add: If it breaks $46 with volume, I’ll build into the position.
Why I Like This Setup:
Breakout from compression = potential expansion
Clear risk level, clean structure — everything I want in a breakout trade
If it holds this level today, this could turn into a trend day.

BIG PUMP ON GRASS COIN THAT NOONE TALKS ABOUTGRASS is setting up for a major reversal from this falling wedge structure. After a prolonged downtrend, price has now reached the apex of a well-defined descending wedge, supported by a key ascending trendline. This area is shaping up as a high-probability buy zone.
On the chart, we can see price respecting both wedge boundaries and now reacting to the lower support line. This is a classic setup where breakout potential increases significantly. The compression of price action inside the wedge suggests a strong move is imminent.
Looking at Market Cipher B, momentum is showing a clear bullish divergence. Multiple green dots have printed on the oscillator, and money flow, while still negative, is beginning to curve upward. These are early signs that sellers are losing control and buyers are stepping in with strength.
Volume has also dried up on this last leg down, which is typical in wedge structures before a breakout. Low volume near support and divergence on a trusted indicator often marks the beginning of a trend reversal.
From a risk-reward perspective, this setup offers a strong opportunity. A break above the descending resistance could propel price toward the previous key resistance levels around the $3.40 zone. Always place your take profit just below major levels to ensure execution.
Leave your thoughts in the comments. Are you long here or waiting for confirmation? This is not a trade setup, no stop-loss or take-profit is shared publicly. Trade with discipline and confidence.

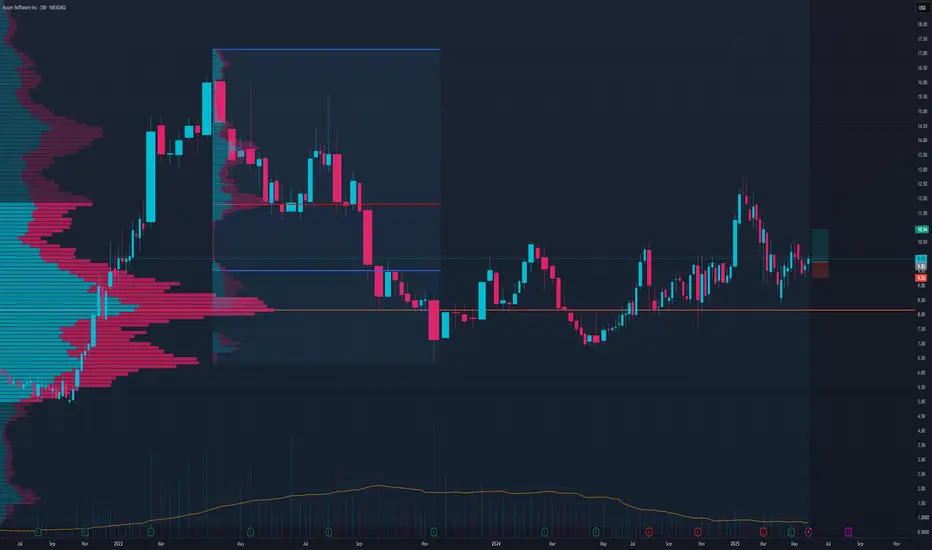
High volume nodesprice bouncing between until we will see a push out of value to a new level, high or low, we will see

XAU/USD (Gold) – Educational Chart Breakdown [1H Timeframe]We’re currently observing a consolidation phase just below a well-tested resistance zone (~$3,377), while price remains supported by an ascending trendline — a classic setup where structure tightens before a significant move.
Two Potential Outcomes:
Bullish Case
If price closes convincingly above $3,378 with strong volume, we may see a continuation toward the $3,400–$3,410 zone. This would confirm the resistance break and shift market structure bullish on the 1H chart.
Bearish Case
Failure to break above resistance may lead to a reversal and a drop into the $3,345–$3,355 demand zone — especially if price loses the ascending trendline. This would reflect a liquidity sweep and continuation of the larger corrective move.
Patience is key — wait for confirmation before taking action. Consolidation often precedes expansion.

INDU - Long trade - Stop loss hunted by smart playerINDUS Motors stoploss hunted by some very very smart player yesterday :)
Brought down to 1685 level and then brought it up to just over its Fib 0.786 level.
It is taking support from its SMA20 level and a golden cross is about to happen next month.
This is the best time to hold onto it (my personal opinion, not a buy / sell call).
It requires patience though. This stock is not for impatient. As per my last analysis of INDU, its targets are minimum 3200 to 3500 (May go further upwards).
Moreover, it is a very good dividend stock. Ideal for long term investment.
Liquidity sweep can also be observed in last two days ;)

WEAT on the move?Wheat futures (ZW) have cleared a zone of resistance with a 4.6% one day move. As tracked by the WEAT ETF, current price seems to be heading for a retest of the 200 Daily SMA (currently at $4.90). The 200 Daily SMA has reversed previous attempts to break out in October 2024 and February 2025. Will third time be different?
Note that this ETF reached a high over $12 in 2022 when the Russian/Ukrainian war started.

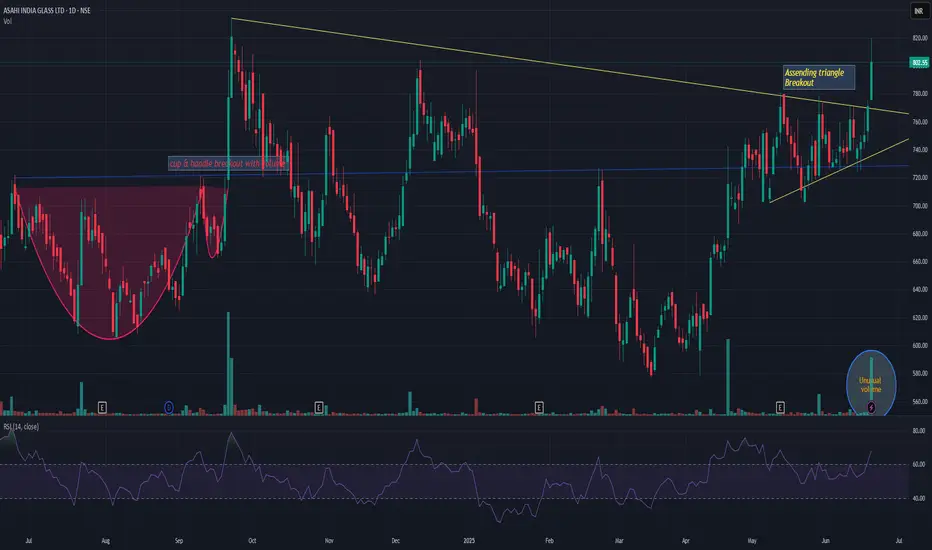
ASAHIINDIAASAHIINDIA has given symmetrical triangle breakout with unusual volume. Already took a momentum. Now as long as it is above upper channel line, i believe the momentum will continue till 980-1000 levels. Keep it on radar.
ASUR LongThis sector is bullish at the moment
Entry below 10$ at market open is preferred
TP 30%-65% at 1/2 Risk to reward and leave partial open
SOFI Long TradePreferred entry here or lower on market open
TP1 14.85
TP2 15.45
Feel free to let partial open after

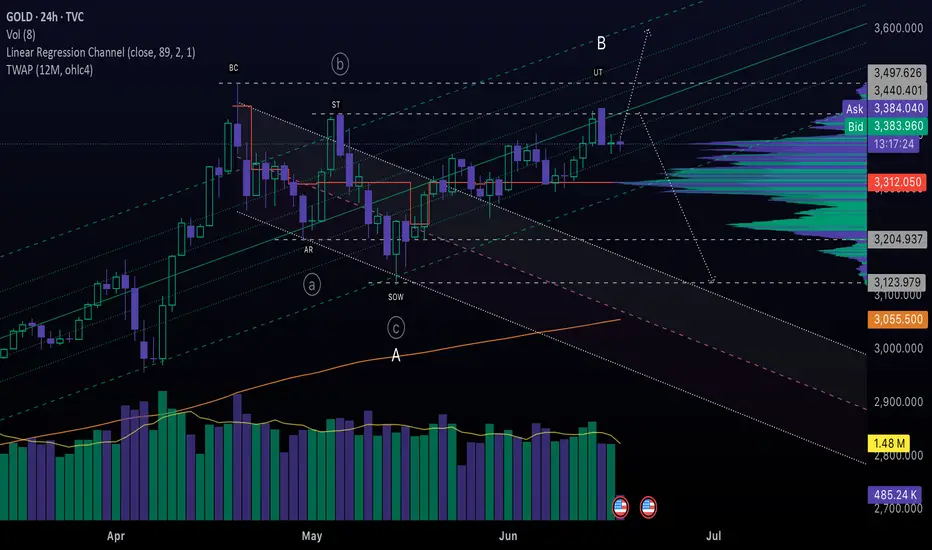
Mixed Signals On GoldIt’s been a while since I’ve posted an idea and for anyone who follows my posts, unfortunately I timed my trades poorly with the bearish pivot so I have taken a step back, and am now seeing some interesting developments happening in the market.
For now, I’ll keep it brief. I wanted to post a quick analysis on TVC:GOLD ahead of the rate decision using elements of the Wyckoff method and Elliott Wave. If you asked me a month ago where I thought Gold was heading, I would have said ATH - and while that can still happen, I’m seeing weakness on today’s chart that is worthy of attention.
For starters, The A wave established the pullback in a typical 3-wave pattern that mostly stayed within the channel. The bullish breakout was tested twice, so I would interpret it as bullish - however the subsequent flat movement and rejection at resistance suggests that the rise from May 14th could be losing steam.
The current price ($3,382) is at a neutral level. From here, we could see several scenarios play out; a false bullish breakout, a true bullish breakout, or a break below the channel to retest demand. Breaking out of the channel could signal a Change of Character (CHoCH), and could indicate that smart money is distributing in a flat pattern. If the price breaks down key level of support would be at the Sign of Weakness (SOW), which has confluence with the extended lines of the Wave A channel.
If Gold is set to rise to ATH, I still think it will need to pull back to find large buying volume in the middle of the Wyckoff channel (white rays) first. We will see what happens today, but it’s starting to look like the bears may have the upper hand here.
How to Find Day Trading Momentum Plays...In this video I show the screener I use in order to find my momentum day trading setup. If you have any questions feel free to ask. Hope you enjoy!!
