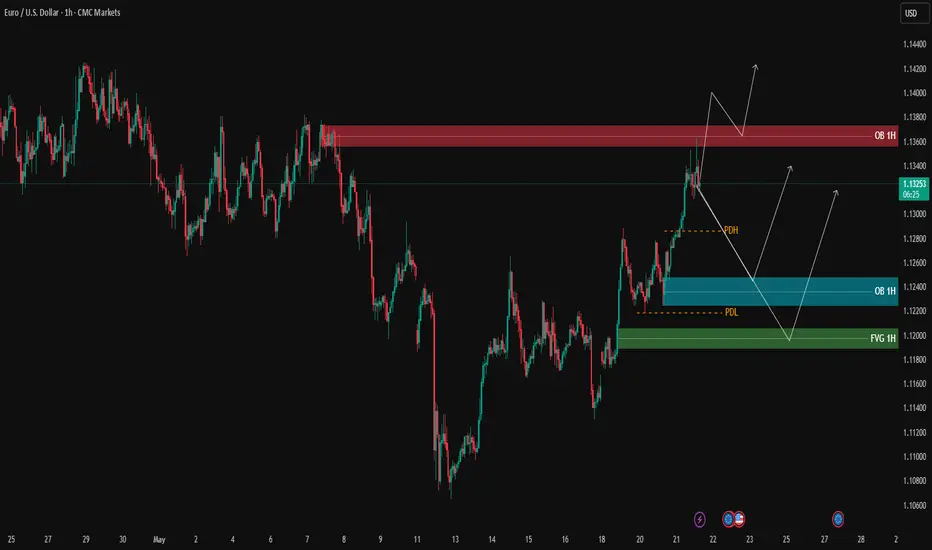
EURUSD – Testing 1H Supply Zone, Awaiting Confirmation | ProfitaAfter a strong bullish rally breaking previous highs, EURUSD is now reacting to the 1H supply zone (OB 1H) marked in red.
We’re seeing an initial bearish rejection from this zone. If sellers maintain control, price may retrace toward the lower demand areas:
Blue OB 1H zone (1.12200 – 1.12450)
Green FVG 1H further below
However, if buyers manage to push price above the red OB and close a candle above it, continuation to the upside remains a valid scenario.
📌 Key Levels
🟢 Support Zones:
1.12200 – 1.12450
1.11780 – 1.12000
🔴 Resistance:
1.13500 – 1.13800
⚠️ Note:
Watch for lower-timeframe (M5/M3) confirmations for entry. Only act on clear setups inside the zones.
🔍 Insight by ProfitaminFX
Volume
HIMS Corrective Wave PullbackLooks like HIMS started its corrective wave pull back. The MACD is about to cross the signal to finish wave B, it most likely will close the gap above. Then I expect it to pull back to around the .5 & .618 fib around $40-45 range where I also there is confluence with the AVWAP from the April 7 pivot around $45. I plan to add in this range before the next leg up.

GOOGL Long HereCouple setups to long here
Wider stop loss is safer while tighter stop loss give 1:5 risk to reward
Half % risk of trading account or less on tighter stop loss play is prudent


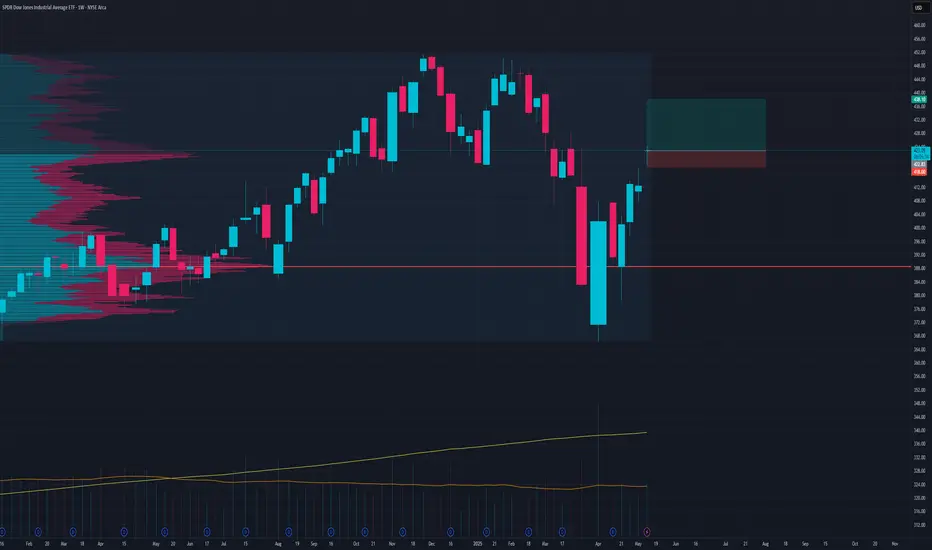
DIA Continuation PumpGap up and push here?
Stop loss could be at 415 but that would not be with good risk to reward ratio
Use proper position sizing and conservatize risk management
SL 418.47
TP 437.31
PERSISTENT - Persistent Systems Ltd (45 minutes, NSE) - LongPERSISTENT - Persistent Systems Ltd. (45 minutes chart, NSE) - Long Position; short-term research idea.
Risk assessment: Medium {volume structure integrity risk}
Risk/Reward ratio ~ 2.44
Current Market Price (CMP) ~ 5740
Entry limit ~ 5710 on May 20, 2025
1. Target limit ~ 5900 (+3.33%; +190 points)
2. Target limit ~ 6100 (+6.83%; +390 points)
Stop order limit ~ 5550 (-2.80%; -160 points)
Disclaimer: Investments in securities markets are subject to market risks. All information presented in this group is strictly for reference and personal study purposes only and is not a recommendation and/or a solicitation to act upon under any interpretation of the letter.
LEGEND:
{curly brackets} = observation notes
= important updates
(parentheses) = information details
~ tilde/approximation = variable value
-hyphen = fixed value

WTI Crude: Bears Target 60.549 USDHey traders and investors!
🔹 Crude Oil — 1D / 4H
📍 Context
Daily (1D): clear short trend; price capped below 65.40 USD.
4-Hour (4H): sideways range — its boundaries are marked by black lines on the chart — with seller initiative in control.
Higher-time-frame levels reinforce the bearish bias.
🔎 Analysis
Sellers keep the upper hand on 4H. The daily shows no strong buyer bars, sustaining downward pressure. If price retests the IKC zone and prints bearish confirmation (high-volume seller bar or buyer absorption), the odds of breaking 60.549 USD increase.
🎯 Trade Idea
Setup: hunt for short patterns inside the IKC range.
Target: 60.549 USD (range low).
Confirmation: pattern on M15–H1 + seller-side volume.
📌 Takeaway
Bears remain in control. Wait for a trigger inside the IKC zone and lower-TF confirmation before joining the move toward 60.549 USD.
This analysis is based on the Initiative Analysis concept (IA).
Wishing you profitable trades!

USDNOK - US Dollar / Norwegian Krone (Daily chart, OANDA)USDNOK - United States Dollar / Norwegian Krone (Daily chart, OANDA) - Short Position; Short-term research idea.
Risk assessment: Medium {support structure integrity risk}
Risk/Reward ratio ~ 2
Current Market Price (CMP) ~ 10.31500
Entry limit ~ 10.30000 on May 06, 2025
Target limit ~ 10.50000 (+1.94%)
Stop order limit ~ 10.18000 (-1.17%)
Disclaimer: Investments in securities markets are subject to market risks. All information presented in this group is strictly for reference and personal study purposes only and is not a recommendation and/or a solicitation to act upon under any interpretation of the letter.
LEGEND:
{curly brackets} = observations
= important updates
(parentheses) = information
~ tilde/approximation = variable value
-hyphen = fixed value

VZ - Verizon Communications Inc. (45 minutes chart, NYSE) - LongVZ - Verizon Communications Inc. (45 minutes chart, NYSE) - Long Position; Short-term research idea.
Risk assessment: High {volatility risk}
Risk/Reward ratio ~ 2.08
Current Market Price (CMP) ~ 44.17
Entry limit ~ 44 to 43.60 (Avg. - 43.8) on May 07, 2025
1. Target limit ~ 44.35 (+1.26%; +0.55 points)
2. Target limit ~ 44.80 (+2.28%; +1 point)
3. Target limit ~ 45.15 (+3.08%; +1.35 points)
Stop order limit ~ 43.15 (-1.48%; -0.65 points)
Disclaimer: Investments in securities markets are subject to market risks. All information presented in this group is strictly for reference and personal study purposes only and is not a recommendation and/or a solicitation to act upon under any interpretation of the letter.
LEGEND:
{curly brackets} = observations
= important updates
(parentheses) = information
~ tilde/approximation = variable value
-hyphen = fixed value

BTC/USD - Short Position Analysis During Consolidation PhaseBitcoin (BTC/USD) Technical Analysis
Currently trading at $106,489.46 with minimal daily change (-0.34%).

$ADSK to $340 in Early Q2NASDAQ:ADSK is already a 100-Bagger stock.
A 16 year and 10 year linear regression channel show nearly identical baselines for NASDAQ:ADSK , indicating that the baseline - and deviations from the baseline - have been respected for that period of time, and whose boundaries are likely to continue to be respected.
Depending on the channel, NASDAQ:ADSK has either crossed above the baseline, or has reached it. Will it crash back down, or use it as support? Using the Multi VWAP indicator we see that over the past month the stock has blasted through every Anchored VWAP initiating from every major gap over the past year, as well as the biggest gaps of the past 3 years. This is bullish.
To crash back through the baseline of the regression channels and the anchored VWAPs considering that Autodesk has just recently recovering from a major crash seems less likely. Should the stock continue its trajectory and go to the top of the channel, it could hit $340 before in early Q3.

Bitcoin is approaching a “Golden Cross”🚀 Bitcoin is approaching a “Golden Cross”
(the 50-day moving average is about to cross above the 200-day)
What does that mean, and what might come next?
📍 What’s happening right now
BTC is squeezed in a $101 K – $107 K range.
The 50-day SMA is racing toward the 200-day SMA; the bullish crossover (the “Golden Cross”) is expected within the week.
On Deribit, more than 60 % of the 30 May option series are $110 K call options.
When traders buy these calls, market-makers hedge by buying spot BTC. The nearer the price gets to $110 K, the more spot BTC they have to buy.
📈 How the market behaved before
The 10-day chart shows the 50-day (blue) and 200-day (orange) SMAs.
In the last three cycles, a bullish Golden Cross appeared 50–90 days after a bearish “Death Cross.” Each time, the cross formed inside a buyer zone (marked with blue rectangles).
In the 2nd and 3rd cycles, price never came back to retest that buyer zone.
Right now, the buyer zone is already in place, the Golden Cross is only about $300 away, and 50 days have passed since the last Death Cross. Some traders seem to be buying early, betting on a break to a new all-time high (ATH).
Wishing you profitable trades!

An Extended In-Depth BTC/USDT Technical ExaminationThis comprehensive technical analysis offers a granular look into the recent trading activity of BTC/USDT. By dissecting the established market structure, various indicator signals, and crucial volume patterns, we aim to build a detailed picture of the forces at play and the evolving sentiment within this market.
1. The Bedrock: Established Bullish Structure and a History of Ascending Peaks
Observing the price action from the designated "STRUCTURE START" point, it's evident that Bitcoin has, for a considerable span, carved out a path indicative of bullish market dominance. This was not a haphazard series of movements but rather a more methodical construction of a positive trend, characterized by the consistent achievement of higher highs. Each successive peak surpassed its predecessor, and often, the subsequent troughs also formed at higher levels than those before them. This pattern of ascending highs and higher lows is a cornerstone of classical technical analysis, widely interpreted as a sign of robust underlying demand and a prevailing optimistic sentiment among market participants. Buyers have demonstrated a recurring willingness to absorb selling pressure and to pay incrementally more for the asset, leading to this stair-step upward progression. This established bullish framework provides the critical context against which more recent, potentially contrasting, signals must be evaluated. It forms the baseline expectation of continued upward momentum that has been challenged by more recent developments.
2. An Early Warning: The Initial Bearish Divergence and Its Eventual Neutralization
Well before the most recent price turbulence, an interesting cautionary signal emerged in the form of a "WEAK BEARISH DIVERGENCE," as demarcated by the yellow dashed line connecting price peaks with corresponding RSI peaks. This specific instance occurred when the price chart successfully printed a new, higher high, yet the Relative Strength Index (RSI), a momentum oscillator, failed to confirm this strength, instead registering a lower high. Such a discrepancy between price and momentum is a classic bearish divergence. It often suggests that while the price is still being pushed upwards, the underlying buying power or enthusiasm is beginning to wane. It can be an early indicator that the bullish thrust is losing conviction and that the trend might be vulnerable to a pullback or reversal.
However, this particular early warning signal did not immediately usher in a significant downturn. As the chart highlights with the red "!" exclamation mark on the RSI, this divergence was subsequently "mitigated." Divergence mitigation can occur in several ways, such as a sharp price correction that pulls the RSI down significantly, effectively "resetting" the oscillator, or a period of sideways consolidation where the RSI drifts lower, resolving the overbought conditions without a major price drop. In this case, the mitigation implied that the bearish undertones indicated by the divergence were either absorbed by renewed buying interest or were not potent enough to derail the overarching uptrend at that juncture. The market seemingly managed to overcome this initial hiccup in momentum, allowing the bullish structure to persist for a while longer.
3. The Volume Narrative: A Tale of Initial Strength Followed by Decisive Weakness at the Apex
The volume profile, particularly over the most recent trading days leading up to and including the latest peak, provides crucial insights into market conviction. As BTC/USDT embarked on its ascent towards the recent significant highs, there was a conspicuous and encouraging surge in trading volume. This is visually represented by the taller volume bars, and the green upward arrow on the volume indicator emphasizes this period of high participation. Generally, strong volume accompanying a price rally or a breakout above key resistance levels is considered a bullish confirmation. It suggests broad market participation, institutional interest, and a strong consensus behind the upward move, lending credibility to its sustainability.
However, a very different and far more concerning volume pattern emerged during the attempt to retest or potentially exceed this recently established high. As indicated by the red downward-sloping arrow and the prominent red question mark above the volume bars, the trading volume experienced a dramatic and notable decline during this critical retest. This sharp fall-off in volume as the price approached or nominally touched the prior peak is a significant bearish tell. It signals a profound lack of buying conviction at these elevated price levels. Potential interpretations include buyer exhaustion (those willing to buy have already done so), profit-taking by earlier entrants, or an absence of new capital willing to chase the price higher. The failure to decisively break the previous high, especially when accompanied by such diminished volume, often acts as a strong precursor to price rejection, suggesting that the bullish impetus witnessed earlier had significantly dissipated, leaving the market vulnerable.
4. An Unresolved Condition: The Persistent Bearish Divergence Deepens its Roots
More recently, and perhaps more alarmingly for bullish prospects, a distinct and more pronounced bearish divergence has taken shape, as explicitly marked in red ("DIV") on the RSI indicator. This divergence materialized as the price action, particularly looking at candle closes, managed to etch out highs that were comparable to, or in some instances slightly above, the peak established just before the sharp subsequent decline. In stark contrast, the RSI painted a very different picture, charting a series of clearly lower highs. This disjuncture, where price holds or inches higher while momentum (as measured by the RSI) visibly weakens, is a classic and often more reliable bearish signal. It implies that the upward price movements are occurring on fumes, with diminishing underlying strength and buying support.
What makes this particular divergence especially noteworthy is its resilience. Despite the "relatively violent attack on the lows" observed – a sharp and rapid downward price movement that might typically be expected to "reset" indicators and alleviate overbought conditions or divergences – this bearish divergence was not mitigated. One might anticipate such a forceful sell-off to drive the RSI down substantially, thereby resolving the discrepancy with price.
However, in this instance, while the RSI did decline in response to the price drop, it did not fall to a level that would invalidate the pre-existing bearish divergence. Instead, this sequence of events seems to have reaffirmed and potentially extended the divergence. The RSI’s failure to achieve a deep reset during the sell-off, coupled with any subsequent weak price recovery attempts that still keep the RSI relatively subdued compared to its earlier peaks, reinforces the notion that the selling pressure encountered was substantial and that the bulls currently lack the momentum to decisively overcome this prevailing underlying weakness. This persistent, unmitigated divergence, especially when viewed in conjunction with the aforementioned volume weakness at the highs, strongly suggests a more entrenched struggle for the bulls.
Conclusion:
While it's true that in the very short term, the persistence and extension of the bearish RSI divergence, coupled with volume weakness during the latest attempt to surpass highs, presents a scenario with slightly bearish undertones and warns of a potential corrective or consolidation phase, it is crucial not to lose sight of the broader perspective. The primary price structure, observed since the "STRUCTURE START," continues to exhibit a sequence of higher highs. This is a fundamental pillar that maintains the bullish scenario as the principal and most probable one in the medium term.
Therefore, even if the price were to experience a correction and seek lower support levels or even recent lows (such as a potential test of the POC zone or lower marked levels), the priority mindset should remain geared towards identifying buying opportunities. This is because the underlying expectation is that, following a potential corrective or consolidation phase, the price will resume its path to make future attacks on key resistance levels. Seeking long trades, with an eye on surpassing recent highs and continuing the upward trend, remains the predominant strategy.
Additionally, it is vital to consider the confluence with the prevailing bullish trend on higher timeframes (daily, weekly). What we are currently observing on this lower timeframe chart could be interpreted as a phase of fractal re-accumulation within the inertia of this larger uptrend. That is, a pattern of consolidation and subsequent continuation that replicates on a smaller scale within a broader bullish movement. Pullbacks, in this context, often serve as opportunities for longer-term traders to add to positions or for new participants to enter in the direction of the main trend.
Consequently, while the formation of a short-term bearish setup cannot be entirely dismissed, especially if weakness persists and key supports are broken with conviction and volume, this bearish scenario still lacks the necessary confirmations to consider it dominant or to invalidate the underlying bullish structure. For now, the structure of higher highs and higher lows, supported by the trend on higher timeframes, suggests that any current weakness might be temporary before a new bullish impulse. The underlying bullish structure remains the primary guide until proven otherwise with compelling technical evidence, such as a break and consolidation below significant prior structural lows.

WIPRO - Wipro Ltd. (45 minutes chart, NSE) - Long PositionWIPRO - Wipro Ltd. (45 minutes chart, NSE) - Long Position; short-term research idea.
Risk assessment: Medium {volume & support structure integrity risk}
Risk/Reward ratio ~ 2
Current Market Price (CMP) ~ 254.4
Entry limit ~ 254 on May 16, 2025
1. Target limit ~ 258.5 (+1.77%; +4.5 points)
2. Target limit ~ 263 (+3.54%; +9 points)
Stop order limit ~ 249.5 (-1.77%; -4.5 points)
Disclaimer: Investments in securities markets are subject to market risks. All information presented in this group is strictly for reference and personal study purposes only and is not a recommendation and/or a solicitation to act upon under any interpretation of the letter.
LEGEND:
{curly brackets} = observation notes
= important updates
(parentheses) = information details
~ tilde/approximation = variable value
-hyphen = fixed value

KIRI INDUSTRIES Breakout happend in this stock with rising 200dma and RS indicator is also showing strength.
Keep your risk and reward ratios according to your own preferance.
This is for educational purpose, do your own research before investing.

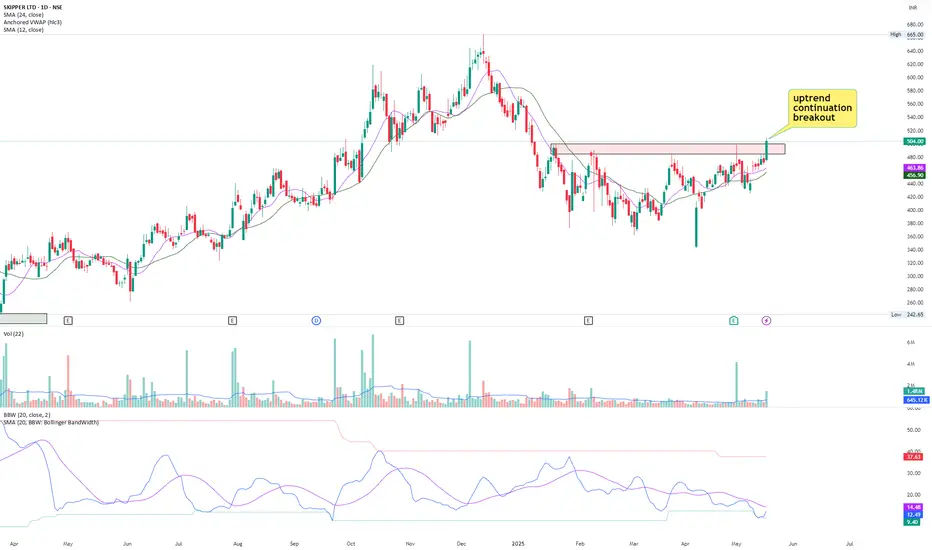
Breakout in SkipperStock has broken out of range of 4 months in long term uptrend with high relative volume.
Fundamentally, stock has delivered double digit earnings growth for straight 4 quarters.
Margins have also been increasing for last 3 quarters.
Overall, it's a good technofunda pick to watch out for.
USDDKK - U.S. Dollar/Danish Krone (3 hours chart, OANDA) - LongUSDDKK - U.S. Dollar / Danish Krone (3 hours chart, OANDA) - Long Position; Short-term research idea.
Risk assessment: Medium {volume & support structure integrity risk}
Risk/Reward ratio ~ 2
Current Market Price (CMP) ~6.62000
Entry limit ~ 6.58000 on May 19, 2025
1. Target limit ~ 6.63000 (+0.76%; +0.05000 points)
2. Target limit ~6.68000 (+1.52%; +0.10000 points)
Stop order limit ~ 6.53000 (-0.76%; -0.05000 points)
Disclaimer: Investments in securities markets are subject to market risks. All information presented in this group is strictly for reference and personal study purposes only and is not a recommendation and/or a solicitation to act upon under any interpretation of the letter.
LEGEND:
{curly brackets} = observations
= important updates
(parentheses) = information
~ tilde/approximation = variable value
-hyphen = fixed value

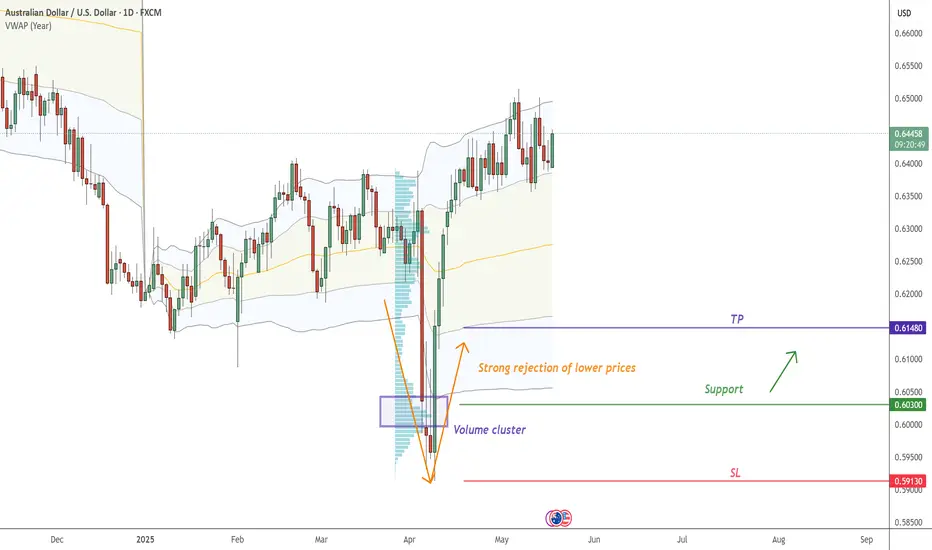
AUD/USD trade with TP + SLOn AUD/USD , it's nice to see a strong buying reaction at the price of 0.60300.
There's a significant accumulation of contracts in this area, indicating strong buyer interest. I believe that buyers who entered at this level will defend their long positions. If the price returns to this area, strong buyers will likely push the market up again.
Rejection of lower prices and high volume cluster are the main reasons for my decision to go long on this trade.
Happy trading
Dale
USD/CHF continue with the UptrendOn USD/CHF , it's nice to see a strong buying reaction at the price of 0.83160.
There's a significant accumulation of contracts in this area, indicating strong buyer interest. I believe that buyers who entered at this level will defend their long positions. If the price returns to this area, strong buyers will likely push the market up again.
(FVG) - Fair Value GAP and high volume cluster are the main reasons for my decision to go long on this trade.
Happy trading
Dale

Inside The Eye Of The Storm - $90 Target On TSMCIf you've seen my posts on Minds (particularly the board for NASDAQ:SOX ), it’s no secret that I’ve been bearish on semiconductors for some time. My bearish thesis is based on several factors: technical indicators, overvaluation of certain companies, and skepticism that AI-driven demand will result in broad-based prosperity. As the charts grow increasingly overbought, unfolding geopolitical developments could soon deliver a shock to the semiconductor sector, reinforcing the technical signals I’m observing.
At the time of writing, the market is turning bearish. Futures are down over 1%, and the TVC:US10Y is up nearly 2%. Institutional investors remain cautious about the U.S. economy due to its high debt levels and efforts to raise the debt ceiling to accommodate an additional $2 trillion in debt-financed tax cuts. Meanwhile, on the trade war front, the U.S. and China have agreed to deescalate tensions, a surprisingly smooth shift after weeks of posturing and brinkmanship. Although SP:SPX surged over 2% on the news, something feels off—worthy of speculation.
Recent articles in Foreign Affairs (www.foreignaffairs.com) and The Economist (www.economist.com) suggest that President Xi may now see his best opportunity to fulfill his longstanding goal of reunifying China.
I encourage reading those articles if you're interested, but here’s my take—and how it relates to a low-risk/high-reward short trade in semiconductors. By striking a tariff-reduction deal with the Trump administration, China has removed a key obstacle that could have otherwise hindered military action against Taiwan. While Trump has flip-flopped on Taiwan over the years, he has previously threatened sanctions and tariffs as deterrents. But with the economy already strained, reimposing tariffs of 145% or higher would be self-defeating.
This opens the door for China to escalate. Over the past month, we’ve seen “gray zone” tactics: military drills, suspicious Chinese fishing vessels dragging anchors near undersea cables, and reports that China may use its coast guard to “quarantine” vessels heading to or from Taiwan—potentially inflicting serious economic pain. Such moves would place the U.S. in a precarious position.
To compound the risk, Taiwan imports 90% of its energy—mostly LNG—and just shut down its last nuclear reactor on Friday (5/16), which supplied around 4.5% of the nation’s power. In 2023, NYSE:TSM alone used more than 8% of Taiwan’s electricity, according to Business Insider. Any disruption to power or communications would halt production.
This leads me to believe that China may attempt to annex Taiwan before 2027. (After all, why announce an invasion years in advance?) According to WIRED, NYSE:TSM produces at least 90% of the world’s most advanced chips, and Taiwanese companies control 68% of total global chip production. These fundamentals make Taiwan Semiconductor Manufacturing Company arguably the most vulnerable firm to any disruption in Taiwanese exports.
I’ve covered the market’s broader setup in other posts, so I’ll keep the technical analysis here brief. On the weekly chart (right), NYSE:TSM ’s price rose from October 2022 to January 2025 in five distinct waves. That uptrend has now been broken, and the price appears to be in the right shoulder of a large Head & Shoulders pattern. While the downside potential is open-ended, we can estimate a target using technicals. I expect the price to slice through the entirety of Wave (3) and find support in the blue-box, which aligns with the volume profile and 0.618–0.786 Fibonacci retracements. A break below the weekly 200MA would be a very bearish sign. For now, I’ve set my target for NYSE:TSM at $90.
Zooming in, the daily chart (right) shows numerous gaps and doji candles. The high-volume days were dominated by selling. On the 100R chart (left), including after-hours trading, the Fisher Transform oscillator shows bearish divergence. Although Friday closed flat (0.00%), the stock dropped nearly 2% after hours. I expect a move back to VWAP, especially if the broader market trends lower this week.
To gauge how TSMC stacks up against the broader industry, let’s look at some peers. On the semiconductor index NASDAQ:SOX , there are two key gaps worth watching—similar to what we see in other indexes. The price is currently at the 0.618 retracement of Wave (A) and briefly peaked above the 200MA. I expect it to move lower from here, likely filling those gaps and setting new lows.
For NASDAQ:NVDA , I’m seeing a Head & Shoulders pattern forming, with the price currently in Wave (B). Several downside price gaps exist, and more notably, there’s a volume gap between $95 and $102.
On the 500R chart (left), Nvidia is clearly overbought and facing resistance at the upper VWAP band. A move to the 1.618 extension would be extreme—but there’s an order block around that level, along with a gap down near $31, visible on the daily chart (right). Such a steep drop would require a major catalyst. While it’s unclear how reliant NASDAQ:NVDA is on Taiwan, it’s reasonable to assume the leading AI chipmaker depends on a supply chain anchored by the company producing 90% of the world’s advanced chips.
NASDAQ:AMD , another company heavily reliant on TSMC’s fabs, shows a very bearish setup on the weekly chart (right) when using a logarithmic scale. However, price action from the past year on the 500R chart (left) suggests it could move higher if basic Elliott Wave principles hold. AMD’s beta is 2.14 versus TSM’s 1.68, indicating lower correlation with the broader market. It may therefore be less compatible with wave theory, but it's still an essential ticker to monitor, especially as it diverges from NASDAQ:SOX and peers.
To conclude, considering the current overbought level of NYSE:TSM , coupled with the broader market pivoting back to a bearish trend, and its unique position at the center of a geopolitical and trade crisis, I think shorting TSMC provides a low risk/high reward setup with a target of $90. All of this to say, I am not a coldhearted opportunist, and I hope Taiwan can remain a free, democratic, country that is able to withstand China’s grey-zone tactics. Unfortunately, we should be prepared for Xi to use this opportunity to find out just how committed to Taiwan the Trump administration is, and as we saw during the COVID shutdown and subsequent supply shortages, microprocessors are some of the most essential products in the world that just so happen to be produced in the most vulnerable country in Asia. I suspect that there is trouble afoot.
Thank you for reading and let me know what you think.

Watching 3265 — The Key Level for Gold BuyersHey traders and investors!
📊 GOLD / W + D
📍 Context
On the weekly timeframe: a seller candle with increased volume but no result — the close is above 3201. This gives buyers a chance to take over the initiative.
On the daily timeframe: the buyer has brought the price back into the range (lower boundary at 3201), which also keeps the door open for bullish scenarios.
🎯 Trade Idea
Consider long positions after the price holds above 3265
Potential targets: 3435 and 3500
📌 Conclusion
Bulls have a chance — it's important to watch the price behavior around 3265 and look for long setups on lower timeframes. For example, a retest of 3265 after a breakout and absorption of the retest candle by the buyer, similar to what happened at the 3167 level on the hourly timeframe.
