USD/CHF Analysis Based on Volume, Fibonacci & Stochastic
This USD/CHF trade idea is based on:
Volume profile analysis to identify key price zones
Fibonacci retracement levels to confirm technical structure
Stochastic indicator to refine entry timing
🔹 Entry: 0.8078
🔹 Stop-Loss: 0.8069
🔹 Take-Profit: 0.8097
🔹 Risk-to-Reward Ratio: 1.00
⚠️ Disclaimer: This setup is shared for educational purposes only. It does not constitute financial advice. Always apply strict risk management.
Volume

GBPUSD 4H: retest done - bearish continuation beginsOn the 4H chart, GBPUSD has completed a textbook head and shoulders pattern. The neckline has already been broken, and the price is now finalizing a retest around 1.3365–1.3380, where the 0.5 Fibo level also lies. This confirms a trend reversal, with the market preparing for the next leg down.
MA and EMA are above the current price, adding pressure to the downside. RSI remains neutral, and volume is shifting in favor of bears. The key resistance zone at 1.3365 has been tested from below, and the price is beginning to roll over - a classic bearish continuation signal.
Targets: 1.3240 first, then 1.3150 and potentially 1.2 870 if momentum builds. The invalidation point is a close above 1.3365, which is not likely at this stage.
Fundamentals support the move: the dollar remains strong as the Fed holds its hawkish stance, while the UK economy continues to show weakness across services and manufacturing.
Neckline broken ✅
Retest done ✅
Momentum building ✅
The setup is complete — time to follow the structure.

Possible run to 130 in the cardsEasily invalidated.
We are using the patterns from the price action post threshold break (redline in bottom pane)
These breaks are unseen on this time frame
The volume instabilities are between the 15 minute and the 1 hour. I would look for breaks under 15 minutes, too much noise at that level. Go ahead and test it yourself. See my script posted on trading view for details.

EUR/USD Analysis Based on Volume, Fibonacci & Stochastic
This EUR/USD trade setup is structured using:
Volume analysis to locate key activity zones
Fibonacci retracement for confluence
Stochastic indicator to refine the timing of entry
🔹 Entry: 1.1546
🔹 Stop-Loss: 1.1588
🔹 Take-Profit: 1.1506
🔹 Risk-to-Reward Ratio: 1.02
⚠️ Disclaimer: This analysis is for educational purposes only and is not financial advice. Always manage your risk and trade responsibly.

OKLO — when nuclear momentum breaks resistanceSince late 2024, OKLO had been consolidating inside a clear rectangle between $17 and $59. The breakout from this long-term range triggered a new bullish impulse. The price has since returned to retest the breakout zone, now aligned with the 0.618 Fibonacci retracement at $51.94. The retest has completed, and the price is bouncing upward, confirming buyer interest.
Technically, the trend remains firmly bullish. The price closed above the prior range, EMAs are aligned below, and the volume spike during breakout supports genuine demand. The volume profile shows a clean path toward $100, indicating limited resistance ahead. The structure suggests a controlled rally rather than an exhausted move.
Fundamentally, OKLO is a next-generation SMR (Small Modular Reactor) company focused on delivering compact, efficient nuclear power solutions. Following its public debut via SPAC and recent capital injection, OKLO is transitioning from development to implementation. Institutional interest is holding strong, and the broader move toward decarbonization and energy independence places the company in a strategic position.
Target levels:
— First target: $100 — psychological and technical resistance
— Second target: $143 — projected from prior range breakout
OKLO isn’t just another clean energy ticker — it’s a quiet disruptor with nuclear potential. The chart broke out. The volume confirmed. Now it’s time to see if the market follows through.

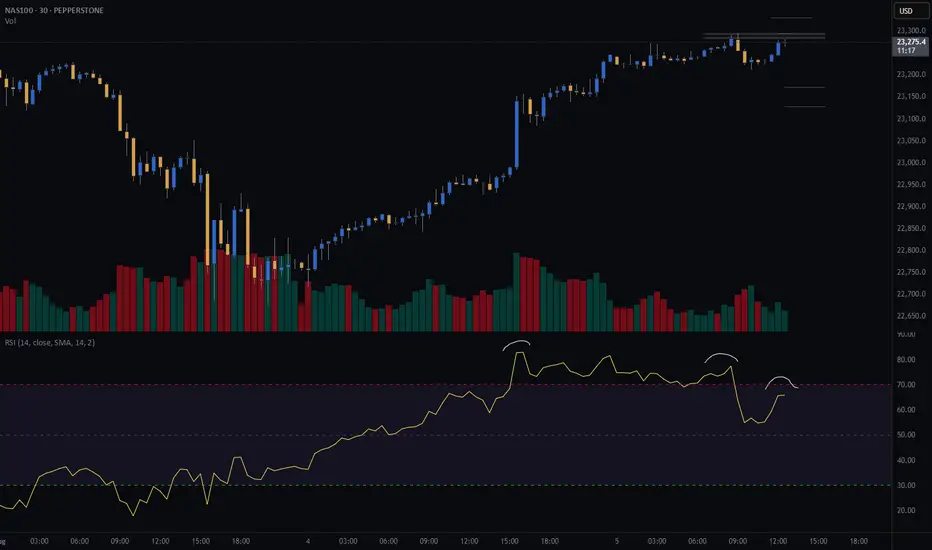
NAS100 (CASH100) Short - Double top 30minThe 15min head and shoulders setup got invalidated.
However, my double top variables are currently being met.
Still need confirmation before entering trade.
Risk/reward = 2.7
Entry price = 23 284
Stop loss price = 23 331
Take profit level 1 (50%) = 23 173
Take profit level 2 (50%) = 23 129
What does everyone thing the NASDAQ is going to do today?
AUD/USD Analysis Based on Volume, Fibonacci & Stochastic
This AUD/USD setup is based on:
Volume Profile zones to detect institutional interest
Fibonacci levels for structural confirmation
Stochastic oscillator to time the entry more accurately
🔹 Entry: 0.6460
🔹 Stop-Loss: 0.6476
🔹 Take-Profit: 0.6441
🔹 Risk-to-Reward Ratio: 1.19
⚠️ Disclaimer: This analysis is for educational purposes only and does not constitute financial advice. Always do your own due diligence and manage risk appropriately.

USD/CHFThis USD/CHF setup is based on:
Volume profile analysis to identify key liquidity zones
Fibonacci levels for structural confirmation
Stochastic oscillator to refine entry precision
🔹 Entry: 0.8105
🔹 Take-Profit: 0.8139
🔹 Stop-Loss: 0.8080
🔹 Risk-to-Reward Ratio: 1.38
⚠️ Disclaimer: This analysis is for educational purposes only and should not be considered financial advice. Always use proper risk management.

NZD/USD Analysis Based on Volume, Fibonacci & Stochastic
This NZD/USD setup is developed using:
Volume analysis to highlight market participation zones
Fibonacci levels to confirm technical structure
Stochastic indicator to find precise entry timing
🔹 Entry: 0.5892
🔹 Take-Profit: 0.5864
🔹 Stop-Loss: 0.5909
🔹 Risk-to-Reward Ratio: 1.64
⚠️ Disclaimer: This analysis is for educational purposes only and is not financial advice. Always trade with proper risk management.

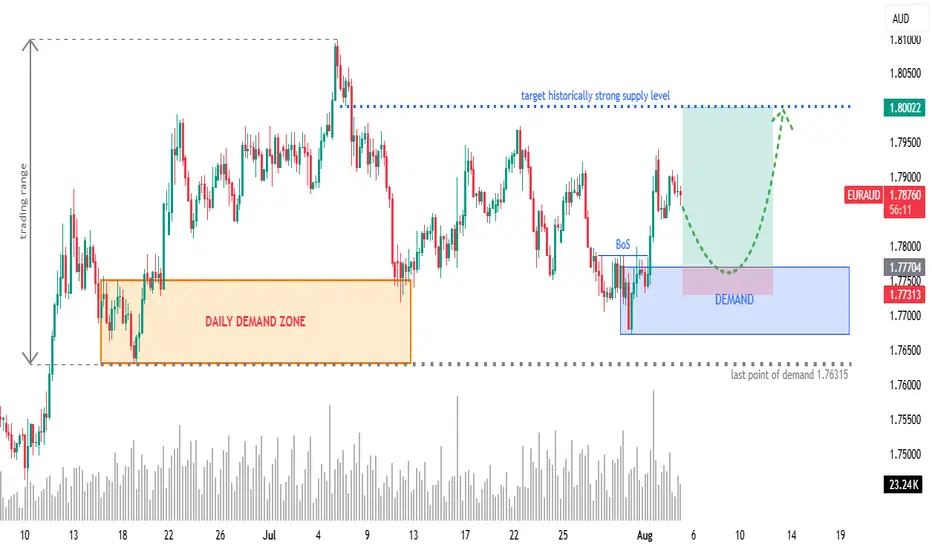
EURAUD 4H: Long Setup from Fresh Demand ZoneOverview:
OANDA:EURAUD retracing into a newly formed 4H demand zone after a bullish Break of Structure (BoS). Eyes on continuation towards a historically significant supply zone at 1.8000.
🧩 Setup Details
• Asset & Timeframe: EURAUD, 4H
• Bias: Bullish
• Entry Zone: 1.77300 – 1.77700 (DEMAND area)
• Targets:
🎯 T1 = 1.7900 (minor reaction level)
🎯 T2 = 1.8000 (historical supply level)
• Stop-Loss: Below 1.77300 (last valid demand)
• Risk-Reward: Approx. 1:6+
🧠 Why Now? (Trade Rationale)
• ✅ Fresh 4H Demand Zone: Price is retracing into a clear demand zone after rejecting lower prices.
• ✅ Break of Structure (BoS): Bullish BoS confirms shift in order flow.
• ✅ Volume Confirmation: Increasing demand near current price levels.
• ✅ Clear Liquidity Sweep: Price likely swept short-term lows before BoS.
• ✅ Target Supply Zone: 1.8000 is a well-respected historical supply/resistance level — clean magnet for price.
⏱ Multi-Timeframe Context
• Daily Chart: Price is reacting off a larger DAILY DEMAND ZONE. Trend bias is bullish.
• 4H Chart: Structure break + demand formation suggest continuation.
• 1H/Entry Level: Monitor price action in the blue zone for lower-timeframe confirmation (e.g. bullish engulfing, flip zones, LQ sweep, etc.) and potentially greater risk-reward.
📉 Risk Management & Duration
• Stop below 1.76315 keeps you protected from deeper invalidation.
• Trade Duration: Short to mid-term (1–4 days).
• Position Size: Scale based on volatility; ideal for swing trade conditions.
📌 Trade Plan Summary
📍 Watch for bullish PA on re-entry into demand (1.77300–1.77700)
📍 Set SL below 1.76315
📍 TP1 at 1.79000 — partials advised
📍 TP2 at 1.80000 — strong historical level
📍 Adjust SL to BE on momentum breakout
GBP/USD Analysis Based on Volume, Fibonacci & Stochastic
This GBP/USD setup is built on:
Volume Analysis to detect strong price areas
Fibonacci retracement to identify key support/resistance
Stochastic oscillator to find a better-timed entry
🔹 Entry: 1.3270
🔹 Stop-Loss: 1.3298
🔹 Take-Profit: 1.3239
🔹 Risk-to-Reward Ratio: 1.14
⚠️ Disclaimer: This analysis is for educational purposes only and does not constitute financial advice. Please do your own research and manage your risk properly before trading.

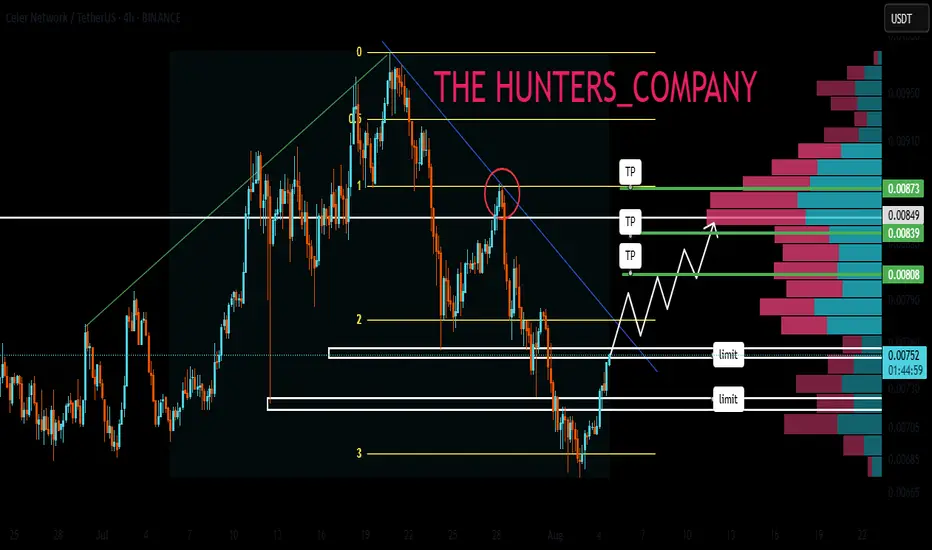
CELR : Sensitive areaHello friends🙌
✅Considering the decline we had, you can see that the price has been well supported in the support area drawn with Fibonacci and now it seems that it wants to go up to the specified ranges, which are also good and high-volume ranges, and these areas are like magnets for the price.
✅Don't forget risk and capital management.
🔥Follow us for more signals🔥
*Trade safely with us*
USD/CHFThis trade setup is based on volume analysis, Fibonacci retracement zones, and confirmation from the Stochastic oscillator to determine a strong long entry. The setup suggests a potential bullish move with favorable risk conditions.
Entry: 0.8082 area
Stop-Loss: 0.8044 area
Take-Profit: 0.8130 area
Risk-to-Reward Ratio: ~1:1.5
This idea capitalizes on a bounce from a key Fibonacci support level, where volume and momentum indicate buyer strength and trend continuation potential.
⚠️ Disclaimer:
This is not financial advice. Trading involves risk and may not be suitable for all investors. Always do your own research and apply proper risk management.

GBP/USD This trade is based on a combination of volume analysis, Fibonacci retracement levels, and signals from the Stochastic oscillator to identify a favorable long entry. The setup indicates a potential bullish continuation, supported by increasing volume and a shift in momentum.
Entry: 1.3293 area
Stop-Loss: 1.3269 area
Take-Profit: 1.3333 area
Risk-to-Reward Ratio: ~1:2.0
This setup targets a continuation of the upward move, with price reacting positively at a key Fibonacci zone and momentum confirming with a bullish signal from the Stochastic.
⚠️ Disclaimer:
This is not financial advice. Trading involves risk and may not be suitable for all investors. Always conduct your own analysis and use proper risk management.

AUD/USDThis analysis is based on a combination of volume analysis, Fibonacci retracement levels, and Stochastic oscillator signals to find an optimal entry point. The trade setup suggests a potential bullish move after confirming support and momentum alignment.
Entry: 0.6475 area
Stop-Loss: 0.6465 area
Take-Profit: 0.6498 area
This setup aims to capitalize on a high-probability bounce within a key Fibonacci zone, confirmed by volume strength and oversold readings on the Stochastic indicator.
⚠️ Disclaimer:
This is not financial advice. Trading involves risk and may not be suitable for all investors. Always do your own research and use proper risk management.

USD/JPYThis analysis is built on volume analysis, Fibonacci retracement levels, and confirmation from the Stochastic oscillator to pinpoint a precise long entry. The setup reflects a potential bullish continuation supported by strong demand and upward momentum.
Entry: 147.76 area
Stop-Loss: 147.56 area
Take-Profit: 148.55 area
Risk-to-Reward Ratio: ~1:4.5
This setup aims to capture a breakout or bounce from a key Fibonacci level, where the volume confirms buying interest and the Stochastic indicates a reversal from oversold conditions.
⚠️ Disclaimer:
This is not financial advice. Trading involves risk and may not be suitable for all investors. Always do your own research and apply proper risk management.

NZD/USDThis analysis is based on a combination of volume analysis, Fibonacci retracement levels, and Stochastic oscillator signals to identify a high-probability entry point. The trade setup suggests a potential bearish move following confirmation from volume patterns and momentum indicators.
Entry: 0.5907 area
Stop-Loss: 0.5916 area
Take-Profit: 0.5893 area
This setup targets a short-term downward correction within a key Fibonacci zone, supported by weakening volume and an overbought signal from the Stochastic indicator.
⚠️ Disclaimer:
This is not financial advice. Trading involves risk and may not be suitable for all investors. Always conduct your own analysis and use proper risk management.

GBPJPY Buydaily cycle, lit cycle. Inducement for london has happened and price should continue upward.

WTI: downside potentialHi traders and investors!
This analysis is based on the Initiative Analysis concept (IA).
Weekly timeframe
A buyer initiative is tentatively developing, yet the strongest buyer candle (highest volume) produced no follow-through. It was followed by two buyer candles on weak volume. Last week volume expanded again and clustered around 69.975, showing that sellers are still defending this level. Weekly seller targets: 65.628 and 64.378.
Daily timeframe
Sellers remain in control. The chart clearly shows volume manipulation around 69.975. Daily seller targets: 65.628 and 64.736.
Wishing you profitable trades!

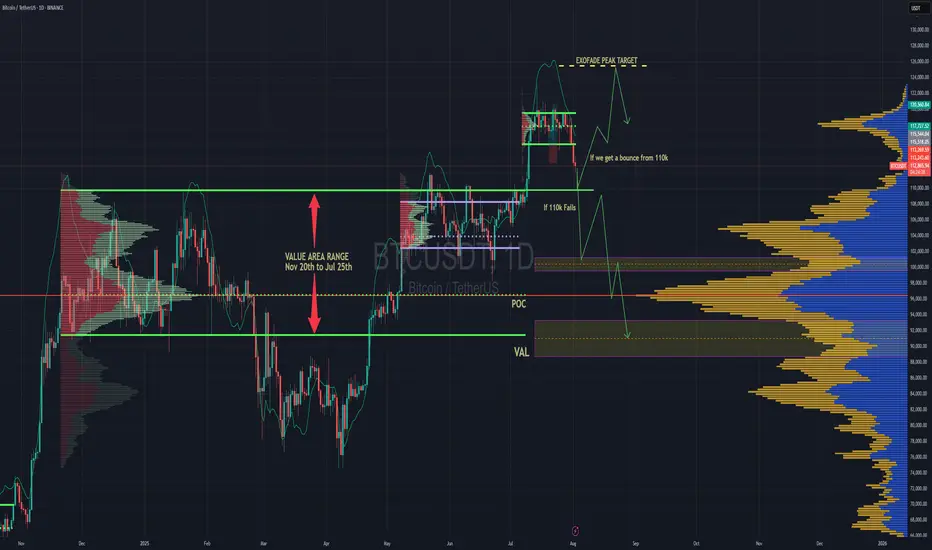
BTC Forecast For August & September. The Only Roadmap You Need !This is one is so obvious, its a no brainer , and would likely be very easy to trade as long as you follow this road map i have provided.
The Value Area High at 110k price range is most important upcoming battle line between bull vs bear. If bulls fail to get a strong bounce from 110k and we close at least 2 daily candles below it. Then it would mean bears have full control and the implication of that is that since we would at that point be closing back inside an established Value Area range, formed between Nov 20th to Jul 25th, then it would mean the probability of price selling all the way down to re-test the VAL (value area low) at $91.6k would instantly become very very high.
After re-testing $91.6k we'll watch and see what happens.
It'll either hold after grabbing some liquidity below and stay in the Value Area Range until further notice Or we lose it and the sell off continues. Bear market will be in full swing if that happens and you can bet a ton of weak hands will start to exit due to max pain & cascading long liquidations. Fear index will be back in the red at that point as capitulation starts to set in. Alot of new alts and meme coins will be completely obliterated.
Bullish Continuation Scenario
If bulls get a strong bounce from 110k and don't close back inside the Value Area Range below, then we could continue up to a make a new ATH for a classic trend pullback continuation trade. Once we get back above 115.4k, the dream of a new ATH will become much more realistic. There is an UFA(Unfinished Auction) at 120.8k which is only visible to traders using the market profile or footprint chart. This make poor high and needs to be taking out at some point.
For the Price target to the upside, we would be using the peak formation line of the ExoFade indicator.
EURUSD. Weekly and Daily AnalysisHi traders and investors!
This analysis is based on the Initiative Analysis concept (IA).
Weekly TF
Price has tapped the 50 % level of the last buyer initiative at 1.14477 and run a manipulation around 1.15569.
Daily TF
We’ve seen a manipulation of the lower boundary of the buyer initiative, and an IKC candle has printed.
Buyer targets on the daily chart: 1.17110, 1.17888, 1.18299.
Before aiming for those, buyers first need to clear the potential sell zones at 1.15994 and 1.16108.
Conservative long setup:
Wait for buyers to defend 1.15994 (or a higher level).
Alternatively, watch the 1-hour support at 1.15165; if buyers hold it, there’s scope for a move toward 1.15994 — and potentially higher after that.
Wishing you profitable trades!

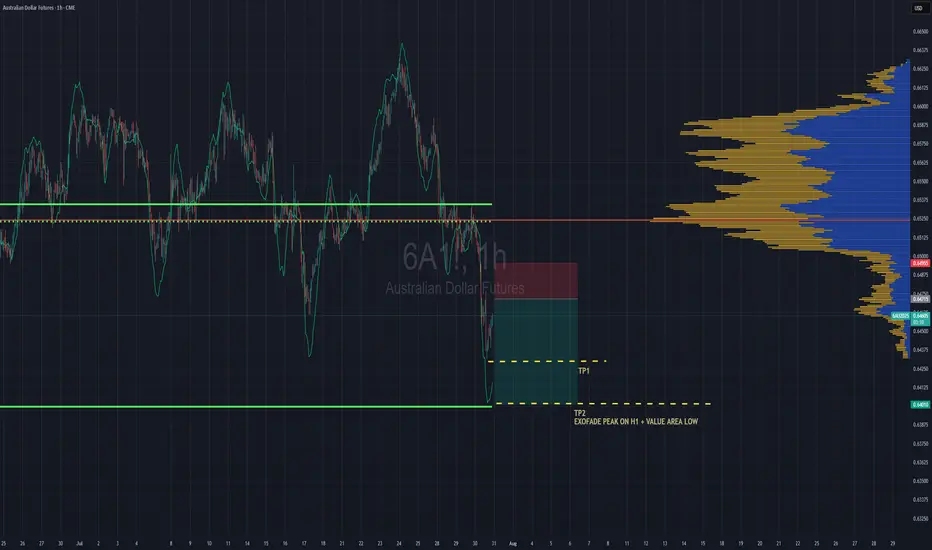
Aussie Shorts Looks Promising This is a pullback trend trade anticipating trend continuation. Entry is based on LVN (low volume node) for entry. Also looking on the footprint chart there is a high volume node with -ve delta that was traded at 0.64715.
If the sellers return to defend that price then this pullback should give some strong rejection once we pierce the entry zone and send bulls packing.
TP1 - First swing low
TP2 - Value area low of the range, which also is in confluence with the ExoFade peak on the 1HR timeframe. ExoFade peaks always gets taken out in a strong trend, that's why i love using them as price targets for exits. ExoFade is free on Tradingview for those curious about it. Just search for it.
Xtz historic supportXTZ is at a historic support level here where it has consistently respected as support or resistance after recently busting over it and on higher volume seen in a long time. I’m optimistic.
Most tied up in staking it seems ~77%, so moves could happen quickly, as seen previously.
