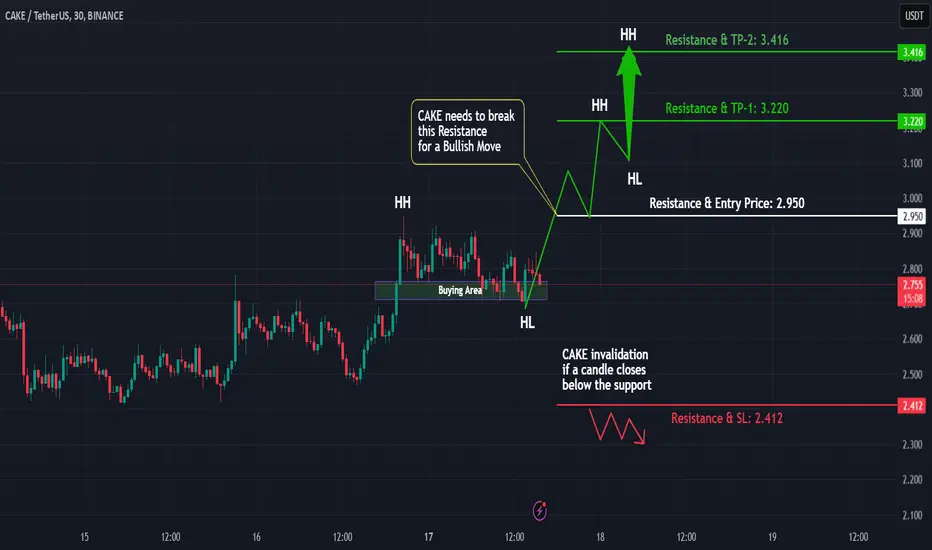
#Cake Ready for a Big Move? Bullish Breakout Incoming!🔹 Market Structure & Trend
#Cake is currently in a strong uptrend, forming higher highs (HHs) and higher lows (HLs). This is a classic sign of bullish momentum.
🔹 Key Breakout Zone
We are watching the resistance level: 2.950, which aligns with previous HHs. A breakout above this level could trigger another strong rally.
🔹 Trade Plan & Entry Strategy
Breakout Entry: Above 2.950 with confirmation
Stop Loss: Below recent HL for proper risk management
Targets: First TP at 3.220, extended TP at 3.416
🔹 Indicators & Confirmation
RSI: Above 50, indicating bullish strength
Volume: Increasing, signaling strong participation
Moving Averages: Aligning for an uptrend
What’s Your Take?
Do you think #Cake will break out or face resistance? Drop your analysis in the comments!
Volume
Usdchfwaiting on a nice trade idea to start attacking on a position , we will move somewhere either up or down waiting on the higher timeframes to show us..

TONUSDT: Bearish Setup or Bulls' Last Stand?
Hey, traders! 😱📉 BINANCE:TONUSDT.P is in a high-risk zone, and the market is tense. We see the price testing support at *3.6191 USDT*, while resistance at *3.6891 USDT* is keeping the pressure on.
The classic scenario: if support fails, we could see a sell-off. But what if the whales are lurking, ready to turn the price around?
🔑 *Key Levels:*
*Support:*
*3.6191 USDT* – bulls are defending this level aggressively.
*3.0087 USDT* – deep liquidity zone, where the price could drop if support breaks.
**Resistance:**
**3.6891 USDT** – if sellers hold this level, the downtrend continues.
**3.8000 USDT** – a breakout above here could mean a bullish reversal.
🚩 *Trading Strategy:*
*Short Entry:* After breaking *3.6191 USDT* with a retest.
*Stop-Loss:* Above *3.6891 USDT* – if bears are wrong, it's time to exit.
*Profit Targets:*
*3.5000 USDT* – quick scalp target.
*3.3000 USDT* – solid take-profit zone.
*3.0087 USDT* – full breakdown potential if panic selling intensifies.
📈 *Technical Analysis Insights:*
Sellers are dominating – market structure remains bearish.
Volume shows liquidity accumulating in this range.
If we see a bounce from *3.6191 USDT*, a short squeeze could trigger a sharp move up.
💡 *What to Watch For?*
*Manage risk!* A downtrend doesn’t mean going all-in.
*Wait for confirmation!* No clear break = possible liquidity grab.
*Watch volume!* False breakouts are common without strong volume support.
Is BINANCE:TONUSDT.P about to dump, or will bulls hold the line? Share your thoughts below! 🧐🔥

ICP/USDT AT A KEY SUPPORT!📊 Weekly Analysis of ICP/USDT
🔥 ICP at a Key Support! Long Opportunity or Breakdown?
In the weekly timeframe, ICP has reached a critical support zone that has shown significant reactions in the past and is now being tested again.
🔍 Key Highlights:
📉 Increase in Selling Volume: As the price approaches this support, selling pressure has intensified, indicating potential weakness.
📊 RSI Below the 50 Average: Currently at 40.77, suggesting a lack of strong buying momentum.
🟢 Strong Weekly Support: The price is at a major weekly support level, which could trigger a bullish reaction if confirmed.
📈 Potential Scenarios:
✅ Bullish Scenario: If confirmation is received and the 4-hour timeframe box breaks, there is potential for an upward move toward the next key horizontal resistance at $14.55.
❌ Bearish Scenario: If the current support is lost, the next significant support zone is at $3.58, which could lead to further downside.
🔔 Conclusion:
ICP is at a critical decision point. Traders should watch for a breakout in the 4-hour timeframe before considering a long position. If support is lost, lower levels may come into play.
⚠ Given the market structure and conditions, always remember to manage your risk and capital wisely.
👀 What’s your take on ICP? Will this support hold? 👇🔥
#ICP #TechnicalAnalysis #Crypto #TradingView #RiskManagement

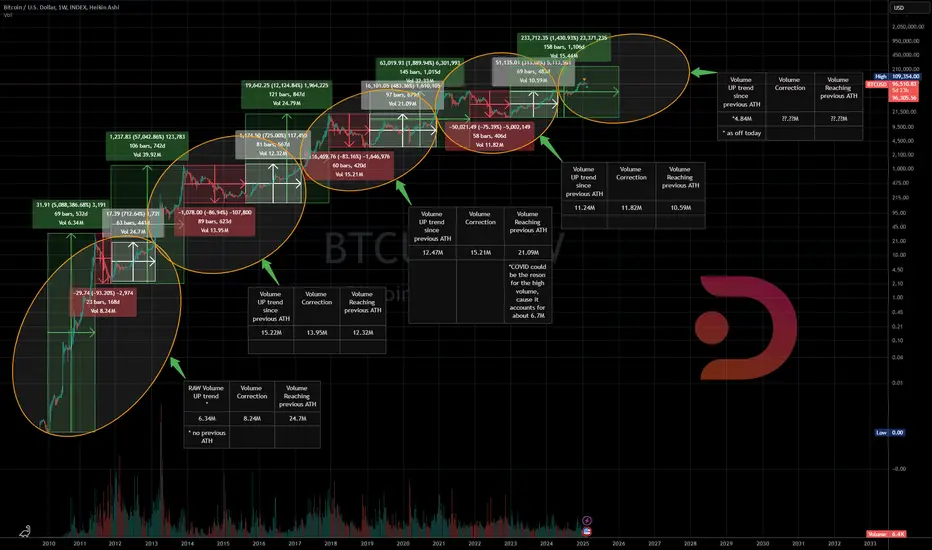
In-Depth Bitcoin VolumeData is on the chart.
The single most important indicator is the Volume.
There are certain anomalies in the volume that can be attributed to wash trading in the beginning or the Covid.
As you can see, since the early cycles, volume in price discovery has been steady.
More importantly, the current volume in price discovery is still very low.
There are lots of talks about how some mythical players are accumulating. For 21M of issuance, the volume is huge, IMO.
!!! It is not trading advice, but an overview of the market in the past and the current situation.
I do not advise investing in highly volatile markets like crypto unless you are prepared to mark losses.
Zcash (ZEC) Breakout: Sky’s the Limit!Zcash (ZEC) has successfully broken above key resistance, confirming bullish momentum. With the breakout in play, the next target zone sits around $41.50. Now that resistance is shattered, ZEC is primed for a powerful surge with little standing in its way.

STOP LOSS HUNTING STRATEGY 8.8% OR 10% REWARDSHORT AT STATISTICAL STOP LOSS FROM MAJORITY
Will short at where most put their stop loss. This strategy is valid for me because this forex pair is indicating a bearish sentiment and the strongest ever recorded. But there is no previous statistics on such a price action. So I will short your stop loss which is around 160-167 (Aggressive account) and 170.5 (Buy and hold account).
I have no believe in a bearish continuation beyon that, it will just carry on going bullish and I'm not interested into shorting or buying this premium as it was bullish for decades and will not offer an exit strategy and/or a decent Stop Loss size
Factors of confluence:
- Anchored VWAP 0.618 above
- Monthly SIBI Fair Value Gap acting as strong resistance
- Previous POC levels
Take Profit:
- EMA200 Weekly chart
- Previous Fair Value Gap level
- Previous Month POC of June 2023 that hasn't been retested and had a strong bullish candle
- Quarterly Q1 Pivot Support Levels

#ZEC–Bullish Reversal in Play? | Harmonic Pattern and DivergenceDowntrend Reversal in Sight?
#ZEC has been in a consistent downtrend and is currently at its lowest point. But the charts are telling a different story now.
Key Technical Highlights:
Harmonic Pattern: A clear Bullish Bat pattern has formed on the 1-day timeframe, signaling potential for reversal.
Bullish Divergence: We’re seeing a subtle bullish divergence, adding weight to the case for a potential trend reversal.
Resistance Break: The key confirmation level lies at 45.85. A break above this level will be our primary signal to go long.
What Does This Mean?
The technical indicators are aligning for a potential upward shift, but patience is key. We’ll need to wait for the resistance to break before entering the trade.
Once confirmed, we’ll be looking for a bullish entry at 45.85 with careful risk management in place.
Join the Discussion!
What’s your take on #ZEC? Are you seeing the same potential reversal, or is it too early to call?
Have you traded harmonic patterns before? Share your experiences below!

Moustafa! 09.02.25 My analysis and targets for Nasdaq!1- The last bullish wave from 04.02 till 06.02 was meant to fill the upper wick of the 31.01 day candle and to touch the upper yellow line of the symmetrical triangle. And once Mission is done, so a free fall happened to return back and to fill the gap of the 03.02 and 04.02 day candles. And up Touch the lower yellow line of the symmetrical triangle
But....
2- By looking to the sticky turquoise line I drew, you would find a could be a new formation of a short uptrend line and could be too a lower line of a symmetrical triangle so we have to give a huge attention to it as my target will be at the touch point with that line at 21060 which a price in between the low of the daily candles of 28.01 & 09.01 & 19.12 too, moreover on my Fib retracement retracement level of 23.60%. It could go lower to touch the yellow line but I chose the safer logic option in front of me to protect myself from sudden retrace.
And it could go further lower, then I would probably set another idea for it.
3- The last ATH was on 16th December and since then the index failed to super pass it! And we are since then, in a big consolidation area.
4- The two purple lines on the chart are from the 4h frame riding wedge, and as a result of breaking it from the its end or top, a free fall followed.
5- I still on my view of my last idea from the 7th Jan when I said that the real target of US 100 is when the index touches the green uptrend line below. That is the real target, but let us monitor the index step by step for now.
6- Let us go to an interesting part now, by looking at the daily candles volumes, you would find out that the bullish momentum was massive when index touched the lower yellow symmetrical triangle (the difference in volume between buyers and sellers) was plus 130.21K comparing to the previous day which finished on 24.01K plus (plus means green number or positive for bullish momentum) then the momentum massively decreased even if the prices were increasing as following:
On 04.02...… 34.34K plus
On 05.02...… 33K plus
On 06.02...…. 2.01K plus ONLY
And for sure that was an indication to a bearish day on 07.02 where I posted on the minds and made a good profit and I did not close my short on the weekend either.
The volume of day candle of 07.02 finished it 15.23K plus or green, which means, although it is in green, that the bullish momentum is weak than what is supposed to be on, as the index currently at so important price at 21500 which could turn to the upside back from. And in case it will, so I expect till maximum 21680 then back to my TP (may be not straight in a free fall but will reach to it soon)
Conclusion based on above
My take profit will be at 21060 till 20968
With a SL range at 22000
NOTE:
My ideas are exclusive to myself only and is not regarded as an advice for traders or investors and are not more than personal thoughts which I just wanted to share with you all and I do hope they could help.
I am not selling any signals and I do not take money favour any trades recommendations. They are free of charge all lifelong but I keep the copy rights of them though to not be copied or shared or sold.

AVAXUSDT, IMPORTANT SUPPORT WEEKLY?📊 AVAX/USDT – Weekly Analysis
🔥 Avalanche (AVAX) is currently at a critical support zone!
On the weekly timeframe, we can see that AVAX has been rejected from the $53.55 resistance, which was a key historical level. The price failed to break this zone, leading to a significant correction. Now, AVAX is testing an important support range between $24.60 – $20.12.
🔍 Key Observations:
📉 Bearish Structure: AVAX has formed lower highs, indicating weakness in the trend.
🔵 Moving Averages: The 30.04 (SMA) and 32.88 (SMA) are acting as resistance levels.
💹 RSI at 42.01: The RSI is near neutral territory but leaning towards oversold conditions, suggesting a potential reversal if momentum shifts.
📈 Potential Scenarios:
✅ Bullish Case: If AVAX holds above $24.60 and reclaims $30.04, we could see a retest of the $32.88 - $35.00 resistance zone. A breakout above $53.55 would confirm a long-term bullish continuation.
❌ Bearish Case: A breakdown below $20.12 could trigger a deeper decline toward the next major support at $15.00 - $17.00.
🔔 Final Thoughts:
For now, AVAX is at a make-or-break level. Traders should watch for confirmation signals and volume spikes before entering new positions. A strong bounce from support could present a buying opportunity, while a breakdown may lead to further downside.
What’s your take on AVAX? Share your thoughts below! 👇🔥
#AVAX #Crypto #TechnicalAnalysis #TradingView

US100 LongOf course no financial advice!!!!
It looks like that there is lots of liquidity in the market but the buying pressure is stronger than the selling pressure. We are in an uptrend so I guess the market wants to grab/sweep the Liquidity Levels and then continue flying up to the moon to the ATH and also grab there some liquidity.

US100 ShortAs you can clearly see all these wicks built liquidity and the market needs to take this for a strong uptrend.

EURUSD Long!NO FINANCIAL ADVICE!
As you can clearly see the market is in a very strong uptrend and some retails needs to be taken out of the market to continue... the worst thing that could happen in my opinion is that the chart goes a bit under my stop loss and takes this small range too. But all in all I'm pretty sure that my analysis are accurate. But you need to think about your own ideas!

PYPL: Zone 2PayPal returning to the 40wk ma after a stage 1 breakout. In an early stage 2 chart, touches on the 40wk tend to be good times to buy.

BTC key levels & key timesThis BTC/USDT 4H chart shows key resistance and support levels. Price is at $95,650, testing a critical zone. A breakout above GETTEX:98K within 3.25 days is crucial for bullish momentum toward the daily Bollinger top band at $105K. Failure to close above this could lead to a bearish drop. A potential rejection is marked with a red zone, indicating a downward trend. Volume analysis shows mixed activity. Traders watch for confirmation of either a breakout or breakdown to determine direction.

BTC OBV still looking bullishThe On Balance Volume indicator on the 1 day chart appears to be showing a bullish pattern of a bull pennant break out and retest. I've been watching this for a few months and I'm not convinced that the price of BTC is going to retrace significantly from here. I'll continue to watch this closely and see how it plays out.

Understanding Buy The Dip In TradingBuying the dip is a trading strategy where you take advantage of temporary price drops in an overall uptrend. The goal is simple: enter the market at a lower price before it resumes its upward move. It sounds easy, but knowing when and how to do it makes all the difference. In this guide, we’ll explore key setups, ideal market conditions, and smart risk management techniques to help you trade dips like a pro. 🚀
1. Understanding Market Structure 🏗️
Before jumping into a trade, it’s crucial to understand how price moves. A strong uptrend is characterized by higher highs and higher lows—this is where buying dips can be very profitable. But beware: not every drop is a buying opportunity. Some dips are part of a pullback, a temporary retracement before the trend resumes, while others signal a complete reversal—the last thing you want to buy into.
Key levels to watch include support zones, Fibonacci retracement levels, and high-volume areas. These zones act as potential turning points where the price is likely to bounce.
2. Proven Setups for Buying the Dip 🎯
🔢 Fibonacci Retracement Support
When the price pulls back within a strong trend, it often lands on key Fibonacci levels like 38.2%, 50%, or 61.8%. These act as natural support points where buyers step in. If a strong bullish candle appears at one of these levels, it can signal a solid dip-buying opportunity.
Combine this with an oversold RSI and rising volume, and you have a strong case for entry.
🎭 Liquidity Grab (Stop Hunt)
Markets love to shake out weak hands. Sometimes, the price dips below a previous low, triggering stop-loss orders before reversing sharply. This is called a liquidity grab—smart money accumulates positions while retail traders panic.
If the price quickly reclaims the level it just broke, it’s a strong buy-the-dip signal. Look for big buy orders, a sharp recovery, and bullish candlesticks to confirm entry.
📊 Anchored VWAP Test
Institutions often base their trades around VWAP (Volume Weighted Average Price), especially when anchored from a significant swing low. When the price revisits this VWAP in a strong uptrend, it’s a potential dip-buying zone.
Watch for bounces off VWAP, rising volume, and confluence with other support levels for confirmation.
🔥 Point of Control (POC) Revisit
Markets move towards areas of high liquidity. If the price revisits the Point of Control (POC)—the price level where most volume is traded in a range—it often serves as strong support.
When price pulls back into the POC and finds buying interest, it’s a great spot to enter. Look for strong reactions, failed attempts to move lower, and confluence with Fibonacci levels.
📏 Previous Range Support
A breakout from a trading range is significant, but the price often returns to retest the range high as new support before continuing higher. If this happens on low selling pressure and aligns with moving averages or VWAP, it can be a golden buy-the-dip opportunity.
Look for bullish reactions, buying volume, and strong candles off the level.
3. When Buying the Dip Works Best ✅
Not all dips are worth buying. The best setups occur when:
The market is in a strong uptrend, making higher highs consistently. 📈
Volume is high, showing that buyers are stepping in. 🔥
Macro conditions support upside movement, like favorable economic news. 📰
4. Risk Management: Protecting Your Capital 🛡️
Even the best traders take losses. What matters is how you manage risk:
Set a Stop Loss 🎯: Always place a stop below key support levels.
Position Sizing 📊: Never risk more than a small portion of your capital per trade.
Have an Exit Plan 🚪: Know where you’ll take profits, whether it's at a resistance level or a trailing stop.
Scale In and Out 🎢: Enter gradually instead of all at once, and take profits along the way to lock in gains.
Key takeaways 🎤
Buying the dip can be a powerful strategy—when done correctly. The key is patience: wait for strong trends, allow price to reach significant levels, and confirm with volume and momentum. Combine technical analysis with solid risk management, and you’ll improve your chances of success in the markets. Happy trading! 🚀

Nucleus at AVWAP on 14th FebNucleus Stock Analysis : 14th Feb 2025
Stock is trading below AVWAP Area.
Good to buy the stock once the price trade above the AVWAP line.

PEPSIIII - Long Term Super Over Sold ConditionsThis play does not make the much sense to me via a fundamental perspective regarding the economic outlook of companies like PEPSI, Coke and $KO. But, from an investment standpoint, they control the food/drink market and have seen stagnant numbers and low growth regarding there products. Our new leader RFK Jr. in the food industry might start a complete overhaul of the products forcing these companies to rethink there targeted audiences/ marketing campaigns and adapt to this generations pallet.
Short term it needs to build more structure and a foundation, on the other hand watch out for a V shaped reversal in the coming weeks.
Target #1 - $155
Target #2 - $160
Target #3 - $170
Stop Loss - $140
Stay tuned for option position longs, I will personally be investing money in them as well.

Brazil Stocks are Heating Up...I am seeing a huge volume profile imbalance at $10 and above.
I think this stock along with TSXV:XL will pop short/long term.
Target #1 - $10
Target #2 - $12
Watch for a pop and retest of the trend line for continuation.

Heavy Volume Build Up! Little Double Dip?Seen in the volume profile levels to the left, there is a large volume displacements and price looks like it wants $110 this week.
High amounts of calls at the $110 strike expiring 1/10. Its only right lol.
Large volume on the $130 & $150 strikes expiring 1/17
Price targets:
#1
$110 by end of week
#2
$120
#3
$140

Everyone wants $20, Here are my thoughts...Making this without looking at earnings numbers or there so called growth.
From what I am seeing in relative strength, $15 is the fair value price at the moment.
I am expecting to see a gap down to the $15 area and have it slowly or quickly climb to $20-$25.
If the inverse plays out, we will gap up to $20-$25 and then flash sell to $15 long term.
Right now, options market is wanting.
$20 for calls expiring 1-31.
$18 for calls expiring 2-07.
$17 for calls expiring 2-14.
BUT... a very large position of puts, expiring 02-28, is at the $12.5 strike.
I look at this as retail buying short term options expecting price to move there, while institutions have positioned themselves in longer term expiring contracts.

DOG. Is backed, you know?The previous entry point in January 2023, at its peak was x23 gains. If we consider the entry now - it is a point that is only 60% higher than the previous one. I am here again and I believe that the potential has remained the same. The local rebound can be up to 80%. After that, the moon cycle will begin.
