A Harmonic on Richtech Robotics? RRThis is another scenario in an otherwise bullish picture, technically speaking. Early days if the D in the XABCD is really forming, so like with most things time will tell. Fibonacci cluster levels show some static trading targets. In practice we never use static targeting in our trading.
Volume

Nifty : Continuing downside expected till Holi festival 2025 Nifty expected to downside till Holi festival 2025 below 22,750
just as Indian holi festival is coming, so Nifty chart parallelly describes the lyrics of it
Bura na mano, Holi Hai.... 2025
(FuTech : Chart is Art = Educational use only)

Contemplating a Pivot on Dell. DELLPivots, like fades are inherently more risky, but they must always be in the gameplay of any serious trader. They can be potentially very rewarding when they do eventuate and pose lost opportunity if ignored. We generally like at least five factors from five different perspectives to consider a position. Let's see how many this one has.
1. Momentum divergence (not the only one) on Jurik RSX
2. Volatility divergence on VZO plus offset
3. Cross of upper end of MIDAS envelope. Midas formula is based heavily on volumes.
4. Cross of both VZO and Ehlers Stochastic/RSI. This is not the vanilla Stochastic RSI calculation, after Ehlers rethought the indicator.
5. vWAP is now a support, but price action is not over extended beyond one sigma range.
There are more factors that can be put on the list, but this is not a competition - just a simple take on a stock. Manage your risk -trading is not gambling.

WORM. Long.This is how it could be if #CRYPTO dudes turn back to the way they were, considering dirty #market #Manipulation and Benjamin Cohen's tears about too many tokens being created and his #YouTube #ALTSEASON predictions not coming true. I encourage all degens aped in $WORM on #Solana

Divergence Trading Explained For Beginners -DAX Pullback TradeTrading divergence in the Forex or Stock market can be an important tool. Learn how to identify divergences & practically apply them to your technical analysis to increase your edge & profits in the financial markets.
In this video you'll learn
What is a bullish and bearish divergence
How to use divergence to spot potential reversals in the market
How to use volume to identify key levels of reversals
How to measure out a "Kill Zone"
What are tweezer tops & tweezer bottoms & why they are important
How to use the Fibonacci retracement tool
How to use the Relative Strength Index (RSI Indicator)
Your Trading Coach - Akil

CADCHF " BUY "Medium support Break out and retest.
Volume line of Fixed range volume break out and retest.

Breakout for MGO Global Inc. MGOLA nice gapping breakout, crossing every indicator line on the price chart on the background of momentum %pct divergences. This one could go far.

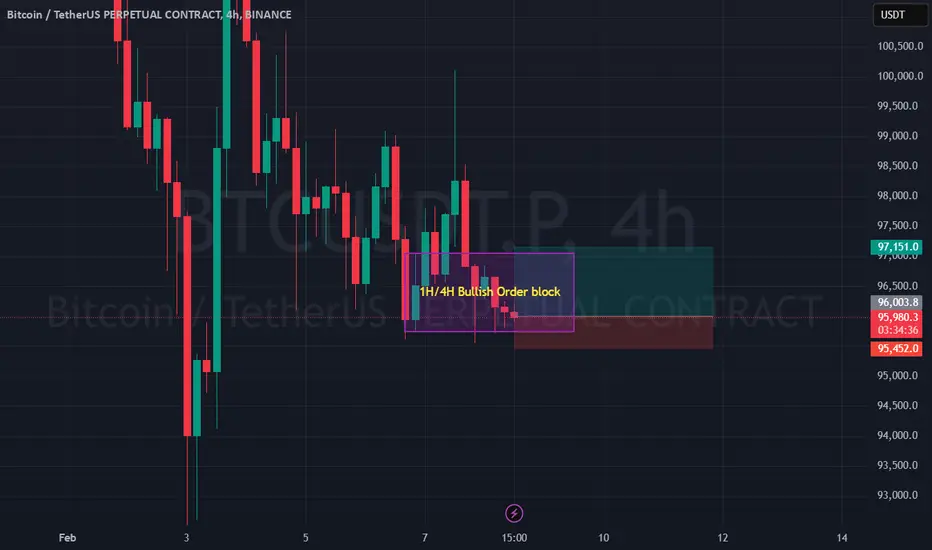
A small BTC longI entered a long position on BTC at 96,003.8, buying at the bottom of a 1H/4H order block. The confluence between these timeframes suggests strong bullish potential, as price often reacts positively when multiple timeframe order blocks align. My Take Profit (TP) is set at 97,151.0, while my Stop Loss (SL) is at 95,452.0.
Despite the bullish setup, I’m cautious because there’s a 4H Fair Value Gap (FVG) sitting right above my order block. This FVG could act as short-term resistance, limiting upward momentum. Given this, I’ve opted for a conservative TP to secure profits without overexposing myself to potential reversals.
Shorting BlackRock Back to Stone Age. BLKEllioticians will have fun with this one, because this is a debatable chart wave-wise. Now what else is going on here technically? Volumes, volatility stochastics and momentum are downgoing. Bollinger Bands are no doubt showing something bearish undergoing as well. US/vWAP cross and resting above candles as well. This is a constellation that can't be not taken seriously.

Reversal on Vertex Pharmaceuticals. VRTXMean reversion strategy in a fade for the most recent rally. Here, we are betting that the rally, now in OBOS, will not cross the most recent high of highs. More specifically, that the price action will not exceed one std deviation of the vWAP value. There are divergences on the indicators below to support trend weakness, and historically nothing stays in OBOS too long. Ellioticians may appreciate a flat forming now.

Long term $180-$190 target. More downside likely short term.I think short term we can see a final push down. Company has way to much in OP EX and once it can figure out how to remove/cut the amount in half, this stock will show to investors that it has a plan for long term profitable growth.
Question is, which earnings report will it be and/or will they release news on lay offs once unemployment really spikes.
BUY THIS STOCK IN MY PINK ZONE AND HOLD 2-5 YEARS.
my main concern right now is AI hype flushing down and/or there cash on hand and free cash flow continues on its down trend...

BTC HEADED NORTH?? the coin seems to be flipping up out of the riddlers hand, batman sees a big w in the sky.
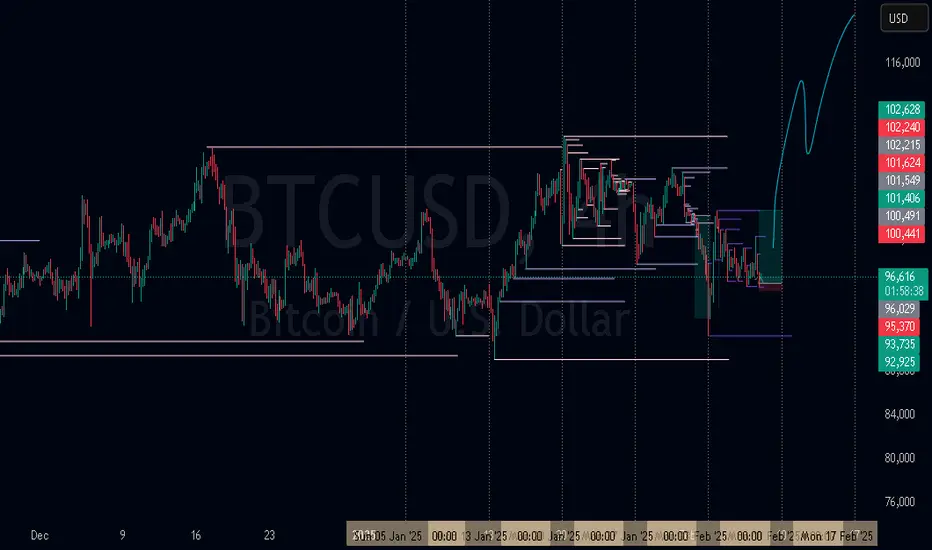
Starting a Bitcoin Analysis Series – February EditionI’m kicking off a Bitcoin analysis series for February , where I’ll be sharing quick and to-the-point updates on the Bitcoin chart throughout the month. Alongside that, I’ll also post my trade ideas as they develop. The goal is to stay on top of the price action and navigate the market with clear, structured setups.
I might not be able to catch every single move, but I’ll do my best to cover the most relevant ones. Hopefully, this will lead to some solid trades and strong results. At the end of the day, it’s not that complicated—you just have to trade what you see .
Looking forward to an exciting month in the crypto market!

Correlation between ZB1! and xxx/usd pairs The 30 Year treasury bonds (ZB1!) is an asset that is really negative correlated with DXY and positive correlated with the other G10 currencies (XXX/USD). Historically The ZB tends to be bearish during the first 2 weeks of february

PYPL : Another Dive or Finally Time to Buy?PayPal (PYPL) has been getting slapped around like a rookie in a heavyweight fight. The stock is now chilling above a thick support zone—right above the 50% and 61.8% Fibonacci retracement levels. Sounds like fancy chart talk, but all it really means is: This could be where the pain finally stops.
There's also an unfilled gap across multiple timeframes, and gaps like these tend to get filled at some point. If NASDAQ:PYPL keeps sliding, it might take out the previous quarterly low. Why does that matter? Because these lows act like a magnet, dragging price down just enough to shake out weak hands before launching higher. That’s when the selling pressure finally dies down. And the RSI? Almost in the basement—last time we saw this (November 2023), PYPL ripped higher shortly after.
My plan? Set alerts, watch closely, and pounce when the signs point to a reversal. I’m not about to catch a falling knife, but if this thing turns around, I sure as hell don’t want to be left behind.

EURUSD H4Fx Market is all about Sl not Tp. in consoledating market u have to Give money to the market but the key point is about taking again and again with suitable Risk Reward ratio.
so I take this Eurusd again course I had sl last week. let see what happen next <3

Boeing is still flying. BAPretty strong evidence for continuation of upward price action o this one. We are certainly waiting on a RSX momentum divergence to form here, hopefully in the upwards of 1.0 Fibonacci extension of the immediately previous move. Markets are very fluid, and as such percentage probabilities vary with time passing. What looks right today, may not look so tomorrow.

Bitcoin and altcoin overview (February 07-08)The Bitcoin scenario has remained almost unchanged. We are still expecting a resurgence of buying activity. Selling pressure remains weak, and absorption is visible in the cumulative delta.
We are considering a long position either on a test of the nearest buyer's zone below or after a breakout of the trendline followed by a retest.
Sell Zone:
📍 $107,000–$109,000 (volume anomalies)
Buy Zones:
📍 $95,000–$93,000 (volume anomalies)
📍 $89,000–$86,300 (accumulated volumes)
As for altcoins, we currently don’t see any clear setups.

Betting on Cool Down at Thermo Fischer. TMOIt's not a perfect butterfly, but I am willing to take a shot given the wealth of evidence in the background from our algorithmic indicators. MIDAS cross line plus resistant vWAP and US, which also crossed 4-5 candles ago, plus cross on VZO and heralding cross on Stoch/RSI. BB %PCT is about to flip also. Highly, highly suggestive picture.

Bearish on Salesforce. CRMA very nice confluence here as well. The most glaring is the green MIDAS line cross on the background of downgoing vWAP, US lines, which are above the candlesticks. Looking below, the picture adds more confidence in crossing of the midline for both VZO and Ehlers Stoch/RSI indicators. Price action alone is very bearish. Good luck out there.

OIH: 10% upside for an old trump tradeOIH is at a crossroads after suffering two setbacks in as many months. A 10% rally could propel it back to its November zenith. OBV is still supportive.

Bitcoin. Eternal Channel.Bitcoin faces ambiguous resistance in the $100k region and there is a threat of deliberate price manipulation to create artificial importance at this level. Price is at a decision point. A supply crisis is coming.

Bitcoin and altcoin overview (February 06-07)Yesterday, Bitcoin's scenarios remained unchanged. We failed to break the newly formed local low, meaning we can still expect consolidation above the $99,200–$98,000 local buy zone and a potential upward movement from current levels.
An alternative scenario remains a move toward a stronger buyer volume zone below, followed by the formation of a reversal structure for a long position.
Sell Zone:
$107,000–$109,000 (volume anomalies).
Buy Zones:
$95,000–$93,000 (volume anomalies).
$89,000–$86,300 (accumulated volumes).
Interesting Altcoins:
VVV is showing weakness during the upward move, with formed volumes not positioning as buyer volumes.
We are considering a short position either through a false breakout of the local high or after breaking below the $5.3–$4.83 volume zone, followed by a retest from the opposite side.
Additionally, the SWARM setup described yesterday remains relevant.
