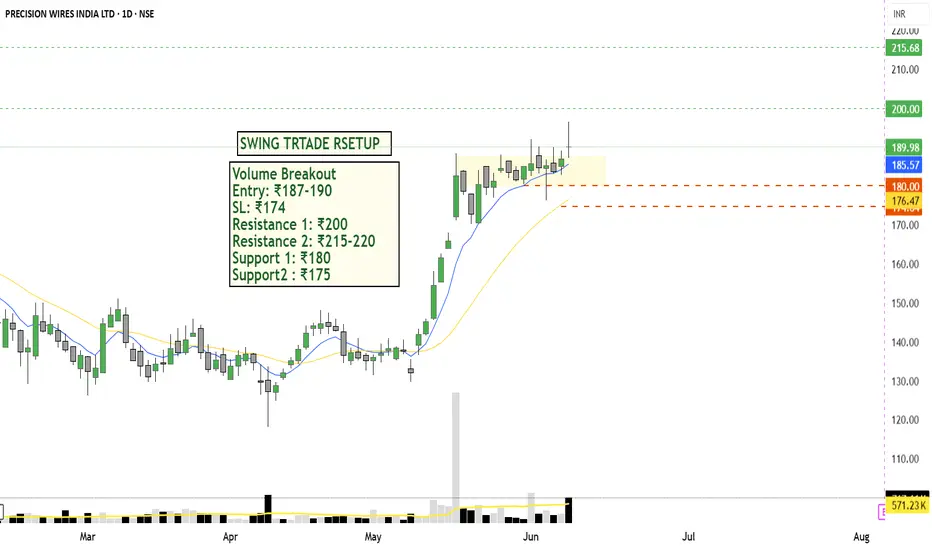
Precision Wires India Ltd: Breakout + Fundamental Bullish SetupTechnical Analysis (Daily Timeframe)
Breakout Pattern: consolidation breakout with Strong bullish DOJI candle above ₹185–₹187
Volume Confirmation: with a spike in volume (767.6K vs avg 571.2K)✅ Yes
Trend: Strong uptrend; Higher Highs & Higher Lows
Bullish momentum intact Price above 20 EMA & 50 EMA
FUNDAMENTALS ANALYSIS : Company fundamentals are fully strong, company low debt and high reserves make it fundamentally strong
PROFIT & LOSS:
Company revenue increased YOY
Company net profit good
Profit Margin improved from 3.9% to 4.2% that is the good sign.
🔼 Steady revenue growth with increasing margins shows operational efficiency and cost management.
Fundamental Summary
Parameter Verdict
Earnings Growth : Consistent YoY
Financial Health : Excellent
Promoter Holding: Stable & high
Business Model: Stable & scalable
Trade conclusion:
Strong volume Breakout from Consolidation
Earning Growth and ROCE >15%
Debt free company with high promoters confidence.
Good Sector
📢 Disclaimer: Not investment advice. Do your own research (DYOR). This idea is shared for educational and tracking purposes.
Volume
GBP/USD - confirmation with VWAP On GBP/USD , it's nice to see a strong buying reaction at the price of 1.33240 .
There's a significant accumulation of contracts in this area, indicating strong buyer interest. I believe that buyers who entered at this level will defend their long positions. If the price returns to this area, strong buyers will likely push the market up again.
VWAP + Uptrend and High volume cluster are the main reasons for my decision to go long on this trade.
Happy trading
Dale

NQ - (FVG) - Fair Value GAPOn NQ , it's nice to see a strong buying reaction at the price of 21685 .
There's a significant accumulation of contracts in this area, indicating strong buyer interest. I believe that buyers who entered at this level will defend their long positions. If the price returns to this area, strong buyers will likely push the market up again.
(FVG) - Fair Value GAP and high volume cluster are the main reasons for my decision to go long on this trade.
Happy trading
Dale

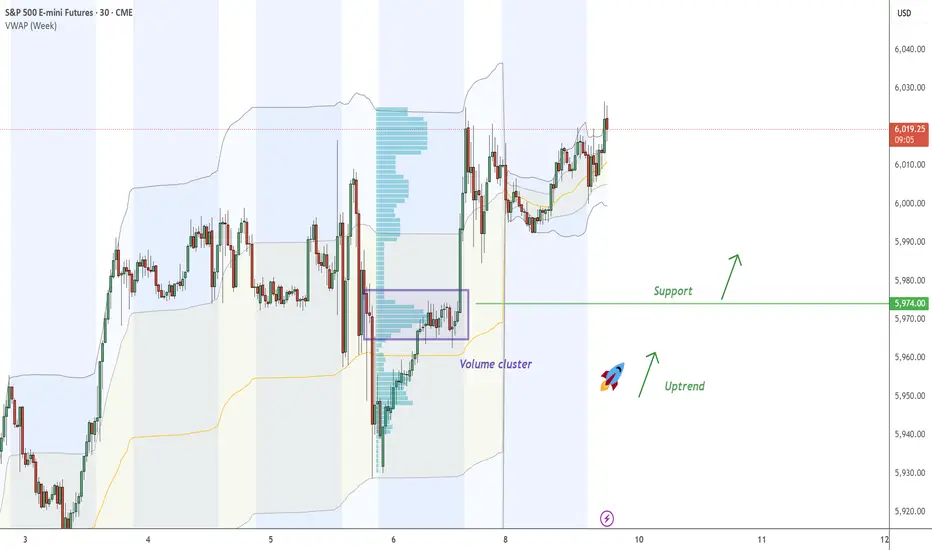
ES - continue with the UptrendOn ES , it's nice to see a strong buying reaction at the price of 5974.00 .
There's a significant accumulation of contracts in this area, indicating strong buyer interest. I believe that buyers who entered at this level will defend their long positions. If the price returns to this area, strong buyers will likely push the market up again.
Uptrend and high volume cluster are the main reasons for my decision to go long on this trade.
Happy trading
Dale
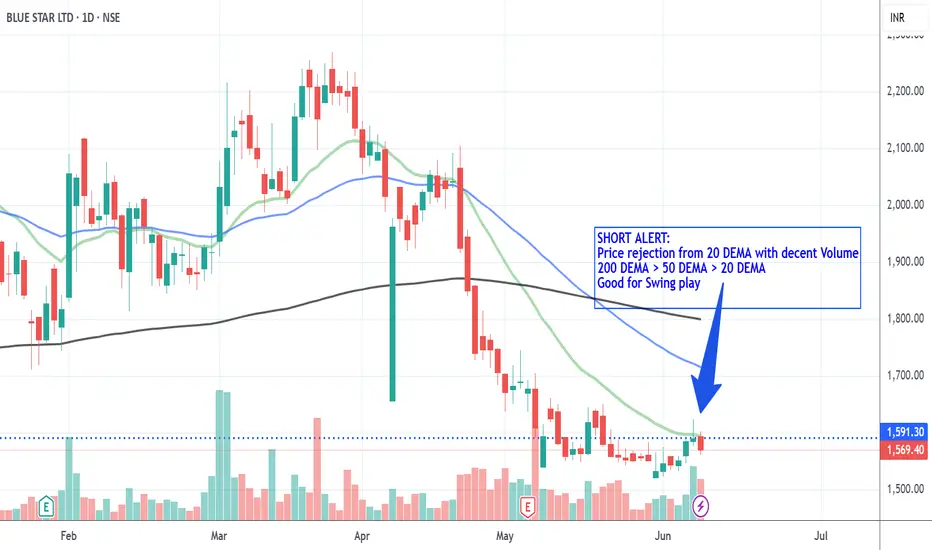
BlueStar_ShortSHORT ALERT:
Price rejection from Resistance & 20 DEMA with decent Volume
200 DEMA > 50 DEMA > 20 DEMA
Good for Swing play
Disc: Educational Purpose Only
Pinex-Capital Trade IdeaThe chart shows a bullish daily structure with a higher volume range and positive momentum. The first long idea is based on a pullback to the value area high or the 0.5 Fibonacci zone around 0.6498. Should the market test this area and show buyers there, this would be an opportunity for a long entry with a target in the area of the recent high at 0.6538. The stop can be placed slightly below the 0.618 level at 0.6484.
A second long opportunity arises on a breakout above the recent high at 0.6538. If the price breaks above this zone with volume and stabilizes there, a procyclical long can be entered with a target towards 0.6560+ (next psychological level). The stop should be placed just below the breakout level.

Pinex-Capital Trade IdeaThe second chart shows a bullish daily structure with a higher volume range and positive momentum. The first long idea is based on a pullback to the value area high or the 0.5 Fibonacci zone around 0.6498. Should the market test this area and show buyers there, this would be an opportunity for a long entry with a target in the area of the recent high at 0.6538. The stop can be placed slightly below the 0.618 level at 0.6484.
A second long opportunity arises on a breakout above the recent high at 0.6538. If the price breaks above this zone with volume and stabilizes there, a procyclical long can be entered with a target towards 0.6560+ (next psychological level). The stop should be placed just below the breakout level.

Pines-Capital Trade IdeaThe second chart shows a bullish daily structure with a higher volume range and positive momentum. The first long idea is based on a pullback to the value area high or the 0.5 Fibonacci zone around 0.6498. Should the market test this area and show buyers there, this would be an opportunity for a long entry with a target in the area of the recent high at 0.6538. The stop can be placed slightly below the 0.618 level at 0.6484.
A second long opportunity arises on a breakout above the recent high at 0.6538. If the price breaks above this zone with volume and stabilizes there, a procyclical long can be entered with a target towards 0.6560+ (next psychological level). The stop should be placed just below the breakout level.

Pines-Capital Trade IdeaThe chart shows a bullish daily structure with a higher volume range and positive momentum. The first long idea is based on a pullback to the value area high or the 0.5 Fibonacci zone around 0.6498. Should the market test this area and show buyers there, this would be an opportunity for a long entry with a target in the area of the recent high at 0.6538. The stop can be placed slightly below the 0.618 level at 0.6484.
A second long opportunity arises on a breakout above the recent high at 0.6538. If the price breaks above this zone with volume and stabilizes there, a procyclical long can be entered with a target towards 0.6560+ (next psychological level). The stop should be placed just below the breakout level.

TSLA – Are You Buying Cheap or Buying Expensive?Tesla (TSLA) continues to trade within a long-standing macro range, well-defined by two behavioral zones:
🟩 Value Zone – Accumulation ($132 to $270.50):
This is where smart money tends to accumulate over time. Historically, moves from this zone lead to long-term rallies. Price spent multiple weeks here during major drawdowns — offering long-term entries at discounted value.
🟥 Premium Zone – Profit Taking ($270.50 to $409):
Above the midpoint ($270.50), price enters what can be considered the “expensive” territory. Historically, this area has acted as a supply zone, with frequent distribution and sharp reversals.
TSLA is currently sitting just above the midpoint, testing that equilibrium. Whether it consolidates for another leg higher or fails here could define the next swing move.
So ask yourself:
Are you buying value, or chasing premium?

PLTR 479% Parabolic Rally Meets RSI Divergence at Critical ZonePalantir (PLTR) has completed a near-perfect parabolic advance, rising more than 479% over 378 days from its demand base in early 2024. The move has been relentless — supported by breakout volume and accelerating price structure.
However, we are now at a potential inflection point.
Price is stalling at the upper end of the parabolic curve, right near a prior rejection level. At the same time, the RSI has been forming multiple bearish divergences, signaling weakening momentum despite new highs.
This exact combination — parabolic rise + RSI divergence — has preceded sharp corrections in the past.
The previous drop from this region led to a -47% decline, which found support in the $70–75 zone — now marked as a 2D demand area. That zone could again act as a magnet if momentum fades.
If PLTR breaks above $135 with strong volume, the divergence could be invalidated, but for now, the chart suggests caution. This may be a topping structure or the start of a broad sideways range.

Liquidity BandsI start using the stablecoins mcap as channels, that way you see when the market is overpriced compared to the actual volume of inflows.
It basically envelopes the coin's pricing relative to the actually available liquidity.
"Liquidity Bands", if you will

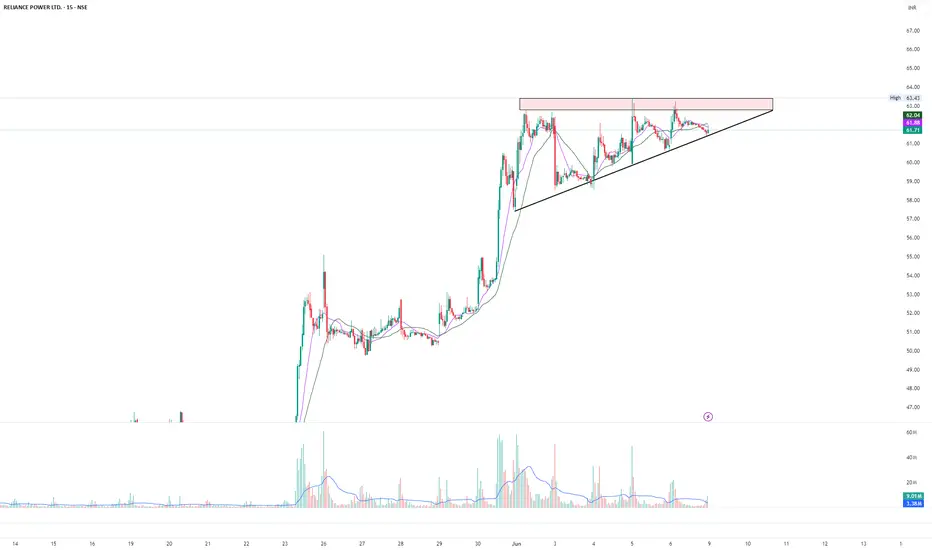
Ascending triangle in RPOWEROn short term chart, Rpower has created ascending triangle. This is after stock has moved up with a higher relative volume. This triangle suggests consolidation of upmove and further movement is highly probable.
As you can see, volume on up bars is huge as compared to down bars. This suggests higher interest in stock.
Breakout of 63.43 can give further upside.
GOLD 4HLocal range near top of broader sideways (gray lines = local range).
Seller broke down from it.
Price now in buyer zone — possible buyer reaction. Just below: a gap.
Seller targets: 3271, 3245.
Conservative shorts: watch for buyer activity + seller defending local range breakout (3333).
Note: buyer initiative still active on daily TF (!).
For longs, better to wait near 3245–3271 and look for bullish patterns.
This analysis is based on the Initiative Analysis concept (IA).
Wishing you profitable trades!

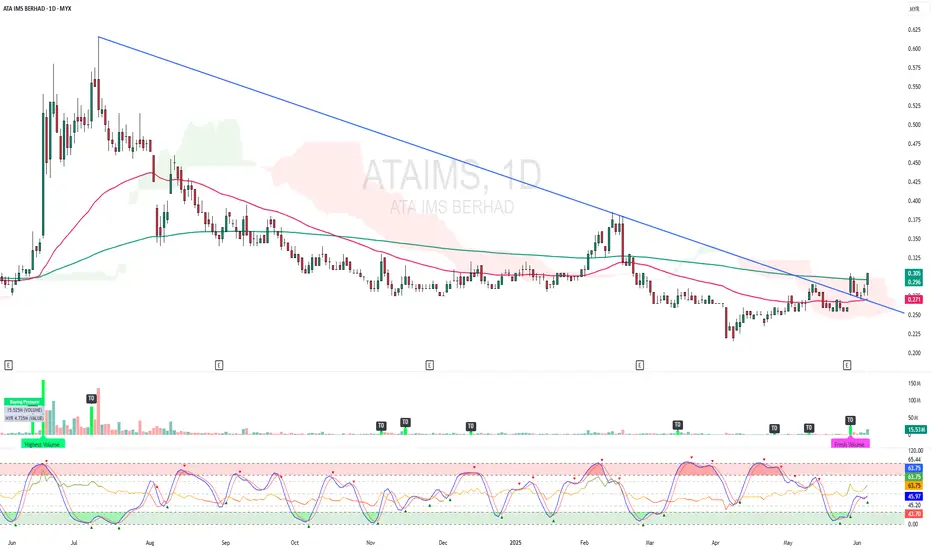
ATAIMS - BREAKOUT EMA 200 and CLOUD !ATAIMS - CURRENT PRICE : RM0.305
ATAIMS is bullish as the price is above EMA 50 and 200. The stock broke above EMA 200 and ICHIMOKU CLOUD on last FRIDAY (06 JUNE 2025) with high volume. Supported by technical reading in RSI heading upward, the stock may continue to move higher in the upcoming session.
ENTRY PRICE : RM0.300 - RM0.305
TARGET PRICE : RM0.340 and RM0.370
SUPPORT : RM0.270
Bitcoin to 120k or 150k next?The last setup on BITSTAMP:BTCUSD played out exactly as predicted. ()
As of today, June 8, 2025, Bitcoin is trading around $105,000 - $106,000 USD.
And it's been retesting the zone for quite a long time and it's time it broke out! It's less likely to reverse now (Still a possibility tho).
Predictions for Bitcoin's future price is wide, as many analysts are quite bullish:
Year-End 2025: Some experts are eyeing $150,000 USD and more by the end of 2025, citing factors like global liquidity expansion and continued institutional interest.
Do you think it's a possibility?

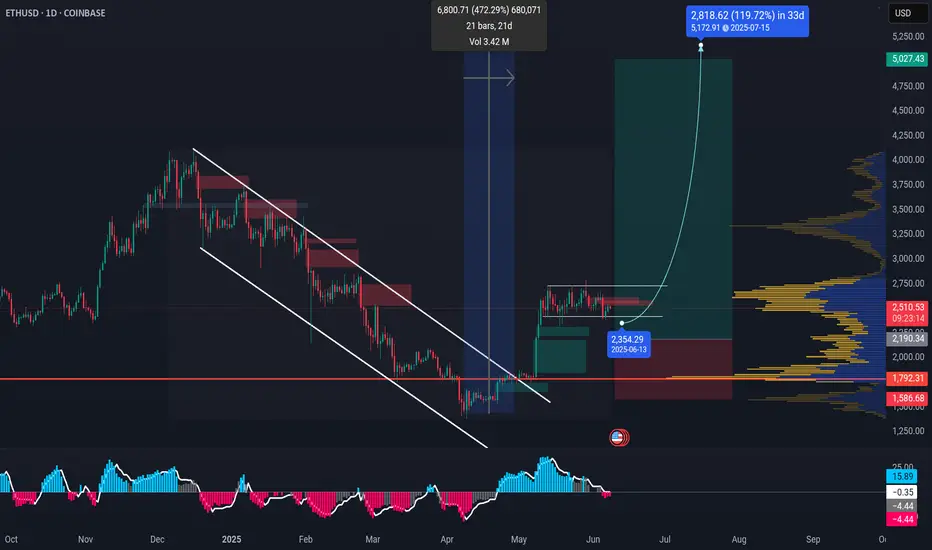
ETHEREUM is stacking up to fly! BINANCE:ETHUSDT ETHEREUM got a lot going for it right now. It's the backbone of a huge chunk of the crypto world, especially with all the DeFi and NFT stuff happening. Plus, there's always talk about big upgrades that could make it even better.
Right now, Ethereum's trading around $2,500, but some experts expect that it could climb way higher, maybe even past $8,000, if everything goes right.
That aside, I personally think $5,000 is achievable and to happen soon. It clearly broke out of the months long downtrend channel and with momentum. There's a lot of hate for ETH just for being expensive. But, let's be real, is not the 2nd biggest player in the market for nothing.
Let me know what you think? Open to counter ideas!
BINANCE:ETHUSDT

JINDAL STAINLESS Breaks the Channel – What’s Next?After completing a long WXY correction, Jindal Stainless has flipped into a strong uptrend. The price broke above the downtrend channel and also reclaimed the 200-day moving average — confirming strength.
The rally from 504 has unfolded as a nested 1-2, 1-2 impulse, and the wave 5 has now entered its 1 to 1.618 projection zone. We’re likely entering a blue Wave 4 pullback, especially as:
RSI shows bearish divergence
The rally looks stretched short-term
A healthy retracement toward the 661–640 zone can follow.
As long as 633.35 holds, this bullish structure remains intact.
Trend : Bullish
Retracement zone : 661.80 – 640.65
Invalidation : Below 633.35
This is a dynamic setup. Chart will be updated as price action unfolds
Disclaimer: This analysis is for educational purposes only and does not constitute investment advice. Please do your own research (DYOR) before making any trading decisions.

BITCOIN - HTF.HTF analysis on Bitcoin:
Anyone with eyes can read the Monthly structure and bias as being bullish, April swept the prev ATH at 108K, tapping the 111K levels, before selling off sharply (to be expected, price must come down, to go up, after all!). - Monthly context shows we need to do just that, and this week, we did!
I had the target as the Weekly Bullish FVG residing at 100K, and expected the reaction we have seen, however, now is where it gets interesting - as we can see on the Daily (TF of the chart in this example), we can see that price ran a daily ITL as well as 4H liquidity levels, on its way into the W FVG (happened on Thurs, not Fri, which was interesting considering the RFN on friday), and has since shown bullish displacement back to the upside.
Current Daily targets are 105-108K levels, if Bulls can recapture this area, we can expect some form of consolidation before another leg up. The ETF's (in my opinion) were the institutions and their 'Trojan Horse's' - so the higher we go, the more we can expect sell offs in the form of profit taking via institutional profit taking.
Conclusion - BULLISH BIAS, WITH THE HTF TARGETS BEING DAILY HIGHS, AND THE OVERALL MONTHLY TARGET OF A NEW ATH - 125K is the next logical HTF target based off a trend-based Fib extension.

Bearish Structure Still in Control, But a Twist is PossibleALKEM continues to respect its larger downward channel, forming what looks like a classic W-X-Y corrective structure.
Wave W unfolded as a zigzag .
Wave X developed as a contracting triangle , ending near ₹5400.
The current drop appears to be the start of Wave Y , possibly forming another zigzag.
As long as price stays below ₹5460 (the 0.5 retracement of the entire W-Y structure), the bearish setup remains valid.
The RSI breakdown below 40 adds strength to the bearish bias. The projected Wave Y could extend toward the ₹3450 zone if symmetry with Wave W plays out.
Alternate Bullish Scenario :
While bearish remains the primary view, there's a low-probability bullish alternate :
If the move from the February lows to ₹5400 was actually a leading diagonal, then the current fall could be a Wave 2 correction. A sharp reversal from above ₹4491 might trigger a bullish breakout toward new highs.
Chart will be updated as price action evolves.
Disclaimer: This analysis is for educational purposes only and does not constitute investment advice. Please do your own research (DYOR) before making any trading decisions.

Opendoor Technologies | OPEN | Long at $0.60Opendoor Technologies $NASDAQ:OPEN. This is purely a swing trade for a company that has been posting declining earnings and revenue since 2022 and does not anticipate becoming profitable in the next 3 years. Since the stock is now under $1, it's at-risk of being delisted from the Nasdaq. I am entering this play because there is a chance the recent price hit near $0.50 may be a temporary bottom and there is enough short interest (near 18%) for a spike near its book value of $1.00. Quick ratio is 0.75 (i.e. company may have difficulty meeting its short-term obligations without selling inventory or acquiring additional financing). While the company may be forced to do a split (a major risk for this purchase), I can see other eyes viewing this as a potential "quick play" for a reversal near its book value.
At $0.60, NASDAQ:OPEN is in a personal buy zone for a swing trade.
Targets:
$0.87 (+45%)
$1.00 (+66.7%)

Netflix (NFLX) RSI Bearish Divergence Setting Up Major Rever📈 Summary:
Netflix has rallied +44% in just 60 days, entering a steep, parabolic move. However, technical exhaustion signs are now flashing across multiple indicators — suggesting a potential near-term top may be forming.
🔍 Key Technical Observations:
1. Bearish RSI Divergence
The RSI is making lower highs (~73) while price makes higher highs → classic bearish divergence.
Similar divergences in December and February led to drops of –12% and –18% , respectively.
2. Parabolic Move + Rising Wedge
Price has broken out of an orderly channel and is now moving parabolically , a pattern typically unsustainable.
The current structure resembles a rising wedge , often a reversal formation .
3. Volume Weakness
Volume has been declining throughout the recent push , signaling weak demand behind the rally.
No climactic buying — this raises the risk of a sharp drop if momentum fades .
4. MACD Losing Momentum
MACD histogram has flipped slightly negative.
A potential bearish crossover is brewing.
🧭 Strategy Outlook
🚨 Aggressive traders could look for short opportunities below $1,240 , where support may break.
🧠 Options traders might consider a bear call spread once a daily close confirms the wedge breakdown.
📌 Key Levels
Support to watch: $1,240 (break = confirmation)
Next support zone: $1,190–1,155 (EMA cluster)
Critical RSI trigger: break below 65 confirms bearish divergence playing out
🧩 Final Thoughts
The RSI divergence, parabolic structure , and volume behavior all align for a potential pullback . While the trend is still technically intact, risk-reward favors preparing for a reversal , especially with prior divergences leading to significant downside.
