Liquidity ≠ Volume: The Truth Most Traders Never Learn█ Liquidity ≠ Volume: The Truth Most Traders Never Learn
Most traders obsess over volume bars, but volume is the footprint, not the path forward.
If you’ve ever seen price explode with no volume or fail despite strong volume, you’ve witnessed liquidity in action.
█ Here’s what you need to know
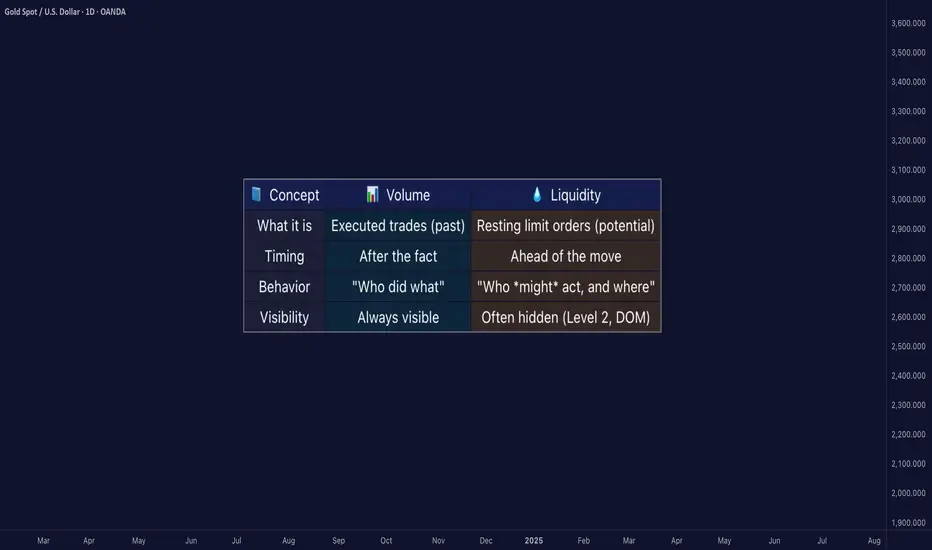
⚪ Volume Is Reactive — Liquidity Is Predictive
Volume tells you what happened.
Liquidity tells you what can happen.
█ Scenario 1: Price Jumps on Low Volume
❝ A price can jump on low volume if no liquidity exists above.❞
⚪ What’s happening?
The order book is thin above the current price (i.e., few or no sellers).
Even a small market buy order clears out available asks and pushes price up multiple levels.
Volume is low, but the impact is high because there’s no resistance.
⚪ Implication:
This is called a liquidity vacuum.
It can happen before news, during rebalancing, before session openings, on illiquid instruments, or during off-hours.
Traders often overestimate the strength of the move because they only see the candle, not the absence of offers behind it.
█ Scenario 2: Move Fails on High Volume
❝ A move can fail on high volume if it runs into a wall of offers or bids.❞
⚪ What’s happening?
There’s a strong surge of aggressive buying or selling (high volume).
But the order book has deep liquidity at that level — large resting limit orders.
The aggressive traders can’t chew through the liquidity wall, and price stalls or reverses.
⚪ Implication:
This is called liquidity absorption.
Market makers or institutions may intentionally absorb flow to stop a breakout.
Many retail traders mistake this for “fakeouts,” but it’s really liquidity defending a level.
⚪ What the Research Says
Cont, Stoikov, Talreja (2014): Price responds more to order book imbalance than trade volume.
Bouchaud et al. (2009): Liquidity gaps, not trade size, are what truly move markets.
Hasbrouck (1991): Trades only impact price if they consume liquidity.
Institutions don’t chase candles — they model depth, imbalance, and liquidity resilience.
⚪ Where the Alpha Lives
Liquidity tells you where the market is weak, strong, or vulnerable — before price moves.
Fakeouts happen in thin books.
Reversals occur at hidden walls of liquidity.
Breakouts sustain when liquidity follows the price, not pulls away.
If you understand this, you can:
Enter before volume shows up
Avoid chasing dead breakouts
Fade failed moves into empty space
█ Final Truth
Volume is the echo. Liquidity is the terrain. Alpha is in reading the terrain. You want to study the structure, because price moves toward weakness and away from strength. Learn to see where liquidity is, or where it’s missing, and you’ll see trading with new eyes.
-----------------
Disclaimer
The content provided in my scripts, indicators, ideas, algorithms, and systems is for educational and informational purposes only. It does not constitute financial advice, investment recommendations, or a solicitation to buy or sell any financial instruments. I will not accept liability for any loss or damage, including without limitation any loss of profit, which may arise directly or indirectly from the use of or reliance on such information.
All investments involve risk, and the past performance of a security, industry, sector, market, financial product, trading strategy, backtest, or individual's trading does not guarantee future results or returns. Investors are fully responsible for any investment decisions they make. Such decisions should be based solely on an evaluation of their financial circumstances, investment objectives, risk tolerance, and liquidity needs.
Volumetrading
Bitcoin at 120,000: Decisive Breakout or Renewed Consolidation?__________________________________________________________________________________
Technical Overview – Summary Points
__________________________________________________________________________________
Momentum: Strongly bullish on H1 and above; healthy consolidation below ATH.
Supports/Resistances: 120,000 USDT (pivot resistance), 116,400–117,000 (major support), 104,000–110,000 (long-term support).
Volumes: Normal, no anomaly nor climax detected.
Risk On / Risk Off Indicator: Strong buy signal on all timeframes except very short term. Sectoral health confirmed.
Multi-timeframe: Short-term bearish divergence on 15/30min, but robust technical structure above H1-D1.
__________________________________________________________________________________
Strategic Summary
__________________________________________________________________________________
Global bias: Confirmed bullish across all timeframes; no major break detected.
Opportunities: Strategic buys between 116,400–117,000 (pullback); confirmed breakout above 120,000 (target 130,000).
Risk zones: Below 116,000 (potential correction to 112,000–104,000), false breakout at the top.
Macro catalysts: Monitor Fed (next FOMC July 29-30), volatility on risk assets, geopolitical tensions.
Action plan: Prioritize stop management, stay reactive ahead of macro events. Main scenario: buy confirmed pullback or validated breakout.
__________________________________________________________________________________
Multi-Timeframe Analysis
__________________________________________________________________________________
1D / 12H: Bullish structure intact but facing historical resistance (120k), strong supports in place (104–107k).
6H / 4H / 2H: Consolidation below resistance, no signs of exhaustion, tactical supports at 116,000–117,000.
1H / 30min / 15min: Weakness on shorter timeframes (sellers at top), confirmation of range polarization. No emotional excesses (ISPD DIV neutral), standard volumes.
Risk On / Risk Off Indicator: Strong buy except for very short-term fatigue.
Summary:
Multi-horizon bullish bias, technical and sectoral confluence for upside extension if clear breakout >120,000. Key support to hold at 116,400–117,000. Buy dips, ride breakout up to 130,000. Focus on risk management, flexibility advised as macro (Fed) nears.
__________________________________________________________________________________
Key macro events to watch
__________________________________________________________________________________
2025-07-18: Fed rate/volatility debate (Equity, Bonds, BTC).
2025-07-29: FOMC (potential pivot for risk assets).
__________________________________________________________________________________
Strategic decision & final summary
__________________________________________________________________________________
Main bias: Bullish, to be validated at key levels, favor buying dips/breakouts.
Risk management: Stop below 116,000, scale out progressively after 125k, reinforced protection ahead of FOMC.
Opportunities: Pullback 116,400–117,000 (RR >3); H4/D breakout >120,000 targeting 130,000 (RR >2).
Monitoring: Macro (Fed, geopolitics), dynamic management according to market response to news.
Conclusion:
A validated move above 120,000 projects target to 130,000 (next statistical/on-chain extension). Deep dips can be bought above 104,000. Do not loosen risk management as Fed date approaches.

Why Volume Bar Colors Can Mislead You█ The Truth Behind Volume Bars — What Do Green and Red Actually Mean?
Most traders learn early on that green volume bars mean bullish activity, and red bars mean bearish pressure. But is it really that simple? What does volume truly reflect, and are we making assumptions that can mislead us?
█ What Volume Actually Is
Volume represents the number of shares/contracts traded during a specific time interval. Every transaction includes both a buyer and a seller. So, volume itself doesn’t distinguish whether a trade was bullish or bearish. Instead, platforms color volume bars based on price movement:
Green: If price closed higher than it opened.
Red: If price closed lower than it opened.
Some platforms, like TradingView, allow you to color volume based on whether the price closed higher or lower than the previous candle’s close.
So YOU, as a trader, have the chance to decide whether to assign volume bars either bullish or bearish! It’s a setting parameter anyone can change. Traders around the globe might look at the same volume bar, but some interpret it as bearish, while others interpret it as bullish. What is the most correct way?
█ The Assumption Behind the Color
This coloring assumes that:
A rising price means buyers were more aggressive (lifting the ask).
A falling price means sellers were more aggressive (hitting the bid).
This is a proxy — an approximation. It simplifies market pressure into a binary outcome: if price goes up, it's bullish volume; if it goes down, it's bearish. But the market isn't always so binary.
However, the assumption is only an approximation of buying vs. selling. In reality, every single trade involves both a buyer and a seller, so volume itself isn’t inherently “buy” or “sell” – what matters is who initiated the trades. As one trading expert explains, talking about “buying volume” vs “selling volume” can be misleading: for every buyer there is a seller, so volume cannot be literally split into purchases and sales. Instead, what traders really mean by “bullish volume” is that buyers were more aggressive (lifting offers) and drove the price up, whereas “bearish volume” means sellers were more aggressive (hitting bids) and drove the price down. The colored volume bar is essentially a proxy for which side won the battle during that bar.
█ Why This Can Mislead You
Price might close higher, not because there were more buyers than sellers (there never are — every trade has both), but because buyers were more urgent. And sometimes price moves due to other forces, like:
Short covering.
Stop-loss runs.
Liquidity vacuums.
This means a green bar might not reflect strong demand, just urgency from the other side closing their positions.
⚪ Example:
Take the well-known GameStop short squeeze as an example. If you looked only at the volume bars during that rally, you’d see a wall of strong green candles and high volume, which might suggest aggressive bullish buying.
However, that interpretation would be misleading.
Under the surface, the surge wasn't driven by fresh bullish conviction — it was massive short covering. Traders who were short were forced to buy back shares to cover their positions, which drove prices even higher. The volume was categorized as bullish, but the true intent behind the move had nothing to do with new buying pressure.
This demonstrates why relying solely on volume color or candle direction can lead to false conclusions about market sentiment.
Does this simple up/down volume labeling truly reflect buying vs. selling pressure? To a degree, yes – it captures the net price outcome, which often corresponds to who was more aggressive. For example, if many buyers are willing to pay higher prices (demand), a bar will likely close up and be colored green, reflecting that buying interest. Conversely, if eager sellers are dumping shares and undercutting each other, price will drop, yielding a red bar that flags selling pressure. Traders often use rising volume on up-moves as confirmation of a bullish trend’s strength, and high volume on down-moves as a warning of distribution, which indeed aligns with traditional analysis
That said, the method has important limitations and nuances, documented both anecdotally and in research:
⚪ Volume is not one-dimensional: Since every trade has both a buyer and seller, one cannot literally count “buy volume” vs “sell volume” without more information. The green/red coloring is a blunt classification based on price direction, not an actual count of buys or sells. It assumes the price change direction is an adequate proxy for the imbalance of buying vs. selling. This is often true in a broad sense, but it’s not a precise measure of order flow.
⚪ Intrabar Dynamics Are Lost: A single bar’s color only tells the end result of that interval, not the story of what happened during the bar. For instance, a 4-hour candle might be red (down) overall, but it could have contained three hours of rally (buying) followed by a steep selloff in the final hour that erased the gains. The volume bar will be colored red due to the net price drop, even though significant buying occurred earlier in the bar. In other words, a large red bar can mask that there were pockets of bullish activity within – the selling just happened to win out by the close of that period. Without looking at smaller time frames or detailed data, one can’t tell from a single color how the buying/selling tug-of-war progressed within the bar.
⚪ Gap Effects and Criteria Choices: The choice of using open vs. close or previous close can alter the interpretation of volume. As discussed, a day with a big gap can be labeled differently under the two methods. Neither is “right” or “wrong” – they just highlight different perspectives (intraday momentum vs. day-over-day change). Traders should be aware that colored volume bars are an approximation. A green volume bar under one method might turn red under the other method for the same bar. This doesn’t mean volume changed – it means the classification scheme changed. For example, a stock that closes below its open but still higher than yesterday will show a red volume bar by the intraday method but would be considered an “up-volume day” in OBV terms (previous close method).
⚪ No Indication of Magnitude or Commitment: A single color also doesn’t convey how much buying or selling pressure there was, only which side won. Two green volume bars might both be green, but one could represent a modest uptick with tepid buying, whereas another could represent an aggressive buying spree – the color alone doesn’t distinguish this (other than one bar likely being taller if volume was higher). Traders often need to consider volume relative to average (e.g. using volume moving averages or looking for volume spikes) to judge the significance of a move, not just the color.
█ Summary
The coloring of volume bars is a visual shortcut, not an exact science. It’s a guess based on price direction — useful, but imperfect. Understanding this helps traders avoid reading too much into what a green or red volume bar actually means.
-----------------
Disclaimer
The content provided in my scripts, indicators, ideas, algorithms, and systems is for educational and informational purposes only. It does not constitute financial advice, investment recommendations, or a solicitation to buy or sell any financial instruments. I will not accept liability for any loss or damage, including without limitation any loss of profit, which may arise directly or indirectly from the use of or reliance on such information.
All investments involve risk, and the past performance of a security, industry, sector, market, financial product, trading strategy, backtest, or individual's trading does not guarantee future results or returns. Investors are fully responsible for any investment decisions they make. Such decisions should be based solely on an evaluation of their financial circumstances, investment objectives, risk tolerance, and liquidity needs.

#XLM #XLMUSDT #Stellar #Analysis #Eddy#XLM #XLMUSDT #Stellar #Analysis #Eddy
Everything is clear on the chart, I didn't have enough time to explain further. From the supply area, with or without the area hunt, it can fall to the demand area. Then you can invest in your style by getting the necessary confirmations when the high-time divergence is completed, which is probably the third collision on the lines marked in the demand area.
This analysis is only to show important areas.
It is never too late to buy and invest. Do not rush and do not be fooled by the positive movements and reactions of the market. Wait for the price to reach its valuable areas. In the analysis of the Atom currency, as you can see, there is a strong demand area that is intact. Be patient until the price falls from the decision or extreme flips to the green area of the important demand area. Be sure to check this currency in your monthly time frame and draw the areas. Then refer to the weekly, daily and four-hour time frames and draw the lower time areas and look for confirmation for volatility.
Do not rush to invest and buy spot and let the price reach the support area.
Important areas are drawn and labeled so you can make informed decisions.
Good luck.

GJ long position setupI think this area has a good potential to go long.
Let see what will happen...
Good luck.

DXY analysisAs you can see we have divergence in delta volume and also a swing high that was touched 3-4 times and buying volume that is increasing and selling volume that which is decreasing.
I think we're going to have a CHoCH in DXY in 4h TF and it will make dollar stronger.
Let see does it close above the swing high...

GJ Long position analysisWe have CHoCH in 15min TF and then a pullback and sweep of liquidity and I'll wait for the price to break our high and then wait for a pull back to find an entry.
I'll update this idea next week.

EU short position setupWe have CHoCH in 4H TF followed by series of BOS in 1H TF. I think there are two scenarios: 1- we would have a pull back to 1H TF OB and then go down. 2- we would touch the 4H TF OB by a wick and then go down.
In any case, for an extra confirmation, it's better to wait for a CHoCH in lower TF after we've reached to any of these two areas.
Let see what will happen.
Good luck.

Gold short position setupAfter the market made all time high now we have a CHoCH in 4H TF and a BOS in 1H TF, and now we're in the pull back.
I think this area has the most potential to look for a short entry setup.
As always, we can set a limit order or wait for a CHoCH in 5min TF and then go short.
Let see what will happen...
Good luck.

Eurjpy short position setupHi everyone.
As we have a BOS to the down in 1H TF, now it's time for a pull back.
I think around 161 is a good area to look for CHoCH in lower TF(like 5min) to go short. Or you can set a limit order by your own risk.
Please consider the risk management.
Lets see what will happen...
Good luck.

Eurchf sell position analysisWe have a CHoCH and now we're in a kind of flag pattern. we can set an order or wait for the price to break out of flag that which can cause a CHoCH in lower TF.
Lets see what will happen...
Good luck.

Eurcad short position analysisWe have a CHoCH in 1H TF. There are two scenarios: 1- I think there is a chance that price come up to take the liquidity above that consolidation and then go down. 2- If any 5min candle closes below 1.4899 it's a confirmation to go short to TP1.
Lets see what will happen...
Good luck.

Audusd short position analysisOverall we are in a bullish trend, But we have a CHoCH to the down in 1H TF that means we are in a pull back. we've touched the area of value once but its possible and I hope the price come back to that area once again so that we can enter the trade :|
As always, we can set an limit order or wait for the price to come to this area and then wait for a CHoCH in lower TF to find a good entry.
Lets see what will happen...
Good luck.

Xauusd long position analysisWe had a strong push to the up and a pull back and now we have a CHoCH in 1H TF.
It is possible that the price come to Area of value. If it happens then we can wait for CHoCH in lower TF like 15min, or set a limit order.
Lets see what will happen...
Good luck.

Gbpjpy long position setupWe have a BOS to the upside and we are in a pull back right now, I think this specific order block is good to go long. as you can see there are two entry setup, one with lower RR and the other one with higher RR. I'll set an order for the higher RR setup and if it is not triggered then I'll wait for a CHoCH in lower TF to find another netry.
Lets see what will happen...
Good luck

Eurusd long position analysisI think risk reward of this trade is not high enough to put a buy limit order.
So I'll look for a bullish CHoCH in 5min TF in this area and then I'll enter the position.
Let see what will happen...

Gbpusd sell position setupWe are in a bullish trend and we have a BOS in 4H TF. So we have to wait for a pull back and this area has its potential to go long.
I'll wait for CHoCH in lower TF for more confirmation and then I'll enter the position.
Lets see what will happen...
Good luck.

CadJpy long position analysisAs we're in a bullish trend so I'm waiting for price to come to this level and then go long.
Here is two setup, one with wider SL and another with smaller SL.
For a better trade I'll wait for more confirmation with a CHoCH in lower TF like 5min.
Lets see what will happen...
Good luck.

GbpJpy long position analysis We're in a pull back of a bullish trend and I think this area has its potential to go up.
You can set a buy limit order or for more confirmation wait for a CHoCH in lower time frames.
Let's see what will happen...
Good luck

AUDJPY long position analysisAs we are in pull back of 4H bullish trend so I think this area is good to go long. but I'll wait for CHoCH in lower TF.
Let see what will happen...

EurUsd Short Position AnalysisWe have a CHoCH in 15min TF to the downside. I'll wait for the price to come to this area and then look for a bearish CHoCH in 1min TF and then I'll go short.
Lets see what will happen.
Good luck...

AudUsd short position analysisAs we have a CHoCH in 15min TF, so I'll wait for a pullback to this area. we can set a sell limit order or wait for a CHoCH in lower TF after the price reached to this area(safe with extra confirmation).
Lets see what will happen...
Good luck.

Long Analysis of Bitcoin in 4H timeframe.I think there are lots of liquidity in this area that will pull the price down.
That's my opinion about the btcusd long position.
Let's see what will happen ;)
