BNBUSDT. Trading opportunityOn the daily timeframe, the price has formed a sideways movement and reached the mandatory target of the seller's vector 7-8. The next relevant buyer's vector 8-9 has a potential target of $634. The price is currently in the middle of the sideways range on the daily timeframe.
On the hourly timeframe, the price has also formed a sideways movement. The short seller's vector 11-12 broke below the lower boundary of the sideways range at $574 and collected sellers' liquidity. Pay attention to the key volume of the last vector 11-12: the candle with the highest volume in the vector is at the bottom (marked as 'KC' on the chart). Then the buyer absorbed this volume and returned the price to the sideways range, forming a new buyer zone at the boundary of the sideways range (the blue rectangle on the chart, upper boundary at $575.5). The key volume (largest) in the emerging buyer's vector is also at the bottom (the candle on the chart is marked as 'tKC'). This setup increases the probability of realizing the buyer's vector 12-13 with a potential target on the hourly timeframe of $600.
Idea: Look for purchases as the realization of the buyer's vector 12-13 on the hourly timeframe and the buyer's vector 8-9 on the daily timeframe. The target on the hourly timeframe is $600.
The preferred option is to look for purchases from the defense by the buyer of the buyer zone at the lower boundary of the sideways range.
VSA

TONUSDT. Trading opportunityOn the daily timeframe, the price formed a sideways movement and hit the mandatory target of the buyer's vector 4-5 (7.2755 was reached). Currently, the price is in a seller's context. The next relevant seller's vector 5-6 has a potential target of 5.18. Yesterday, the seller showed a weak reaction on the daily timeframe (spread, volume, and the tail of the bearish candle), and the tail of this candle tested the volume key candle (on the "rKC" chart) of the buyer's vector 4-5, from which a strong buyer reaction started on the hourly timeframe: 3 buyer candles with good spread from the level of 6.5615.
On the hourly timeframe, the price also formed a sideways movement. The bearish seller's vector 9-10 reached the mandatory target. The next relevant buyer's vector 10-11 has a potential target of 7.2232. A liquidity pool of sellers formed below points 4 and 10 of the sideways movement, at 6.5615.
A weak seller on the daily timeframe may overcome a strong buyer on the hourly timeframe. Sales may be considered:
Option 1: Implementation idea of the seller's vector 5-6 on the daily timeframe: if the price breaks the lower boundary of the sideways movement on the hourly timeframe (6.5615) and defends this breakout. An ambitious potential target is 5.18.
Option 2: Implementation idea of the seller's vector 11-12 on the hourly timeframe. After the implementation of the buyer's vector 10-11 and the defense by the seller of the level 7.2232. The potential target is the opposite boundary of the sideways movement.
Buy entries can also be sought from the implementation idea of the buyer's vector 10-11 on the hourly timeframe.
Option 1: The most interesting option. If the buyer gathers liquidity from the seller below 6.5615, returns the price to the sideways movement on the hourly timeframe, and defends the level 6.5615. Possible targets are 7.2232, 7.45, and 7.675.
Option 2: Upon the defense by the buyer of the level 6.8125, a buying opportunity can be sought. Possible targets are 7.2232, 7.45, and 7.675.

ADANI PORTS - Ready to Move to next upper Trajectory?The stock on its upper trajectory faced a price rejection around 1425 levels and it was driven down to below the 50 DMA levels. From there it took support and then started recovering. Recently there was an attempt to take out the price rejection zone but that move did not succeed and it was pushed back to test the price rejection zone. Now it is again attempting to take out the rejection zone. We can see increasing momentum and also the relative strength is positive. The money flow needs to become positive. We can see some increase in the volume as well. Now this stock is likely to succeed in taking out the rejection zone. A good close above 1457 would take it to the next upper trajectory.

UNION BANK - Gearing up for a Break out?The PSU bank index has been moving in a slightly inclined upward channel showing positive bias. However, this stock has been moving in a sideways range for almost four months now. Now the stock is testing the top of the sideway range. The MFI indicates money is flowing into the stock. The momentum is also positive and increasing, the relative strength is also turning positive. We can see increases in the volume as well. Also, we can see increases in the delivery volumes indicating some interested buying coming in here. The minor trend and the immediate trend are also up. Looks like the stock is gearing up to break out of the range and move into the next higher orbit. So the level to watch out is 162. This stock should find a place on your watch list.

KNR CONSTRUCTION - A watch list StockThe stock after facing rejection at 317 levels was pushed down below the 200 DMA level. From the bottom in June 22, the stock has been moving almost sideways for almost two years now. Finally, the stock seems to be making an attempt to move up. It is about to take out the minor price rejection zone. You can see an increased volume and also you can see that the money flow has been increasing. Now the relative strength is also turning positive. So once now the stock is likely to test the major rejection zone at 317 to 343 levels. Once that is taken out, that is if we have a bullish candle above the 343 levels, we can expect this stock to go into the next phase of uptrend. A stock to watch.

JUBLI FOODS – Confirming Reversal and ready to move higher?The stock after making a high of 586 last December has been going down. It has been making lower highs and lower lows with each price wave was getting lower. After reaching a bottom of 421 it started reversing. Then it started making higher highs and higher lows and each price wave was getting higher and higher. Now it has crossed above the 3 short-term moving averages and today it moved above the 200 DMA as well. You can see that the volumes for each wave was getting higher. The money flow had remained positive from April onward and in May the relative strength also turned positive. The stock also exhibited strong momentum in May. Recently the delivery volumes have also increased indicating interested buyer stepping in. Now the stock is likely to teat the previous high of 586. 520 levels could offer some resistances.

EXIDE INDUSTRIESThe stock after a good up move has been re-accumulating for almost a month and half. Now the stock is on the verge of breaking out from this re-accumulation zone. The relative strength is turning positive and the money flow is also on the verge of reversing. Momentum which was weak has started picking up. The volume in the last two sessions has been high. The delivery volumes is also increasing. A good close above today's high, that is a good close above 500 will take the stock to the next orbit and it will move much higher.
We had caught the earlier breakout from the Rejection zone at 280 as well.

USDRUB.P Long Aggressive DayTradeMonthly context
"+ long impulse
+ SOS level
+ support
- above 1/2 correction
+ volumed 2Sp
+ weak test"
Daily context:
"- short impulse
+ volumed T1
+ support level
+ volumed manipulation"
Hourly context
"- short impulse
+ biggest volume T1 level
+ support level
+ volumed 2Sp"
5M set up
- short impulse
+ volumed T1 level
+ support level
+ biggest volume Sp
+ weak test
+ first bullish bar closed entry
Calculated affordable virtual stop loss
1 to 2 take profit

ETHUSDT. Trading opportunityOn the daily timeframe, the price has been in a range since February 24. The buyer's vector 8-9 reached its obligatory target. The price is now in the seller's contextual zone. On May 23, the seller attempted to start their vector 9-10 with a potential target of 3301, but the buyer absorbed this attempt. The buyer's candle on May 23 has the highest volume in the entire vector 8-9, but the result is only in the wick. The price was unable to close the day above the previous wicks.
Purchases can be sought based on the idea of reaching 4093. Sales can be considered based on the idea of the buyer's weakness (May 23 candle).
Let's examine the lower timeframes to understand where purchases or sales can be found. The situation is clearly visible on the 2-hour timeframe. The price is in a range. The seller's vector 5-6 reached its obligatory target and the buyer's vector 6-7 started to develop with a potential target of 3901. The last two seller candles in vector 5-6 have increasing volume, while the two buyer candles in the beginning vector 6-7 have decreasing volume, suggesting that the buyer is not present yet and someone might be buying from the 50% tail of the candle using the IST (Smart Money) concept.
For purchases, it would be beneficial if the seller on outstanding volume pushed the price below 3626, and the buyer absorbed this attempt and brought the price back above 3626. Of course, this might not happen, and the price could reach 3901.
Sales can be sought from the seller's defense of 3901 or 3949. Below 3498 (the lower boundary of the range), sales can also be considered, but it is important to remember that 3301 may halt the seller, as this is where the buyer's zone on the daily timeframe begins (blue rectangle on the chart).

BTCUSDT. Trading opportunityOn the daily timeframe, the price is consolidating. The current buyer's vector 10-11 has not yet reached its targets. The price movement has stalled in the range of 70,400-72,000. The price is currently within the daily candle of May 20, 2024, which has the highest volume in the buyer's vector 10-11 (marked "tKC" on the chart). You can look for buying opportunities from this daily candle with the goal of reaching the vector 10-11 targets (72,800, 73,777). To find trading opportunities, let's examine the lower timeframes.
On the hourly timeframe, there is a buyer's trend. The last buyer's impulse started from 68,905. The price corrected to this level, but we haven't seen active buying. The candle with the highest volume in the correction is at the beginning of the correction (marked "tKC" on the chart). For comparison, let's look at the situation from May 17-19.
Similarly, on the hourly timeframe, there was a buyer's trend. The price corrected to the 50% level, we did not see active buying, but the candle that interacted with the 50% level had the highest volume in the correction (marked "tKC" on the chart). The buyer absorbed this candle, leading to a new buyer's impulse on the hourly timeframe.
Currently, on the hourly timeframe, we do not observe anything similar. Moreover, the buyer failed to overcome the 50% level of the last impulse (70,442).
Let's additionally look at the 200-minute timeframe. We see a consolidation; the price exited the upper boundary of the range (67,700). A correction occurred to the 50% level of the last impulse (68,919). The volume of the candle interacting with the 50% level is less than that of previous candles, indicating a lack of active buying (spread, volume). On this timeframe, buying opportunities can be sought either from the key candle ("KC" on the chart), although we have not yet seen a good resumption, or from the buyer defending the boundary of the range at 67,700.
Additionally, on the 30-minute timeframe, there are still no good patterns for buying.
It is advisable to look for buying opportunities:
After the seller's attack on the 68,900 level (observe the volume and result of the attack) and the buyer defending this level.
After the seller's attack on the 67,700 level (observe the volume and result of the attack) and the buyer defending this level.
Currently, there is no context for looking for selling opportunities.

GENERAL INSURANCE CORPORATIONThe stock after facing price rejection around 440 to 467 levels came back to below 50 DMA levels. It has been consolidating since then for almost 3 months now. Finally, today we saw it breaking out of the consolidation zone. We saw a widespread bar on very high volume. The relative strength is also turning positive. The money flow has been positive for the last few sessions. We can also see a reversal in the momentum to the positive side. If the stock sustains above the high of today's bar, we can see the stock testing the previous price rejection zone at 440 to 467 levels. Now the only point of caution here is today's very high-volume bar, it is like a BC bar which can cast a shadow of supply bringing the stock down back into the consolidation zone. So that is why we need to have positive close above the shadow of the BC bar for the stock to move higher. So, it is a stock worth watching.

ADITYA BIRLA FASHIONS - Poised to moved up ?The stock saw a huge fall of about 50% from a high of 359. From the bottom, it has been struggling for almost a year to reverse the trend. And of late, you can see the attempt to move up, seeing some success. You can see a break of structure in the daily and now a break of structure in the weekly as well. The relative strength is also positive. The money flow which had dipped is now recovering. The momentum also had weakened recently and is now picking up. Today the stock moved past the price rejection zone at 277 with wide spread up bar with volume support. In the last few sessions, we saw some increase in delivery volumes indicating some interested buying coming in. If the stock sustains above 277 levels, we can see the stock moving up further north. The next destination could be 315 levels.

APD Long Investment Conservative Trend Trade Conservative Trend Trade 5F
+ long impulse
+ SOS bar
Calculated affordable stop loss
1 to 2 R/R below 1/2 monthly zone
Monthly chart context
+ long impulse
+ biggest volume T2 level
+ biggest volume manipulation
Start building position, will add more after there's a set up on inferior timeframe.

STLA 1H Long Aggressive CounterTrend TradeAggressive CounterTrend Trade
- short impulse
+ volumed T1 level
+ volumed Sp
+ weak test
+ first bullish bar closed entry
Calculated affordable real stop loss
1 to 2 TP before volume zone
Context on Daily:
"- short impulse
+ monthly support level
+ 1/2 correction monthly
+ biggest volume T1
+ biggest volume Sp"
Context on Monthly
"+ long impulse
+ SOS level
+ 1/2 correction?
+ support level"

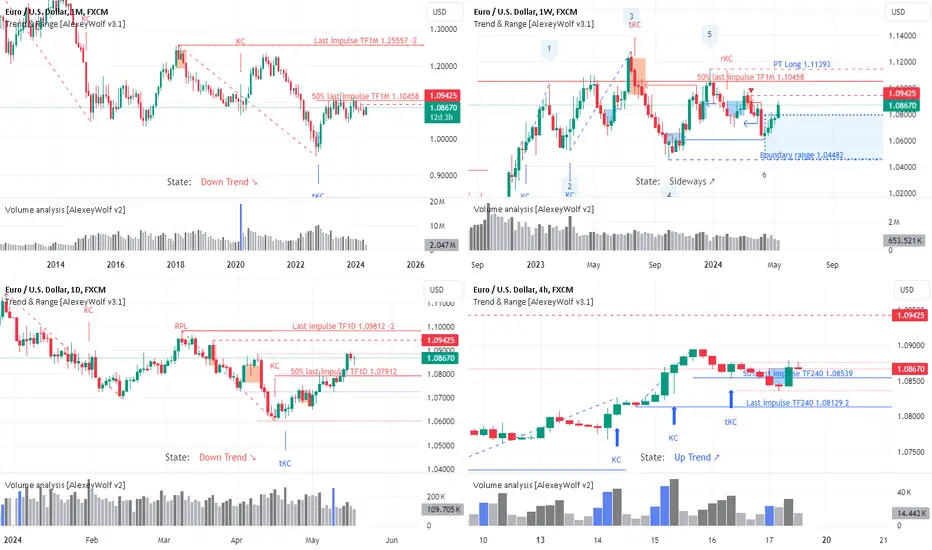
EURUSD. Trading opportunityToday I will analyze the asset on several time frames (1M, 1W, 1D, 4H) to find out where it is advisable to buy and where it is advisable to sell.
On the monthly timeframe , there is a bearish trend. The last bearish impulse started from the price of 1.25557. The price has touched the 50% level (1.10458) of the last bearish impulse several times. So far, I don't see a good resumption of the seller.
On the weekly timeframe , the price has formed a sideways range around the 1.10458 level (50% of the monthly bearish impulse). The bearish vector 5-6 has met the mandatory target (see the related idea for more details). Currently, the relevant buyer's vector is 6-7 with a potential target of 1.11393.
On the daily timeframe , there is a bearish trend. The last bearish impulse started from the price of 1.09812. The price has consolidated above the 50% level of the last bearish impulse (1.07912). So far, we haven't seen a resumption of the seller.
On the 4-hour timeframe , there is a bullish trend. The last buyer's impulse started from the price of 1.08129. The price dropped into the discount zone (below the 50% level of the last impulse - 1.08539). The buyer showed a good resumption (result, spread, volume) from the key candle of the impulse (marked "KC" on the chart).
Thus, on the monthly and daily timeframes, there is a bearish trend, with the price on both timeframes corrected to the 50% level, and no strong seller is observed at these levels. On the weekly timeframe, there is a sideways range with the relevant buyer's vector, and on the 4-hour timeframe, there is a buyer's trend. Based on this, in my opinion, it is now more appropriate to look for buying opportunities .
To understand where to look for buying opportunities, let's consider the lower timeframes: 90M, 15M, 3M.
On the 90-minute timeframe , the price has formed a sideways range. The mandatory target of the seller's vector 6-7 has been reached. The relevant buyer's vector is 7-8 with a potential target of 1.08785. The lower boundary of the sideways range is 1.08356. The upper boundary of the sideways range is 1.08828.
On the 15-minute timeframe , there is a bullish trend. The last buyer's impulse started from the price of 1.0846. The price has not yet interacted with the 50% level of the impulse (1.08623). At the base of the impulse, a buyer's zone has formed (blue rectangle on the chart) with the upper boundary at 1.08564.
On the 3-minute timeframe , the price has formed a sideways range. The seller's vector 9-10 has reached the mandatory target and touched the lower boundary of the sideways range at 1.08651 (point 6 of the sideways range). Below 1.08651, I assume there is seller's liquidity that the buyer might collect. Meanwhile, the 50% level of the buyer's impulse on the 15-minute timeframe is slightly lower - 1.08623.
It is appropriate to look for buying opportunities :
On the 4-hour timeframe from the buyer's defense of 1.08129.
On the 90-minute timeframe from the buyer's defense of 1.08356.
On the 15-minute timeframe from the buyer's defense of 1.08623 or from the resumption of the buyer from the zone (1.0846 - 1.08564).
On the 3-minute timeframe from the buyer's defense of 1.08651.
All long positions should be monitored closely or set with minimal targets due to the bearish trend on the daily timeframe.
It is appropriate to look for selling opportunities :
On the daily timeframe from the levels of 1.09425 or 1.09812.
On the weekly timeframe from the level of 1.11393.
DEEPAK NITRITEIn early January, the stock faced rejection around 2520 levels and it retreated to sub 200 DMA levels. From there, it recovered. In early May, it made an attempt to take out the price rejection zone. There was a move on very high volume. Unfortunately, that move did not succeed and it was pushed back below into the supply shadow of the BC bar which happened on the April 24th. Now, again it is attempting to move above the shadow of the BC bar and the price rejection zone. The relative strength is still positive but the money flow is lacking and also the volume is very low. The momentum has also dropped. So, once this stock succeeds in taking out the price rejection zone and goes above the shadow of the BC bar, the stock is likely to move up higher. We also see a very nice consolidation pattern almost like a cup and handle pattern. So, we need to wait and watch for the volume to increase and the money flow to be positive and the momentum also to come in. So, this is a stock worth watching

EDELWEISSThe stock is trying to move out of the price rejection zone after nearly four months of sideways move. The relative strength and the money flow are also positive. The volume has been increasing in the recent past and the volume adjusted momentum is also turning positive. All the conditions are favoring the stock to take out the price rejection zone. Once we have a good close above 88, we can see the stock moving up much higher.

ICP Long Swing SetupThe chart suggests a bullish outlook based on the volume and price action. The significant volume spikes during rallies indicate strong buying interest.
The current low volume during the pullback phase supports the possibility of accumulation.
If the price breaks above the recent highs with increasing volume, it could signal the continuation of the uptrend.

BRIGADEThe stock has finally moving past the Price Rejection Zone with good volume support. The relative strength is positive and increasing. Money Flow is also turning positive. The Stock looks poised to move much higher.

Crompton Greaves - Poised move up?After a long sideways move the stock is now attempting go on upward trajectory. Creasing relative strength and Money flow is supporting the up move. Momentum and Buying Pressure are also increasing. Recent increase in delivery volumes indicate good amount of accumulation. Today's ultra high volume is reason for caution. Once we have a positive close above 343 we can expect a 100 point up move.

BABA. The buyer shows strengthHello traders and investors!
Let's take a look at what happened since the last post where I suggested considering purchases. You can find the post linked below. Just a reminder, the solid line represents the main scenario, while the dashed line indicates possible price movements to realize the main scenario.
The price has increased by 13%, with the maximum drawdown so far being 5%.
The situation is most clearly visible on the 2-day timeframe. I explained how and why to use different timeframes in a separate article, the link to which is provided below. On the 2-day timeframe, the price has formed a sideways movement where volume accumulation is taking place. Currently, we see 7 points within the sideways movement. The buyer's momentum from point 7 broke through the upper boundary of the sideways movement at 78.34.
If the buyer defends the breakout above the upper boundary of the sideways movement, I expect the first target to be 96.68. This is approximately 18% from the current price. This is the primary scenario.
If the seller absorbs the last buyer's candle and brings the price back into the sideways movement, there is a possibility of retesting the local minimum.
The ultimate target on the weekly timeframe remains the same - 121.3.

SURYA ROSHNI – Looks good for a quick short term swing The stock was pushed to sub 200 DMA level after facing Rejection around 840 levels. Now the stock is recovering making Higher lows and Higher Highs. Absolute and Relative Strengths are positive. Money is also flowing into the stock. Delivery volumes have increased. The stock likely to test the 840 levels. A quick short term 20% move possible

GODREJ INDUSTRIES The stock has now successfully taken out the Rejection Zone with consecutive Bullish Effort to Move up Bars. Quality Buying seen with increased Delivery volumes. RS and Money Flow has be strong for some time. The stock likely to move higher now . A test of the Rejection Zone is also possible before the up move.
