#Bitcoin - thoughts out loud #17Good evening, we are from Ukraine!
Dear colleagues, I am glad to welcome you!
After the weekend, a clearer situation has been formed for our own understanding, which indicates that locally the price of the first cryptocurrency should stay above 28680, in other words, a false breakout of the lows and an additional test of floating propriety to squeeze weak hands out of the market. The target is 28680-28700, the support range from which we can see the resumption of the upward movement.
In the absence of professional buyer activity, the asset is expected to depreciate to certain price levels.
Sometimes you win/sometimes you learn.
#Bitcoin
VSA

#Bitcoin - thoughts out loud #16Good evening , we are from Ukraine!
I've been watching the chart since Friday and I can identify several key facts in favor of the long scenario:
1) there is no floating supply on the market at the moment.
2) there is no resistance above the local highs.
3) the news background is negative.
4) and most importantly, "someone unknown" is actively buying up almost the entire supply.
But there is a downside, there is a lack of results and progress on the chart, the situation should improve in the near future, or the asset will depreciate, the third is not given.
Taking these facts into account, I can only say one thing, everyone get ready, because on the 7th-8th of this month, something very incredible awaits us all.
I wish you success and all the best!
I wish everyone who reads this success and prosperity.
Sometimes you win /sometimes you learn .
#Bitcoin

#Bitcoin - thoughts out loud #15Good evening, we are from Ukraine!
At the moment, all the conditions of the setup are met.
Anyone who follows the development of events will be sincerely grateful for a like.
Just for the work done.
I wish everyone who reads this success and prosperity.
Anyone who follows the development of events will be sincerely grateful for a like.
Just for the work done.
I wish everyone who reads th is success and prosperity.
Sometimes you win/sometimes you learn.
#Bitcoin

#Bitcoin - thoughts out loud #14Good evening, we are from Ukraine!
Dear colleagues, I am glad to welcome you!
It's an interesting pattern that works well, but you need to be careful.
Sometimes you win /sometimes you learn .
#Bitcoin

#Bitcoin - thoughts out loud #13Good evening, we are from Ukraine!
Dear colleagues, I am glad to welcome you!
I like the situation with this instrument because it is schematically similar to the distribution phase, but there is one thing: the distribution is false and a significant markup of up to 35,000 is likely to be expected in the near future. I may be wrong, but this is my subjective vision, my thoughts out loud.
It's also worth keeping a short-case scenario in mind.
Good luck to everyone, all the best.
Thank you all for your attention, I wish you success.
Sometimes you win/sometimes you learn.
#Bitcoin

#ETH - thoughts out loud №5Good evening from Ukraine!
Dear colleagues, I am glad to welcome you!
The current development of the situation indicates that in the absence of positive dynamics of movement from the current price, it may lead to a decrease in the price of the instrument (supply test).
However, it is worth considering that professional operators who create the market have their own plans that differ from the way the masses see the situation.
It will be great to take part in a rapid "unexpected" upward momentum in order not to let extra passengers into the market)
Thank you all for your attention, I wish you success .
Sometimes you win /sometimes you learn.
- thoughts out loud
- thoughts out loud
- thoughts out loud
P.S.
...Think positive)

HINDALCO - A stock to watchThe stock has been making Higher Highs and Higher low from the recent low. Now attempting to take out the previous rejection Zone. Good support in terms of Relative strength, Money Flow and buying Pressure. Also showing positive Strength. Above the short and long term moving averages in both daily and weekly. The Metal index is also supporting in terms of bullishness. A close close above 454 will take it higher and will test 500+ levels.

MAHSEAMLES - Moving into the next OrbitThe stock has been has been rising from the low from the beginning of the year. It has been consolidating for almost two months. Also we saw "SPRING" pattern during the re-accumulation.
Relative Strength, Money Flow and Buying pressure all positive. Today the stock is trying to move out of the re-accumulation zone. A positive close with volume support above 502 will take the stock to higher levels.

ASAHI INDIA - Moving out of the accumulation zone and gearing upThe stock was going through almost six months of accumulation. Then it broke above the accumulation zone and moving into the markup Phase. The Relative strength is also positive. Moneyflow and Absolute strength is also positive. The stock is likely to move move up and test the 690 levels. It may face some supply around 620 levels.

#Bitcoin - thoughts out loud #12Good evening, we are from Ukraine!
It is quite possible that the situation may develop in order to confuse traders, because flat movements in the market are quite a profitable business, but they have their own price that will have to be paid for their early decision. The reward will be an impulse movement after the accumulation/distribution is completed. I observe a sufficient number of locked-in traders who hope that the price will go in the direction of the desired take profit, but not everything is so simple and unambiguous.
Thank you all for your attention, I wish you success.
Sometimes you win /sometimes you learn .
#Bitcoin

#ETH - thoughts out loud №3Good evening from Ukraine!
Dear colleagues, I am glad to welcome you!
I expect the price to rise to 2000, and then we'll see.
Thank you all for your attention, I wish you success.
Sometimes you win/sometimes you learn.
- thoughts out loud
- thoughts out loud
- thoughts out loud

#ETH - thoughts out loud №4Good evening from Ukraine!
Dear colleagues, I am glad to welcome you!
Today, we have important news, the situation on the chart reflects the idea of professional operators to implement their plans immediately during the news release, cascading levels with a large number of stop losses have been formed. We can see that if we are long, then at more favorable prices, and if we are short, then we have room to fall, and perhaps someone will not be pleased, but this is the truth as it is.
Thank you all for your attention, I wish you success .
Sometimes you win /sometimes you learn .
- thoughts out loud
- thoughts out loud
- thoughts out loud

#Bitcoin - thoughts out loud #11Good evening, we are from Ukraine!
The current situation has several options. Market participants should expect both a long scenario and a price decline (in my opinion, this is more realistic) to test the supply with a subsequent markup of the asset. That is, the price has been in the range of 29500-31500 for 16 days, and next week will confirm whether it is accumulation or distribution. In any case, professional operators will arrange an artificial price reduction for the hike upwards (3 percentage points are marked on the chart). The instrument should show strength in price:
1)28700 - 28800.
2)26700 - 26800.
3)20700 - 20800.
If there is no activity of professional operators at these prices, it is possible that the price will fall even lower.
Thank you all for your attention, I wish you success.
Sometimes you win /sometimes you learn .
#Bitcoin

#Bitcoin - thoughts out loud #09Good evening, we are from Ukraine!
For further upward movement, you need to test the buyer plus withdraw liquidity.
Current action plan.
Do you agree with this development?
Thank you all for your attention, I wish you success.
Sometimes you win /sometimes you learn .
#Bitcoin

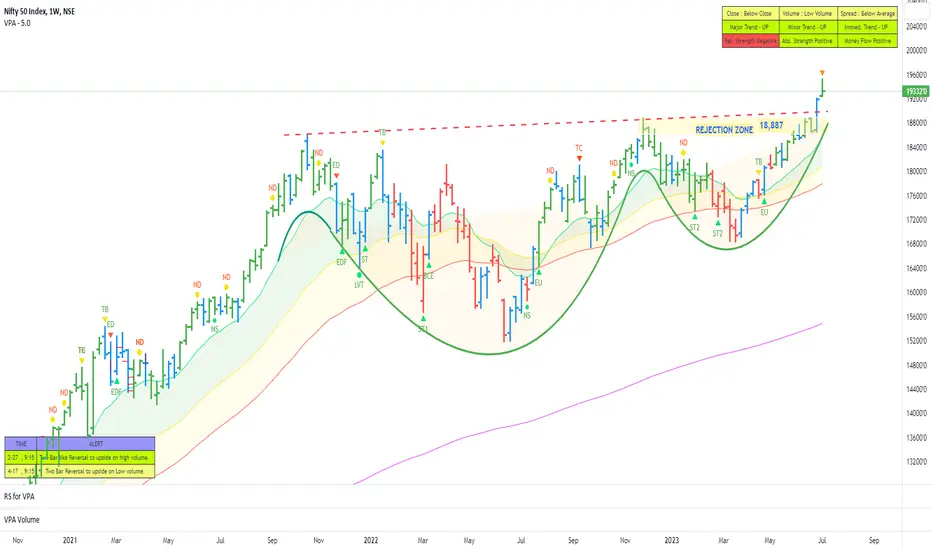
Weekend Review of the NIFTYNowadays we have been hearing that the next decade belongs to India. Many, including Morgan Stanly expect Indian Markets to do very well in the next five years with a strong Bull market. Maybe the only apprehension is that this is a Election Year which can hold back the Market.
Technically, the weekly charts is showing that the NIFTY is clearly gearing up for a big move with a nice VCP pattern. So, there is a high probability that we will see start of a new big up move soon. It is possible that we may see one more smaller contraction before the big up move.
On the Daily Chart, though we saw some weakness today, the overall bullishness still remains. We saw selling dominating after many days. The index is still holding above the moving averages. Of course, the index has been under performing the wider market which was being pushed by the mid and small caps. We may see the index retreat some more next week. But the strength remains as of now.
RAYMOND LTD - Gearing up to scale New HeightsThe stock has been a multi bagger giving almost 5x returns in the last two years. Recently the up move had been halted with a “BC” Bar. Then the stock after retreating started to move up attempting to take out the “BC” bar. It failed and is now attempting again. We see a clear a Volatility Contraction Pattern. The stock is still in a supply area. Once we have a good close above 1786 the stock is likely to scale new highs.

CONCOR - A STOCK TO WATCHThe stock has been moving up making Higher Highs and Higher Lows after a Down move. Then it faced rejection around 680 levels. Then was pushed down below all the EMAs. Then it recovered from below and attempted to take out the Rejection Zone. It has just inched past the supply area. But the Relative strength and Money flow are still negative and improving. Once these also provide support the stock will move up. The significant levels on the upper side are 750, 790 and then 820. So we can keep a watch on the stock and wait for further confirmation to catch any impending up move.

BHEL - Looking good to retake some old highsThe stock is seeing almost five year High. On the weekly we can see a a nice VCP pattern.
On the Daily chart it is coming out of the supply shadow of effectively two "BC' Bars. Today we saw a High Volume "Effort to Move up" bar. The Relative Strength is also Positive.
After a long time the stock seems to be gathering the strength move up and scale up retake some of the old highs

#ETH - thoughts out loud №2Good evening from Ukraine!
Dear colleagues, I am glad to welcome you!
In a nutshell, there is no buyer's strength in this trajectory, and I expect a short-term development of the situation.
Thank you all for your attention, I wish you success.
Sometimes you win /sometimes you learn .
- thoughts out loud
- thoughts out loud
- thoughts out loud
BINANCE:ETHUSDT

CHARGEPOINT - MASSIVE Buying OpportunityHey guys Chargepoint flashed a massive buying opportunity, demand was tested and held with insane volume. This is a perfect buy. Currently holding a 4 times leveraged Option with a Knock Out Price of 7.65. Will update accordingly

#Bitcoin - thoughts out loud #08Good evening, we are from Ukraine!
I expect further depreciation of the cryptocurrency market.
In this phase of the market, we are interested in a supply test in the range of 30,000-31,000, after which the further development of the situation will be clear. There is weakness on the older time frames, but there are variable factors in the market and it is too early to give an accurate assessment.
The end of the trading situation opens up 2 scenarios:
1) Asset depreciation to 17500.
2) The asset's price increase to 3500.
Thank you all for your attention, I wish you success.
Sometimes you win/sometimes you learn.
#Bitcoin
BINANCE:BTCUSDT

BTC's Year Long AccumulationLooking at the BTC weekly chart it is clear that for the last year BTC has been in an accumulation zone and the recent markup in March represents a breakout to the upside of this channel/zone.
November's markdown, mostly fueled by negative crypto news in the wake of FTX's collapse, resulted in a failed breakout to the downside.
Note the bar range differences in the sideways market after the November failed breakout and after March's breakout.

#Ethereum - thoughts out loud #11Good evening, we are from Ukraine!
Why was it necessary to place a limit buy order at this particular moment and what were the goals for profit-taking?
I'll start with the first one, because we are at the bottom of the trading range after manipulating (on volumes) with a false breakout of the lows and a quick resumption of purchases on the buy bars with an extended spread. That is, the technical reason is more in favor of the longs.
The second part of the question. The first target is the local high of 2160. Moreover, if the situation develops positively, the position can be held up to 2200, accompanying the instrument.
Thank you all for your attention, I wish you success.
Sometimes you win /sometimes you learn .
